Drug Delivery Devices Market Analysis North America, Europe, Asia, Rest of World (ROW) - US, Canada, Germany, UK, China, Japan, Spain, India, Brazil, Saudi Arabia - Size and Forecast 2024-2028

Drug Delivery Devices Market Analysis North America, Europe, Asia, Rest of World (ROW) - US, Canada, Germany, UK, China, Japan, Spain, India, Brazil, Saudi Arabia - Size and Forecast 2024-2028

Published: Nov 2024 167 Pages SKU: IRTNTR72348

Market Overview at a Glance

$85.1 B
Market Opportunity
6.2%
CAGR
5.8
YoY growth 2023-2024(%)

Drug Delivery Devices Market Size 2024-2028 

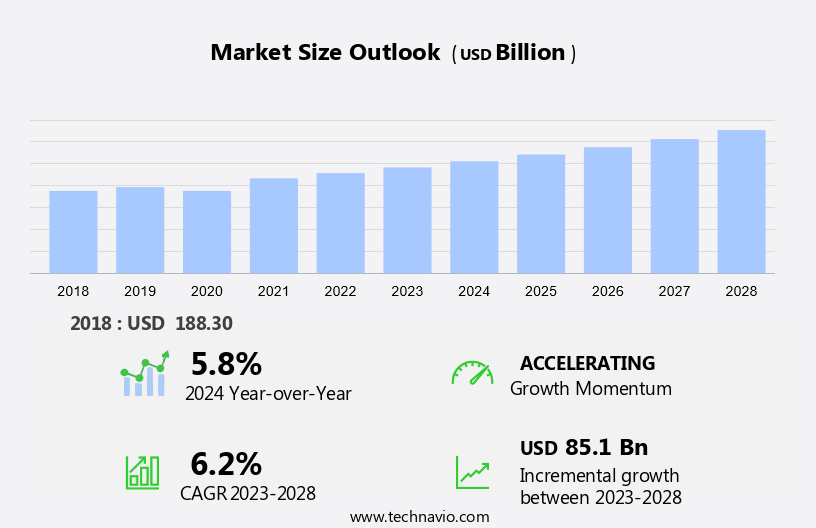
The drug delivery devices market size is forecast to increase by USD 85.1 billion at a CAGR of 6.2% between 2023 and 2028.

  • The market is experiencing significant growth due to the increasing prevalence of chronic conditions and the rising adoption of self-administering systems. Self-injectable devices, including auto-injectors and jet-injectors, are gaining popularity for their convenience and effectiveness in delivering drugs directly to the target site. However, bioavailability hurdles remain a challenge in oral delivery systems, leading to the increasing use of injectable routes. Pharmaceutical companies are investing heavily in research and development to address these challenges and create more efficient drug delivery systems.In healthcare, Retail pharmacies and hospital pharmacies are key distribution channels for these devices, ensuring easy access for patients. Stringent government regulations ensure the safety and efficacy of these devices, making them a reliable option for patients. The market is expected to continue growing as technology advances and new applications for drug delivery systems emerge.

What will be the Size of the Market During the Forecast Period?

Drug Delivery Devices Market Size

 Request Free Sample

  •  The market represents a significant segment within the pharmaceutical industry, offering innovative solutions for the effective and efficient administration of active pharmaceutical ingredients (APIs) in various therapeutic areas. These devices cater to both chronic diseases and non-chronic diseases, and their usage extends to home-care environments, retail pharmacies, hospital pharmacies, and online pharmacies. Advanced technology plays a crucial role in the development of drug delivery devices. Next-generation technologies, such as self-administering systems, auto-injectors, pen injectors, jet-injectors, prefilled syringes, and smart sensors, have gained popularity due to their patient-friendly designs and improved accuracy. In the context of chronic diseases, drug delivery devices have proven to be essential for targeted medication delivery.
  • Biologics drugs, which often require specific delivery methods, have particularly benefited from these advancements. The pharmaceutical industry's focus on diagnosis and treatment has led to the integration of drug delivery devices in various vaccination drives and therapeutic areas. Oral drug delivery and injectable drug delivery systems have shown remarkable progress, offering enhanced patient compliance and convenience. Homecare solutions have emerged as a key area of growth within the market. These devices enable patients to administer medications in the comfort of their homes, reducing the need for frequent hospital visits and improving overall patient care.

How is this market segmented and which is the largest segment?

The market research report provides comprehensive data (region-wise segment analysis), with forecasts and estimates in "USD billion" for the period 2024-2028, as well as historical data from 2018-2022 for the following segments.

  • Route Of Administration
    • Oral
    • Injectable
    • Pulmonary
    • Others
  • Geography
    • North America
      • Canada
      • US
    • Europe
      • Germany
      • UK
    • Asia
    • Rest of World (ROW)

By Route Of Administration Insights

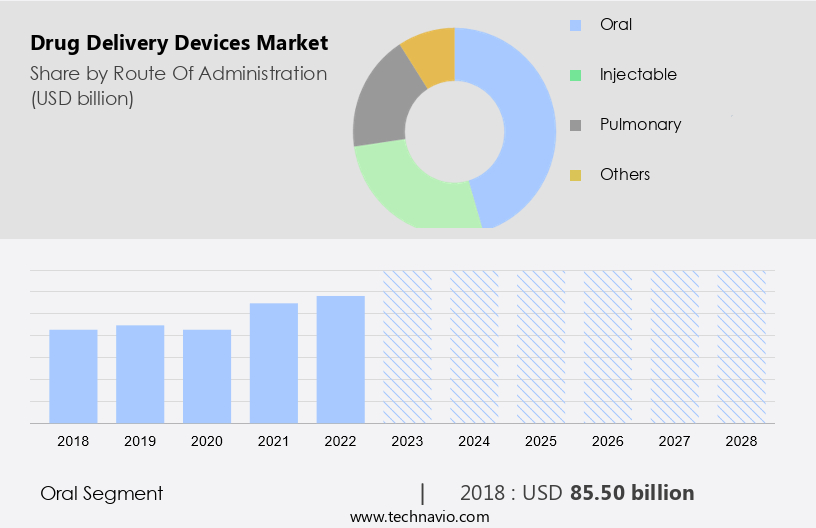
  • The oral segment is estimated to witness significant growth during the forecast period.

The market for Drug Delivery Devices encompasses various types of devices used for administering drugs, including Injection Devices, Oral Drug Delivery, Topical Drug Delivery, Ophthalmic Drug Delivery, and Nasal Drug Delivery. Among these, the segment for Oral Drug Delivery is significant due to its ease of use, non-invasive nature, and cost-effectiveness. This segment includes drugs in the form of capsules, tablets, syrups, solutions, and suspensions

Furthermore, orally administered drugs can be targeted to specific areas within the gastrointestinal tract to treat various conditions, including cancer, inflammation, infections, and bowel diseases. Advancements in pharmaceutical technologies and oral drug delivery systems, such as lipid-based carriers, nanocarriers, and micelles, are enhancing oral drug absorption, thereby improving therapeutic effectiveness.  Hence, such factors are fuelling the growth of this segment during the forecast period.

Drug Delivery Devices Market Size

Get a glance at the market report of share of various segments Request Free Sample

The oral segment was valued at USD 85.50 billion in 2018 and showed a gradual increase during the forecast period.

Regional Analysis

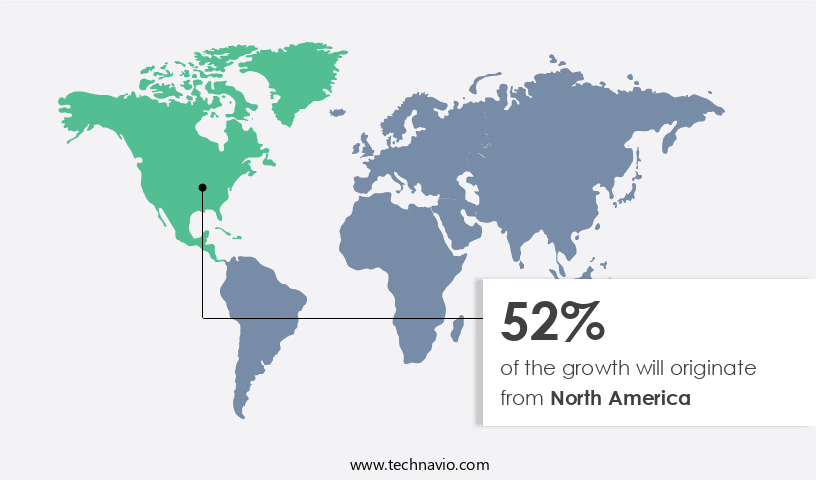
  • North America is estimated to contribute 52% to the growth of the global market during the forecast period.

Technavio's analysts have elaborately explained the regional trends and drivers that shape the market during the forecast period.

Drug Delivery Devices Market Share by Geography

For more insights on the market share of various regions Request Free Sample

The market in North America held the largest market share in the global industry in 2023. The US and Canada were the primary contributors to this region's dominance. Factors driving the market's expansion include the high incidence of chronic diseases like cancer, diabetes, and arthritis, increasing adoption of treatments for these conditions, a significant number of pharmaceutical companies, and new product launches. According to The World Bank Group, healthcare spending in North America rose from 14.10% of the GDP in 2005 to 16.41% in 2018. In 2020, healthcare expenditure in the US grew by 9%. This growth is attributed to the large and advanced healthcare infrastructure, which supports the development and implementation of innovative drug delivery devices.

Market Dynamics

Our researchers analyzed the data with 2023 as the base year, along with the key drivers, trends, and challenges. A holistic analysis of drivers will help companies refine their marketing strategies to gain a competitive advantage.

What are the key market drivers leading to the rise in adoption of Drug Delivery Devices Market ?

The growing prevalence of chronic conditions is the key driver of the market.

  • Chronic diseases, including diabetes, chronic kidney disease, cancer, arthritis, and Alzheimer's disease, are on the rise in developed countries like the US, Canada, the UK, Australia, France, and Germany. Next-generation drug delivery devices, such as prefilled syringes and pen injectors, are gaining popularity in home-care environments due to their patient-friendly designs. In the oncology and infectious diseases sectors, these devices offer significant benefits. Next-generation technologies, such as nanotechnology and biodegradable polymers, are being integrated into drug delivery devices to improve efficacy and patient compliance. Thus, such factors are driving the growth of the market during the forecast period.

What are the market trends shaping the Drug Delivery Devices Market?

The rising adoption of self-injectable devices is the upcoming trend in the market.

  • The self-administering market in the US is experiencing significant growth due to several factors enhancing patient convenience and ensuring medication adherence. Self-injectable devices, including autoinjectors and pen injectors, enable patients to administer their medications at home, which has gained prominence during the COVID-19 pandemic as people aim to minimize healthcare facility visits. The prevalence of chronic conditions such as diabetes, cancer, and autoimmune disorders necessitates regular medication administration, leading to a growing demand for these devices. Injectable routes remain a popular drug delivery application due to their ability to improve bioavailability and ensure precise dosing. Pharmaceutical companies and retail pharmacies in the US are increasingly stocking these devices to cater to the growing demand from patients. Drug Delivery Systems, including self-administering devices, play a crucial role in enhancing patient care and improving treatment outcomes.

What challenges does Drug Delivery Devices Market face during the growth?

Stringent government regulations is a key challenge affecting the market growth.

  • Drug delivery devices play a crucial role in addressing various health conditions, including respiratory diseases, diabetes, cardiovascular diseases, autoimmune diseases, neurology, and hospital-acquired infections. The effectiveness of these devices relies on precise drug distribution and optimal patient experience. Molecular interactions and target-based drug discovery have led to the development of advanced drug delivery systems. However, stringent regulatory requirements pose significant challenges for market growth. Regulatory bodies, such as the US Food and Drug Administration (FDA), enforce rigorous standards to ensure safety, efficacy, and quality. Extensive clinical trials and comprehensive documentation are necessary for product approval, which can delay market entry for innovative devices.
  • The complexity of regulatory frameworks varies across regions, making it essential for manufacturers to navigate a patchwork of guidelines. In home care settings, these devices offer convenience and improved patient outcomes. As the healthcare industry continues to evolve, drug delivery devices will remain a vital component of disease management strategies.

Exclusive Customer Landscape

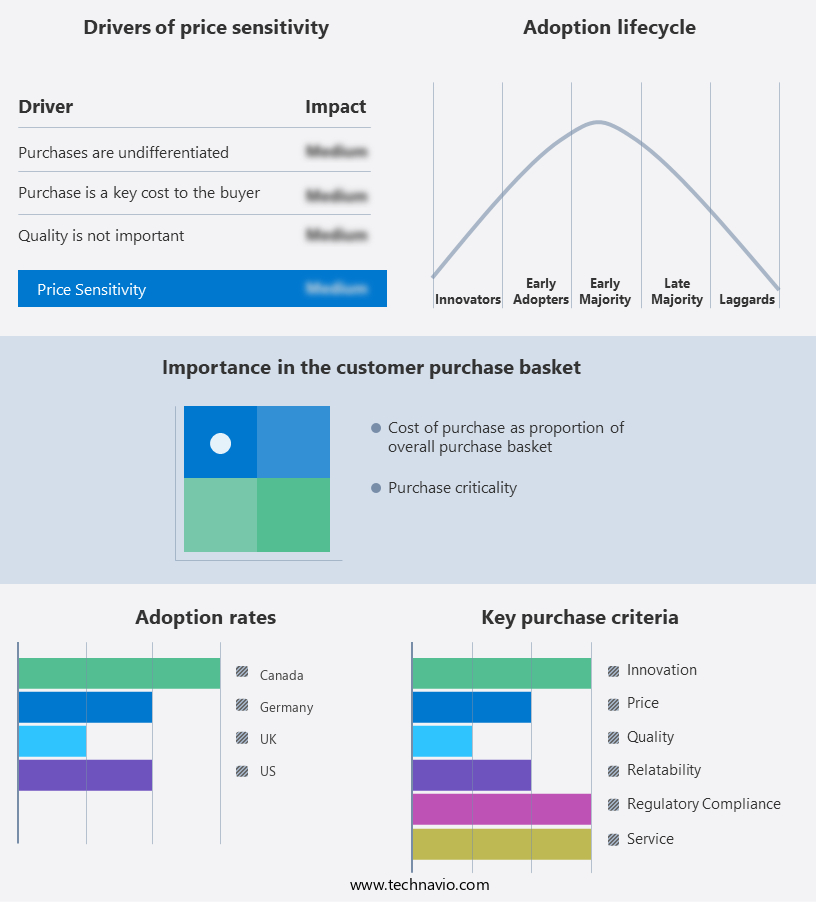
The market forecasting report includes the adoption lifecycle of the market, covering from the innovator's stage to the laggard's stage. It focuses on adoption rates in different regions based on penetration. Furthermore, the market report also includes key purchase criteria and drivers of price sensitivity to help companies evaluate and develop their market growth analysis strategies.

Drug Delivery Devices Market Share by Geography

 Customer Landscape

Key Companies & Market Insights

Companies are implementing various strategies, such as strategic alliances, market forecast , partnerships, mergers and acquisitions, geographical expansion, and product/service launches, to enhance their presence in the market. The market research and growth report includes detailed analyses of the competitive landscape of the market and information about key companies, including:

  • 3M Co.
  • AbbVie Inc.
  • Antares Pharma Inc.
  • AptarGroup Inc.
  • Becton Dickinson and Co.
  • Biocorp
  • Elcam Medical Group
  • F. Hoffmann La Roche Ltd.
  • Insulet Corp.
  • Johnson and Johnson Inc.
  • Koch Industries Inc.
  • Merck KGaA
  • Nemera Group
  • Novartis AG
  • Pfizer Inc.
  • SHL Medical AG
  • Teva Pharmaceutical Industries Ltd.
  • uniQure NV
  • West Pharmaceutical Services Inc.

Qualitative and quantitative analysis of companies has been conducted to help clients understand the wider business environment as well as the strengths and weaknesses of key market players. Data is qualitatively analyzed to categorize companies as pure play, category-focused, industry-focused, and diversified; it is quantitatively analyzed to categorize companies as dominant, leading, strong, tentative, and weak.

Research Analyst Overview

Drug delivery is a critical aspect of the pharmaceutical industry, focusing on delivering active pharmaceutical ingredients (APIs) to the target site in the body effectively and safely. Advanced technology plays a significant role in the development of next-generation drug delivery systems, addressing bioavailability hurdles and improving therapeutic effectiveness. These devices cater to various therapeutic areas, including oncology, infectious diseases, respiratory diseases, diabetes, cardiovascular diseases, autoimmune diseases, and neurology. Home-care environments have witnessed a surge in demand for patient-friendly devices such as prefilled syringes, pen injectors, auto-injectors, jet-injectors, and self-administering systems. The use of drug delivery systems extends beyond hospitals to retail pharmacies, hospital pharmacies, online pharmacies, vaccination drives, and e-pharmacies.

Additionally, patient experience is a crucial factor in the design and development of these devices, ensuring ease of use, minimal side effects, and compatibility with chronic and non-chronic diseases. Advanced delivery systems, such as targeted medication delivery using smart sensors, are revolutionizing the landscape, enabling biosimilar products to replicate the efficacy of conventional systems while offering improved patient outcomes. The pharmaceutical industry continues to invest in research and development, focusing on molecular interactions, target-based drug discovery, and drug delivery applications across various routes, including oral, injectable, topical, ophthalmic, nasal, pulmonary, transmucosal, and implantable drug delivery systems.

Market Scope

Report Coverage

Details

Page number

167

Base year

2023

Historic period

2018-2022

Forecast period

2024-2028

Growth momentum & CAGR

Accelerate at a CAGR of 6.2%

Market Growth 2024-2028

USD 85.1 billion

Market structure

Fragmented

YoY growth 2023-2024(%)

5.8

Key countries

US, Canada, Germany, and UK

Competitive landscape

Leading Companies, Market Positioning of Companies, Competitive Strategies, and Industry Risks

Request Free Sample

What are the Key Data Covered in this Market Research and Growth Report?

  • CAGR of the market during the forecast period
  • Detailed information on factors that will drive the market growth and forecasting between 2024 and 2028
  • Precise estimation of the size of the market  and its contribution of the market in focus to the parent market
  • Accurate predictions about upcoming market growth and trends and changes in consumer behaviour
  • Growth of the market across North America, Europe, Asia, and Rest of World (ROW)
  • Thorough analysis of the market's competitive landscape and detailed information about companies
  • Comprehensive analysis of factors that will challenge the growth of market companies

We can help! Our analysts can customize this market research report to meet your requirements. Get in touch

1 Executive Summary

  • 1.1 Market overview
    • Executive Summary - Chart on Market Overview
    • Executive Summary - Data Table on Market Overview
    • Executive Summary - Chart on Global Market Characteristics
    • Executive Summary - Chart on Market by Geography
    • Executive Summary - Chart on Market Segmentation by Route of Administration
    • Executive Summary - Chart on Incremental Growth
    • Executive Summary - Data Table on Incremental Growth
    • Executive Summary - Chart on Company Market Positioning

2 Technavio Analysis

  • 2.1 Analysis of price sensitivity, lifecycle, customer purchase basket, adoption rates, and purchase criteria
    • Analysis of price sensitivity, lifecycle, customer purchase basket, adoption rates, and purchase criteria
  • 2.2 Criticality of inputs and Factors of differentiation
    • Overview on criticality of inputs and factors of differentiation
  • 2.3 Factors of disruption
    • Overview on factors of disruption
  • 2.4 Impact of drivers and challenges
    • Impact of drivers and challenges in 2023 and 2028

3 Market Landscape

  • 3.1 Market ecosystem
    • Parent Market
    • Data Table on - Parent Market
  • 3.2 Market characteristics
    • Market characteristics analysis
  • 3.3 Value chain analysis
    • Value Chain Analysis

4 Market Sizing

  • 4.1 Market definition
    • Offerings of companies included in the market definition
  • 4.2 Market segment analysis
    • Market segments
  • 4.3 Market size 2023
    • 4.4 Market outlook: Forecast for 2023-2028
      • Chart on Global - Market size and forecast 2023-2028 ($ billion)
      • Data Table on Global - Market size and forecast 2023-2028 ($ billion)
      • Chart on Global Market: Year-over-year growth 2023-2028 (%)
      • Data Table on Global Market: Year-over-year growth 2023-2028 (%)

    5 Historic Market Size

    • 5.1 Global Drug Delivery Devices Market 2018 - 2022
      • Historic Market Size - Data Table on Global Drug Delivery Devices Market 2018 - 2022 ($ billion)
    • 5.2 Route of Administration segment analysis 2018 - 2022
      • Historic Market Size - Route of Administration Segment 2018 - 2022 ($ billion)
    • 5.3 Geography segment analysis 2018 - 2022
      • Historic Market Size - Geography Segment 2018 - 2022 ($ billion)
    • 5.4 Country segment analysis 2018 - 2022
      • Historic Market Size - Country Segment 2018 - 2022 ($ billion)

    6 Five Forces Analysis

    • 6.1 Five forces summary
      • Five forces analysis - Comparison between 2023 and 2028
    • 6.2 Bargaining power of buyers
      • Bargaining power of buyers - Impact of key factors 2023 and 2028
    • 6.3 Bargaining power of suppliers
      • Bargaining power of suppliers - Impact of key factors in 2023 and 2028
    • 6.4 Threat of new entrants
      • Threat of new entrants - Impact of key factors in 2023 and 2028
    • 6.5 Threat of substitutes
      • Threat of substitutes - Impact of key factors in 2023 and 2028
    • 6.6 Threat of rivalry
      • Threat of rivalry - Impact of key factors in 2023 and 2028
    • 6.7 Market condition
      • Chart on Market condition - Five forces 2023 and 2028

    7 Market Segmentation by Route of Administration

    • 7.1 Market segments
      • Chart on Route of Administration - Market share 2023-2028 (%)
      • Data Table on Route of Administration - Market share 2023-2028 (%)
    • 7.2 Comparison by Route of Administration
      • Chart on Comparison by Route of Administration
      • Data Table on Comparison by Route of Administration
    • 7.3 Oral - Market size and forecast 2023-2028
      • Chart on Oral - Market size and forecast 2023-2028 ($ billion)
      • Data Table on Oral - Market size and forecast 2023-2028 ($ billion)
      • Chart on Oral - Year-over-year growth 2023-2028 (%)
      • Data Table on Oral - Year-over-year growth 2023-2028 (%)
    • 7.4 Injectable - Market size and forecast 2023-2028
      • Chart on Injectable - Market size and forecast 2023-2028 ($ billion)
      • Data Table on Injectable - Market size and forecast 2023-2028 ($ billion)
      • Chart on Injectable - Year-over-year growth 2023-2028 (%)
      • Data Table on Injectable - Year-over-year growth 2023-2028 (%)
    • 7.5 Pulmonary - Market size and forecast 2023-2028
      • Chart on Pulmonary - Market size and forecast 2023-2028 ($ billion)
      • Data Table on Pulmonary - Market size and forecast 2023-2028 ($ billion)
      • Chart on Pulmonary - Year-over-year growth 2023-2028 (%)
      • Data Table on Pulmonary - Year-over-year growth 2023-2028 (%)
    • 7.6 Others - Market size and forecast 2023-2028
      • Chart on Others - Market size and forecast 2023-2028 ($ billion)
      • Data Table on Others - Market size and forecast 2023-2028 ($ billion)
      • Chart on Others - Year-over-year growth 2023-2028 (%)
      • Data Table on Others - Year-over-year growth 2023-2028 (%)
    • 7.7 Market opportunity by Route of Administration
      • Market opportunity by Route of Administration ($ billion)
      • Data Table on Market opportunity by Route of Administration ($ billion)

    8 Customer Landscape

    • 8.1 Customer landscape overview
      • Analysis of price sensitivity, lifecycle, customer purchase basket, adoption rates, and purchase criteria

    9 Geographic Landscape

    • 9.1 Geographic segmentation
      • Chart on Market share by geography 2023-2028 (%)
      • Data Table on Market share by geography 2023-2028 (%)
    • 9.2 Geographic comparison
      • Chart on Geographic comparison
      • Data Table on Geographic comparison
    • 9.3 North America - Market size and forecast 2023-2028
      • Chart on North America - Market size and forecast 2023-2028 ($ billion)
      • Data Table on North America - Market size and forecast 2023-2028 ($ billion)
      • Chart on North America - Year-over-year growth 2023-2028 (%)
      • Data Table on North America - Year-over-year growth 2023-2028 (%)
    • 9.4 Europe - Market size and forecast 2023-2028
      • Chart on Europe - Market size and forecast 2023-2028 ($ billion)
      • Data Table on Europe - Market size and forecast 2023-2028 ($ billion)
      • Chart on Europe - Year-over-year growth 2023-2028 (%)
      • Data Table on Europe - Year-over-year growth 2023-2028 (%)
    • 9.5 Asia - Market size and forecast 2023-2028
      • Chart on Asia - Market size and forecast 2023-2028 ($ billion)
      • Data Table on Asia - Market size and forecast 2023-2028 ($ billion)
      • Chart on Asia - Year-over-year growth 2023-2028 (%)
      • Data Table on Asia - Year-over-year growth 2023-2028 (%)
    • 9.6 Rest of World (ROW) - Market size and forecast 2023-2028
      • Chart on Rest of World (ROW) - Market size and forecast 2023-2028 ($ billion)
      • Data Table on Rest of World (ROW) - Market size and forecast 2023-2028 ($ billion)
      • Chart on Rest of World (ROW) - Year-over-year growth 2023-2028 (%)
      • Data Table on Rest of World (ROW) - Year-over-year growth 2023-2028 (%)
    • 9.7 US - Market size and forecast 2023-2028
      • Chart on US - Market size and forecast 2023-2028 ($ billion)
      • Data Table on US - Market size and forecast 2023-2028 ($ billion)
      • Chart on US - Year-over-year growth 2023-2028 (%)
      • Data Table on US - Year-over-year growth 2023-2028 (%)
    • 9.8 Canada - Market size and forecast 2023-2028
      • Chart on Canada - Market size and forecast 2023-2028 ($ billion)
      • Data Table on Canada - Market size and forecast 2023-2028 ($ billion)
      • Chart on Canada - Year-over-year growth 2023-2028 (%)
      • Data Table on Canada - Year-over-year growth 2023-2028 (%)
    • 9.9 Germany - Market size and forecast 2023-2028
      • Chart on Germany - Market size and forecast 2023-2028 ($ billion)
      • Data Table on Germany - Market size and forecast 2023-2028 ($ billion)
      • Chart on Germany - Year-over-year growth 2023-2028 (%)
      • Data Table on Germany - Year-over-year growth 2023-2028 (%)
    • 9.10 China - Market size and forecast 2023-2028
      • Chart on China - Market size and forecast 2023-2028 ($ billion)
      • Data Table on China - Market size and forecast 2023-2028 ($ billion)
      • Chart on China - Year-over-year growth 2023-2028 (%)
      • Data Table on China - Year-over-year growth 2023-2028 (%)
    • 9.11 UK - Market size and forecast 2023-2028
      • Chart on UK - Market size and forecast 2023-2028 ($ billion)
      • Data Table on UK - Market size and forecast 2023-2028 ($ billion)
      • Chart on UK - Year-over-year growth 2023-2028 (%)
      • Data Table on UK - Year-over-year growth 2023-2028 (%)
    • 9.12 Japan - Market size and forecast 2023-2028
      • Chart on Japan - Market size and forecast 2023-2028 ($ billion)
      • Data Table on Japan - Market size and forecast 2023-2028 ($ billion)
      • Chart on Japan - Year-over-year growth 2023-2028 (%)
      • Data Table on Japan - Year-over-year growth 2023-2028 (%)
    • 9.13 Spain - Market size and forecast 2023-2028
      • Chart on Spain - Market size and forecast 2023-2028 ($ billion)
      • Data Table on Spain - Market size and forecast 2023-2028 ($ billion)
      • Chart on Spain - Year-over-year growth 2023-2028 (%)
      • Data Table on Spain - Year-over-year growth 2023-2028 (%)
    • 9.14 India - Market size and forecast 2023-2028
      • Chart on India - Market size and forecast 2023-2028 ($ billion)
      • Data Table on India - Market size and forecast 2023-2028 ($ billion)
      • Chart on India - Year-over-year growth 2023-2028 (%)
      • Data Table on India - Year-over-year growth 2023-2028 (%)
    • 9.15 Brazil - Market size and forecast 2023-2028
      • Chart on Brazil - Market size and forecast 2023-2028 ($ billion)
      • Data Table on Brazil - Market size and forecast 2023-2028 ($ billion)
      • Chart on Brazil - Year-over-year growth 2023-2028 (%)
      • Data Table on Brazil - Year-over-year growth 2023-2028 (%)
    • 9.16 Saudi Arabia - Market size and forecast 2023-2028
      • Chart on Saudi Arabia - Market size and forecast 2023-2028 ($ billion)
      • Data Table on Saudi Arabia - Market size and forecast 2023-2028 ($ billion)
      • Chart on Saudi Arabia - Year-over-year growth 2023-2028 (%)
      • Data Table on Saudi Arabia - Year-over-year growth 2023-2028 (%)
    • 9.17 Market opportunity by geography
      • Market opportunity by geography ($ billion)
      • Data Tables on Market opportunity by geography ($ billion)

    10 Drivers, Challenges, and Opportunity/Restraints

    • 10.1 Market drivers
      • 10.2 Market challenges
        • 10.3 Impact of drivers and challenges
          • Impact of drivers and challenges in 2023 and 2028
        • 10.4 Market opportunities/restraints

          11 Competitive Landscape

          • 11.1 Overview
            • 11.2 Competitive Landscape
              • Overview on criticality of inputs and factors of differentiation
            • 11.3 Landscape disruption
              • Overview on factors of disruption
            • 11.4 Industry risks
              • Impact of key risks on business

            12 Competitive Analysis

            • 12.1 Companies profiled
              • Companies covered
            • 12.2 Company ranking index
              • Company ranking index
            • 12.3 Market positioning of companies
              • Matrix on companies position and classification
            • 3M Co.
              • 3M Co. - Overview
              • 3M Co. - Business segments
              • 3M Co. - Key news
              • 3M Co. - Key offerings
              • 3M Co. - Segment focus
              • SWOT
            • 12.5 AbbVie Inc.
              • AbbVie Inc. - Overview
              • AbbVie Inc. - Product / Service
              • AbbVie Inc. - Key news
              • AbbVie Inc. - Key offerings
              • SWOT
            • 12.6 Antares Pharma Inc.
              • Antares Pharma Inc. - Overview
              • Antares Pharma Inc. - Product / Service
              • Antares Pharma Inc. - Key offerings
              • SWOT
            • 12.7 Becton Dickinson and Co.
              • Becton Dickinson and Co. - Overview
              • Becton Dickinson and Co. - Business segments
              • Becton Dickinson and Co. - Key news
              • Becton Dickinson and Co. - Key offerings
              • Becton Dickinson and Co. - Segment focus
              • SWOT
            • 12.8 Biocorp
              • Biocorp - Overview
              • Biocorp - Product / Service
              • Biocorp - Key offerings
              • SWOT
            • 12.9 F. Hoffmann La Roche Ltd.
              • F. Hoffmann La Roche Ltd. - Overview
              • F. Hoffmann La Roche Ltd. - Business segments
              • F. Hoffmann La Roche Ltd. - Key news
              • F. Hoffmann La Roche Ltd. - Key offerings
              • F. Hoffmann La Roche Ltd. - Segment focus
              • SWOT
            • 12.10 Johnson and Johnson Inc.
              • Johnson and Johnson Inc. - Overview
              • Johnson and Johnson Inc. - Business segments
              • Johnson and Johnson Inc. - Key news
              • Johnson and Johnson Inc. - Key offerings
              • Johnson and Johnson Inc. - Segment focus
              • SWOT
            • 12.11 Novartis AG
              • Novartis AG - Overview
              • Novartis AG - Business segments
              • Novartis AG - Key news
              • Novartis AG - Key offerings
              • Novartis AG - Segment focus
              • SWOT
            • 12.12 Pfizer Inc.
              • Pfizer Inc. - Overview
              • Pfizer Inc. - Product / Service
              • Pfizer Inc. - Key news
              • Pfizer Inc. - Key offerings
              • SWOT
            • 12.13 Teva Pharmaceutical Industries Ltd.
              • Teva Pharmaceutical Industries Ltd. - Overview
              • Teva Pharmaceutical Industries Ltd. - Business segments
              • Teva Pharmaceutical Industries Ltd. - Key news
              • Teva Pharmaceutical Industries Ltd. - Key offerings
              • Teva Pharmaceutical Industries Ltd. - Segment focus
              • SWOT

            13 Appendix

            • 13.1 Scope of the report
              • 13.2 Inclusions and exclusions checklist
                • Inclusions checklist
                • Exclusions checklist
              • 13.3 Currency conversion rates for US$
                • Currency conversion rates for US$
              • 13.4 Research methodology
                • Research methodology
              • 13.5 Data procurement
                • Information sources
              • 13.6 Data validation
                • Data validation
              • 13.7 Validation techniques employed for market sizing
                • Validation techniques employed for market sizing
              • 13.8 Data synthesis
                • Data synthesis
              • 13.9 360 degree market analysis
                • 360 degree market analysis
              • 13.10 List of abbreviations
                • List of abbreviations

              Research Methodology

              Technavio presents a detailed picture of the market by way of study, synthesis, and summation of data from multiple sources. The analysts have presented the various facets of the market with a particular focus on identifying the key industry influencers. The data thus presented is comprehensive, reliable, and the result of extensive research, both primary and secondary.

              INFORMATION SOURCES

              Primary sources

              • Manufacturers and suppliers
              • Channel partners
              • Industry experts
              • Strategic decision makers

              Secondary sources

              • Industry journals and periodicals
              • Government data
              • Financial reports of key industry players
              • Historical data
              • Press releases

              DATA ANALYSIS

              Data Synthesis

              • Collation of data
              • Estimation of key figures
              • Analysis of derived insights

              Data Validation

              • Triangulation with data models
              • Reference against proprietary databases
              • Corroboration with industry experts

              REPORT WRITING

              Qualitative

              • Market drivers
              • Market challenges
              • Market trends
              • Five forces analysis

              Quantitative

              • Market size and forecast
              • Market segmentation
              • Geographical insights
              • Competitive landscape

              Interested in this report?

              Get your sample now to see our research methodology and insights!

              Download Now

              Frequently Asked Questions

              Drug Delivery Devices market growth will increase by $ 85.1 bn during 2024-2028.

              The Drug Delivery Devices market is expected to grow at a CAGR of 6.2% during 2024-2028.

              Drug Delivery Devices market is segmented by Route Of Administration( Oral, Injectable, Pulmonary, Others) Geographic( North America, Europe, Asia, ROW)

              3M Co., AbbVie Inc., Antares Pharma Inc., AptarGroup Inc., Becton Dickinson and Co., Biocorp, Elcam Medical Group, F. Hoffmann La Roche Ltd., Insulet Corp., Johnson and Johnson Inc., Koch Industries Inc., Merck KGaA, Nemera Group, Novartis AG, Pfizer Inc., SHL Medical AG, Teva Pharmaceutical Industries Ltd., uniQure NV, West Pharmaceutical Services Inc. are a few of the key vendors in the Drug Delivery Devices market.

              North America will register the highest growth rate of 52% among the other regions. Therefore, the Drug Delivery Devices market in North America is expected to garner significant business opportunities for the vendors during the forecast period.

              US, Canada, Germany, UK

              • Growing prevalence of chronic conditionsThere is a growing prevalence of chronic diseases is the driving factor this market.
              • such as diabetes is the driving factor this market.
              • chronic kidney disease is the driving factor this market.
              • cancer is the driving factor this market.
              • arthritis is the driving factor this market.
              • and Alzheimers disease worldwide. Developed nations such as the US is the driving factor this market.
              • Canada is the driving factor this market.
              • the UK is the driving factor this market.
              • Australia is the driving factor this market.
              • France is the driving factor this market.
              • Germany is the driving factor this market.
              • and others are witnessing a continuous increase in the number of people diagnosed with such diseases. This can be attributed to the changes in the lifestyle and eating habits of consumers in these countries. For instance is the driving factor this market.
              • according to the data provided by International Diabetes Federation (IDF) is the driving factor this market.
              • in 2021 is the driving factor this market.
              • approximately 537 million adults in the age group of 20-80 years were living with diabetes globally. The number of people living with diabetes globally is projected to rise to 643 million by 2030 and 783 million by 2045. According to the organization is the driving factor this market.
              • every 3 out of 4 adults with diabetes live in low- and middle-income countries such as India is the driving factor this market.
              • China is the driving factor this market.
              • Brazil is the driving factor this market.
              • among others. As of 2021 is the driving factor this market.
              • more than 1.2 million infants and adolescents in the age group of 0-19 years were living with Type 1 diabetes. A total of 541 million adults are at increased risk of developing Type 2 diabetes worldwide.According to the World Health Organization (WHO) is the driving factor this market.
              • in 2020 is the driving factor this market.
              • there was an increase in the number of new cancer cases worldwide. According to the data provided by the WHO is the driving factor this market.
              • in 2020 is the driving factor this market.
              • there were more than 2.21 million lung cancer cases is the driving factor this market.
              • more than 1.93 million colon and rectum cancer cases is the driving factor this market.
              • and more than 1.09 million stomach cancer cases. According to the International Agency for Research on Cancer (IARC) is the driving factor this market.
              • the number of new cancer cases will increase to approximately 28.9 million by 2040 is the driving factor this market.
              • rising from 19.3 million cases in 2020. Regions such as North America is the driving factor this market.
              • Asia is the driving factor this market.
              • Europe is the driving factor this market.
              • and Africa are expected to witness an increase in new cancer cases to 3.53 million is the driving factor this market.
              • 15.1 million is the driving factor this market.
              • 5.32 million is the driving factor this market.
              • and 2.10 million is the driving factor this market.
              • respectively is the driving factor this market.
              • by 2040.The outbreak of COVID-19 was declared a pandemic by WHO on March 11 is the driving factor this market.
              • 2020. The number of COVID-19 cases in various countries across the world has steadily been increasing since then. As per data provided by WHO is the driving factor this market.
              • in the fourth week of January 2022 is the driving factor this market.
              • over 18 million new COVID-19 cases were reported globally is the driving factor this market.
              • a 20% increase compared to the previous week. These cases increased across various regions is the driving factor this market.
              • with Southeast Asia and the Eastern Mediterranean region witnessing a rise of 145% and 68% is the driving factor this market.
              • respectively.The growing prevalence of chronic conditions such as cancer is the driving factor this market.
              • diabetes is the driving factor this market.
              • cardiovascular diseases is the driving factor this market.
              • among others is the driving factor this market.
              • will lead to an increased demand for drug delivery devices. This will drive the growth of the global drug delivery devices market during the forecast period. is the driving factor this market.

              The Drug Delivery Devices market vendors should focus on grabbing business opportunities from the Oral segment as it accounted for the largest market share in the base year.
              RIA - Research AI Assistant
              Ask RIA