Dry Mix Mortar Additives And Chemicals Market Analysis APAC, Europe, North America, Middle East and Africa, South America - China, Japan, India, Indonesia, US, Turkey, Germany, UK, France, Canada - Size and Forecast 2024-2028

Dry Mix Mortar Additives And Chemicals Market Analysis APAC, Europe, North America, Middle East and Africa, South America - China, Japan, India, Indonesia, US, Turkey, Germany, UK, France, Canada - Size and Forecast 2024-2028

Published: Nov 2024 172 Pages SKU: IRTNTR72281

Market Overview at a Glance

$13.79 B
Market Opportunity
4.9%
CAGR
4.6
YoY growth 2023-2024(%)

Dry Mix Mortar Additives And Chemicals Market Size 2024-2028 

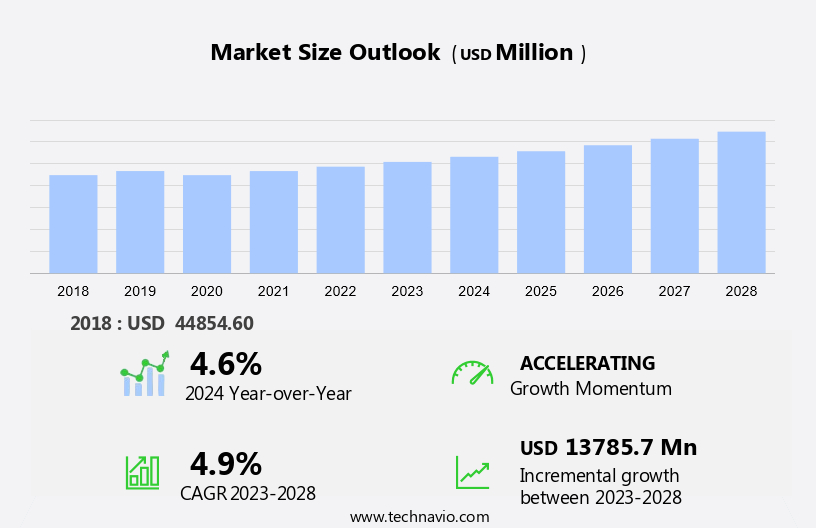
The dry mix mortar additives and chemicals market size is forecast to increase by USD 13.79 billion at a CAGR of 4.9% between 2023 and 2028.

  • The market is experiencing significant growth due to several key trends. The rapid increase in  construction projects is driving market demand, as these additives and chemicals enhance the durability and strength of the mortar. Additionally, the demand from the marine industry is expanding, as dry mix mortar additives and chemicals are essential for waterproofing and corrosion resistance in marine applications.
  • However, the lack of customization In the production process poses a challenge for market growth. Producers must address this issue by offering more tailored solutions to meet the unique requirements of various industries and applications. Overall, the market is expected to continue its growth trajectory, driven by these trends and the increasing demand for high-performance construction materials.

What will be the Size of the Dry Mix Mortar Additives And Chemicals Market During the Forecast Period?

Dry Mix Mortar Additives And Chemicals Market Size

 Request Free Sample

  • The market In the United States is experiencing significant growth due to the increasing demand for high-performance mortars in various construction sectors. Mortar properties such as bonding strength, water retention, and resistance to abrasion and waterproof performance are key factors driving market growth. These additives and chemicals are used extensively in residential, commercial, and industrial construction projects, including plastering, flooring, and waterproofing applications.
  • Additionally, eco-friendly construction practices are also influencing market trends, with the increasing use of re-dispersible powders and polymer dispersions as sustainable alternatives to traditional additives. Additionally, the demand for additives that enhance adhesion, accelerate setting times, and improve cement grout and wall putty performance is on the rise. Key applications for dry mix mortar additives and chemicals include reinforced concrete, masonry activities, prefabricated buildings, desalination plants, and waterproofing slurries. Market growth is expected to continue as the construction industry continues to evolve and adopt new technologies and sustainable practices.

How is this Dry Mix Mortar Additives And Chemicals Industry segmented and which is the largest segment?

The dry mix mortar additives and chemicals industry research report provides comprehensive data (region-wise segment analysis), with forecasts and estimates in "USD billion" for the period 2024-2028, as well as historical data from 2018-2022 for the following segments.
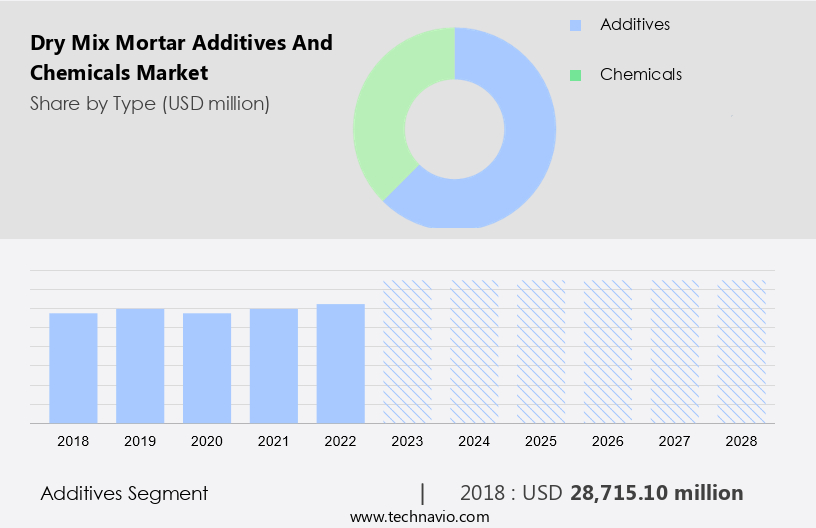
  • Type
    • Additives
    • Chemicals
  • Geography
    • APAC
      • China
      • India
      • Japan
    • Europe
      • Germany
      • UK
      • France
    • North America
      • Canada
      • US
    • Middle East and Africa
    • South America

By Type Insights

  • The additives segment is estimated to witness significant growth during the forecast period.

The additives segment of the global dry mix mortar market consists of re-dispersible polymer powder, plasticizers, defoamers, cellulose ether, air-entraining agents, and other additives. Re-dispersible polymer powder, a crucial additive, enhances adhesion to the substrate and provides abrasion resistance. Obtained through spray-drying ethylene-vinyl acetate polymer, it is a free-flowing, water-soluble white powder. Upon contact with water, these powders redisperse into liquid emulsions, replicating the original emulsions' properties. Enhancing bending and flexural strength, impact resistance, durability, and abrasion resistance in dry mix mortar, re-dispersible polymer powder is a valuable addition to the construction industry. These additives contribute significantly to the production of waterproofing, insulation, energy-efficient buildings, and sustainable building materials. They are essential for modernization renovations, smart city projects, and ecofriendly and biobased additives.

Dry Mix Mortar Additives And Chemicals Market Size

Get a glance at the  Dry Mix Mortar Additives And Chemicals Industry report of share of various segments Request Free Sample

The additives segment was valued at USD 28.72 billion in 2018 and showed a gradual increase during the forecast period.

Regional Analysis

  • APAC is estimated to contribute 73% to the growth of the global market during the forecast period.

Technavio's analysts have elaborately explained the regional trends and drivers that shape the market during the forecast period.

Dry Mix Mortar Additives And Chemicals Market Share by Geography

For more insights on the market share of various regions, Request Free Sample

The market in Asia Pacific is projected to expand due to the growing construction industry In the region. Countries such as India, Vietnam, Thailand, and Malaysia are experiencing significant growth in construction activities, driven by low labor costs and minimal regulations. For instance, China's plan to develop ten industrial parks In the Guangdong-Hong Kong-Macao Greater Bay Area under the one town with one thematic industry policy is expected to boost market growth, with the government investing approximately USD 565-USD 570 million. Eco-friendly construction practices are also gaining popularity, leading to increased demand for additives such as re-dispersible powders and polymer dispersions, which enhance adhesion, abrasion resistance, and waterproof performance in mortar. Key additives like anticaking agents ensure the smooth flow of dry mix mortar, improving productivity and efficiency.

Market Dynamics

Our dry mix mortar additives and chemicals market researchers analyzed the data with 2023 as the base year, along with the key drivers, trends, and challenges. A holistic analysis of drivers will help companies refine their marketing strategies to gain a competitive advantage.

What are the key market drivers leading to the rise In the adoption of Dry Mix Mortar Additives And Chemicals Industry?

Rapid increase in road and bridge construction is the key driver of the market.

  • Dry mix mortar additives and chemicals play a crucial role in enhancing the properties of mortar in various construction applications. In the US market, these additives and chemicals are extensively used in residential, commercial, and industrial construction projects. For instance, in residential construction, they improve bonding strength, water retention, and adhesion in plastering and flooring applications. In commercial and industrial construction, they ensure construction quality, energy efficiency, and sustainability in waterproofing, insulation, and prefabricated buildings. The construction industry's shift towards eco-friendly and sustainable building materials is driving the demand for ecofriendly additives, biobased additives, and nanotechnology in dry mix mortar additives and chemicals.
  • Additionally, smart city projects and modernization renovations also require innovative mortar chemicals for IoT monitoring, construction technology, and delayed hardening. The US construction industry's focus on green construction norms and sustainable practices is increasing the demand for sustainable additives and recycling solutions. The home decoration industry, cement, cement grouts, sand, admixtures, wall putty, reinforced concrete, masonry activities, tile adhesives, tile joint fillers, floor screeds, machinery installation, and desalination plants are some of the major sectors utilizing dry mix mortar additives and chemicals. The US infrastructure development sector's growth, with investments in roads, bridges, and other construction activities, is expected to boost the demand for these additives and chemicals.
  • For instance, the American Society of Civil Engineers estimates that the US needs to invest approximately USD 2 trillion in infrastructure over the next ten years. This investment will create a significant demand for construction materials, including dry mix mortar additives and chemicals. In addition, the US market is expected to grow significantly due to the increasing demand for sustainable and eco-friendly construction materials, government investments in infrastructure development, and the growing construction activities in various sectors.

What are the market trends shaping the Dry Mix Mortar Additives And Chemicals Industry?

Demand from the marine industry is the upcoming market trend.

  • The market in the US is witnessing significant growth due to increasing investments in various construction sectors, including residential, commercial, and industrial. Mortar properties such as bonding strength, water retention, and adhesion are crucial factors driving the demand for these additives and chemicals. In the residential sector, the trend toward energy-efficient buildings and sustainable practices is leading to increased use of eco-friendly additives, biobased additives, and nanotechnology. In commercial and industrial construction, applications such as plastering, flooring, waterproofing, insulation, and construction quality require specialized mortar solutions. The construction technology industry is also embracing innovative mortar chemicals for prefabricated buildings, desalination plants, and infrastructure development.
  • Additionally, construction activities in sectors like home decoration, cement, cement grouts, sand, admixtures, wall putty, reinforced concrete, masonry activities, tile adhesives, tile joint fillers, floor screeds, machinery installation, and delayed hardening are major consumers of dry mix mortar additives and chemicals. The need for smart additives, IoT monitoring, and sustainable practices is also driving market growth. Key trends include the use of re-dispersible powders, polymer dispersions, anticaking agents, and accelerators. In the US, the market for dry mix mortar additives and chemicals is expected to grow steadily, driven by the increasing demand for high-performance mortars in various construction applications. The market is also being influenced by green construction norms and the availability of recycling solutions. The use of these additives and chemicals in modernization renovations, smart city projects, and eco-friendly construction is further expected to fuel market growth.

What challenges does the Dry Mix Mortar Additives And Chemicals Industry face during its growth?

Lack of customization in the production process of dry mix mortar additives and chemicals is a key challenge affecting the industry's growth.

  • The market faces a challenge due to the lack of customization in production processes. With the construction industry's increasing demand for durable and cost-effective solutions, the inability of manufacturers to tailor products to specific project requirements can hinder market growth and competitiveness. Different construction projects necessitate unique formulations of dry mix mortar that cater to varying environmental conditions, application methods, and performance standards. However, many producers rely on standardized formulations, which may not meet the specific needs of diverse markets, particularly in regions with distinct climatic or regulatory requirements. Customization is essential for enhancing mortar properties such as bonding strength, water retention, and resistance to abrasion and waterproof performance. These properties are crucial for various applications, including residential, commercial, and industrial construction, plastering, flooring, waterproofing, insulation, and construction quality in energy-efficient buildings and sustainable building materials.
  • Moreover, the use of eco-friendly additives, biobased additives, nanotechnology, recycling solutions, and sustainable practices aligns with green construction norms and smart city projects, modernization renovations, and IoT monitoring in construction technology. Infrastructural development and construction activities, such as prefabricated buildings, desalination plants, and machinery installation, require delayed hardening and accelerators. The home decoration industry, cement, cement grouts, sand, admixtures, wall putty, reinforced concrete, masonry activities, tile adhesives, tile joint fillers, floor screeds, and machinery installation also benefit from innovative mortar chemicals. By addressing the need for customization, producers can cater to diverse markets and meet specific project requirements, ultimately driving growth In the market.

Exclusive Customer Landscape

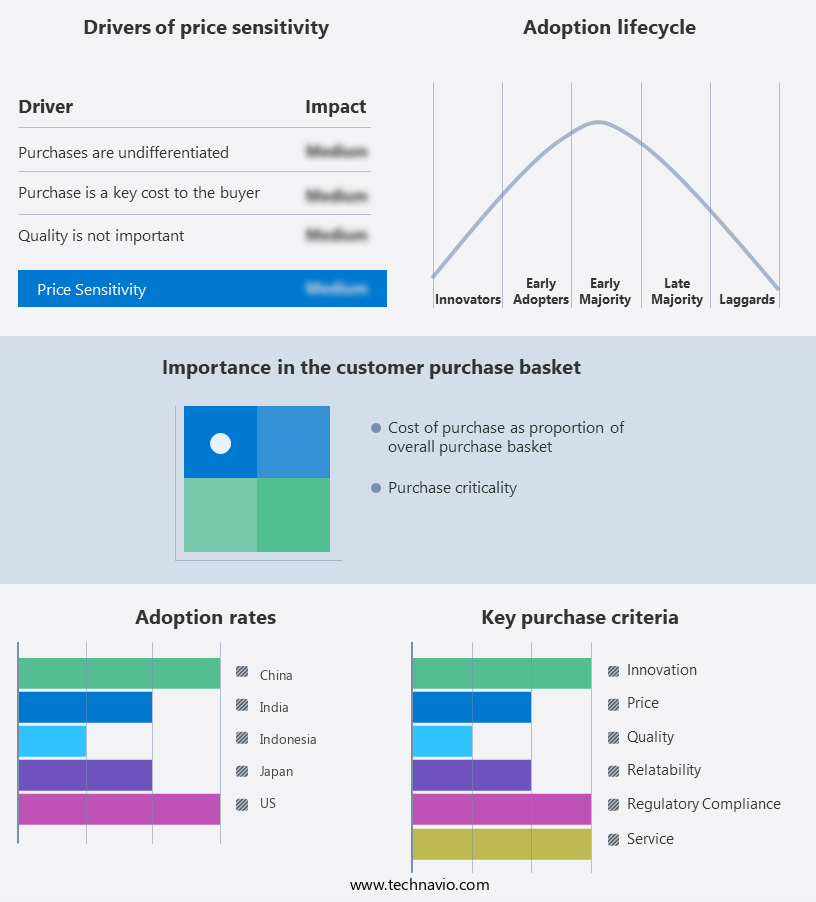
The dry mix mortar additives and chemicals market forecasting report includes the adoption lifecycle of the market, covering from the innovator's stage to the laggard's stage. It focuses on adoption rates in different regions based on penetration. Furthermore, the dry mix mortar additives and chemicals market report also include key purchase criteria and drivers of price sensitivity to help companies evaluate and develop their market growth analysis strategies.

Dry Mix Mortar Additives And Chemicals Market Share by Geography

 Customer Landscape

Key Companies & Market Insights

Companies are implementing various strategies, such as strategic alliances, dry mix mortar additives and chemicals market forecast, partnerships, mergers and acquisitions, geographical expansion, and product/service launches, to enhance their presence In the industry. The industry research and growth report includes detailed analyses of the competitive landscape of the market and information about key companies, including:

  • Altana AG
  • Ashland Inc.
  • BASF SE
  • Celanese Corp.
  • CEMEX SAB de CV
  • CHT Germany GmbH
  • Clariant International Ltd
  • Compagnie de Saint-Gobain SA
  • Don Construction Products Inc.
  • Dow Inc.
  • Evonik Industries AG
  • Holcim Ltd.
  • Innospec Inc.
  • Mapei SpA
  • Nouryon Chemicals Holding B.V.
  • Qingdao Oubo Chemical Co. Ltd.
  • Sidley Chemical Co. Ltd.
  • Sika AG
  • The Euclid Chemical Co.
  • Wacker Chemie AG

Qualitative and quantitative analysis of companies has been conducted to help clients understand the wider business environment as well as the strengths and weaknesses of key industry players. Data is qualitatively analyzed to categorize companies as pure play, category-focused, industry-focused, and diversified; it is quantitatively analyzed to categorize companies as dominant, leading, strong, tentative, and weak.

Research Analyst Overview

The construction industry continues to evolve, driven by the need for improved performance, sustainability, and efficiency. Dry mix mortar additives and chemicals play a crucial role in enhancing the properties of mortar, enabling the delivery of high-quality structures in various sectors, including residential, commercial, and industrial construction. Mortar additives and chemicals contribute significantly to the overall performance of the mortar mix. They improve bonding strength, water retention, and other essential properties, ensuring the durability and longevity of structures. In the realm of residential construction, these additives help create stronger, more energy-efficient homes. In commercial and industrial applications, they contribute to the construction of structures that can withstand heavy loads and harsh conditions. Plastering and flooring are two essential applications where dry mix mortar additives and chemicals make a significant impact.  For plastering, these additives ensure better adhesion and improved waterproof performance, resulting in smoother, more durable finishes. In flooring applications, they contribute to enhanced abrasion resistance, ensuring the longevity of the flooring system. Waterproofing and insulation are critical aspects of modern construction. Dry mix mortar additives and chemicals play a significant role in enhancing the waterproof performance of mortar, making structures more resilient against water damage.

Additionally, they contribute to the insulation properties of the mortar, helping to create energy-efficient buildings that adhere to green construction norms. The construction industry's shift towards sustainable practices has led to an increased focus on eco-friendly additives and biobased alternatives. Nanotechnology and recycling solutions are being explored to create innovative mortar chemicals that reduce the environmental impact of construction activities. Sustainable practices, such as the use of re-dispersible powders and polymer dispersions, are gaining popularity as they offer improved performance and reduced environmental impact. Smart city projects and modernization renovations require mortar additives and chemicals that can meet the demands of advanced construction technology. Accelerators and delayed hardening agents are essential in these applications, enabling the use of prefabricated buildings and machinery installation. In the home decoration industry, wall putty and tile adhesives benefit from the addition of smart additives, which can include IoT monitoring and construction technology. The construction industry's evolution is driven by the need for improved performance, sustainability, and efficiency. Dry mix mortar additives and chemicals play a crucial role in enabling the delivery of high-quality structures across various sectors.

From residential and commercial construction to industrial applications, plastering, flooring, waterproofing, insulation, and more, these additives and chemicals are essential in creating structures that meet the demands of modern construction. In addition, the market for dry mix mortar additives and chemicals is dynamic and evolving, driven by the need for improved performance, sustainability, and efficiency In the construction industry. From enhancing bonding strength and water retention to contributing to eco-friendly and smart construction practices, these additives and chemicals are essential in creating structures that meet the demands of modern construction.

Dry Mix Mortar Additives And Chemicals Market Scope

Report Coverage

Details

Page number

172

Base year

2023

Historic period

2018-2022

Forecast period

2024-2028

Growth momentum & CAGR

Accelerate at a CAGR of 4.9%

Market growth 2024-2028

USD 13.79 billion

Market structure

Fragmented

YoY growth 2023-2024(%)

4.6

Key countries

China, Japan, India, Indonesia, US, Turkey, Germany, UK, France, and Canada

Competitive landscape

Leading Companies, Market Positioning of Companies, Competitive Strategies, and Industry Risks

Request Free Sample

What are the Key Data Covered in this Dry Mix Mortar Additives And Chemicals Market Research and Growth Report?

  • CAGR of the Dry Mix Mortar Additives And Chemicals industry during the forecast period
  • Detailed information on factors that will drive the Dry Mix Mortar Additives And Chemicals growth and forecasting between 2024 and 2028
  • Precise estimation of the size of the market and its contribution of the industry in focus to the parent market
  • Accurate predictions about upcoming growth and trends and changes in consumer behaviour
  • Growth of the market across APAC, Europe, North America, Middle East and Africa, and South America
  • Thorough analysis of the market's competitive landscape and detailed information about companies
  • Comprehensive analysis of factors that will challenge the dry mix mortar additives and chemicals market growth of industry companies

We can help! Our analysts can customize this dry mix mortar additives and chemicals market research report to meet your requirements.

Get in touch

1 Executive Summary

  • 1.1 Market overview
    • Executive Summary - Chart on Market Overview
    • Executive Summary - Data Table on Market Overview
    • Executive Summary - Chart on Global Market Characteristics
    • Executive Summary - Chart on Market by Geography
    • Executive Summary - Chart on Market Segmentation by Type
    • Executive Summary - Chart on Incremental Growth
    • Executive Summary - Data Table on Incremental Growth
    • Executive Summary - Chart on Company Market Positioning

2 Technavio Analysis

  • 2.1 Analysis of price sensitivity, lifecycle, customer purchase basket, adoption rates, and purchase criteria
    • Analysis of price sensitivity, lifecycle, customer purchase basket, adoption rates, and purchase criteria
  • 2.2 Criticality of inputs and Factors of differentiation
    • Overview on criticality of inputs and factors of differentiation
  • 2.3 Factors of disruption
    • Overview on factors of disruption
  • 2.4 Impact of drivers and challenges
    • Impact of drivers and challenges in 2023 and 2028

3 Market Landscape

  • 3.1 Market ecosystem
    • Parent Market
    • Data Table on - Parent Market
  • 3.2 Market characteristics
    • Market characteristics analysis
  • 3.3 Value chain analysis
    • Value Chain Analysis

4 Market Sizing

  • 4.1 Market definition
    • Offerings of companies included in the market definition
  • 4.2 Market segment analysis
    • Market segments
  • 4.3 Market size 2023
    • 4.4 Market outlook: Forecast for 2023-2028
      • Chart on Global - Market size and forecast 2023-2028 ($ million)
      • Data Table on Global - Market size and forecast 2023-2028 ($ million)
      • Chart on Global Market: Year-over-year growth 2023-2028 (%)
      • Data Table on Global Market: Year-over-year growth 2023-2028 (%)

    5 Historic Market Size

    • 5.1 Global Dry Mix Mortar Additives And Chemicals Market 2018 - 2022
      • Historic Market Size - Data Table on Global Dry Mix Mortar Additives And Chemicals Market 2018 - 2022 ($ million)
    • 5.2 Type segment analysis 2018 - 2022
      • Historic Market Size - Type Segment 2018 - 2022 ($ million)
    • 5.3 Geography segment analysis 2018 - 2022
      • Historic Market Size - Geography Segment 2018 - 2022 ($ million)
    • 5.4 Country segment analysis 2018 - 2022
      • Historic Market Size - Country Segment 2018 - 2022 ($ million)

    6 Qualitative Analysis

    • 6.1 Impact of AI on Global Dry Mix Mortar Additives and Chemicals Market

      7 Five Forces Analysis

      • 7.1 Five forces summary
        • Five forces analysis - Comparison between 2023 and 2028
      • 7.2 Bargaining power of buyers
        • Bargaining power of buyers - Impact of key factors 2023 and 2028
      • 7.3 Bargaining power of suppliers
        • Bargaining power of suppliers - Impact of key factors in 2023 and 2028
      • 7.4 Threat of new entrants
        • Threat of new entrants - Impact of key factors in 2023 and 2028
      • 7.5 Threat of substitutes
        • Threat of substitutes - Impact of key factors in 2023 and 2028
      • 7.6 Threat of rivalry
        • Threat of rivalry - Impact of key factors in 2023 and 2028
      • 7.7 Market condition
        • Chart on Market condition - Five forces 2023 and 2028

      8 Market Segmentation by Type

      • 8.1 Market segments
        • Chart on Type - Market share 2023-2028 (%)
        • Data Table on Type - Market share 2023-2028 (%)
      • 8.2 Comparison by Type
        • Chart on Comparison by Type
        • Data Table on Comparison by Type
      • 8.3 Additives - Market size and forecast 2023-2028
        • Chart on Additives - Market size and forecast 2023-2028 ($ million)
        • Data Table on Additives - Market size and forecast 2023-2028 ($ million)
        • Chart on Additives - Year-over-year growth 2023-2028 (%)
        • Data Table on Additives - Year-over-year growth 2023-2028 (%)
      • 8.4 Chemicals - Market size and forecast 2023-2028
        • Chart on Chemicals - Market size and forecast 2023-2028 ($ million)
        • Data Table on Chemicals - Market size and forecast 2023-2028 ($ million)
        • Chart on Chemicals - Year-over-year growth 2023-2028 (%)
        • Data Table on Chemicals - Year-over-year growth 2023-2028 (%)
      • 8.5 Market opportunity by Type
        • Market opportunity by Type ($ million)
        • Data Table on Market opportunity by Type ($ million)

      9 Customer Landscape

      • 9.1 Customer landscape overview
        • Analysis of price sensitivity, lifecycle, customer purchase basket, adoption rates, and purchase criteria

      10 Geographic Landscape

      • 10.1 Geographic segmentation
        • Chart on Market share by geography 2023-2028 (%)
        • Data Table on Market share by geography 2023-2028 (%)
      • 10.2 Geographic comparison
        • Chart on Geographic comparison
        • Data Table on Geographic comparison
      • 10.3 APAC - Market size and forecast 2023-2028
        • Chart on APAC - Market size and forecast 2023-2028 ($ million)
        • Data Table on APAC - Market size and forecast 2023-2028 ($ million)
        • Chart on APAC - Year-over-year growth 2023-2028 (%)
        • Data Table on APAC - Year-over-year growth 2023-2028 (%)
      • 10.4 Europe - Market size and forecast 2023-2028
        • Chart on Europe - Market size and forecast 2023-2028 ($ million)
        • Data Table on Europe - Market size and forecast 2023-2028 ($ million)
        • Chart on Europe - Year-over-year growth 2023-2028 (%)
        • Data Table on Europe - Year-over-year growth 2023-2028 (%)
      • 10.5 North America - Market size and forecast 2023-2028
        • Chart on North America - Market size and forecast 2023-2028 ($ million)
        • Data Table on North America - Market size and forecast 2023-2028 ($ million)
        • Chart on North America - Year-over-year growth 2023-2028 (%)
        • Data Table on North America - Year-over-year growth 2023-2028 (%)
      • 10.6 Middle East and Africa - Market size and forecast 2023-2028
        • Chart on Middle East and Africa - Market size and forecast 2023-2028 ($ million)
        • Data Table on Middle East and Africa - Market size and forecast 2023-2028 ($ million)
        • Chart on Middle East and Africa - Year-over-year growth 2023-2028 (%)
        • Data Table on Middle East and Africa - Year-over-year growth 2023-2028 (%)
      • 10.7 South America - Market size and forecast 2023-2028
        • Chart on South America - Market size and forecast 2023-2028 ($ million)
        • Data Table on South America - Market size and forecast 2023-2028 ($ million)
        • Chart on South America - Year-over-year growth 2023-2028 (%)
        • Data Table on South America - Year-over-year growth 2023-2028 (%)
      • 10.8 China - Market size and forecast 2023-2028
        • Chart on China - Market size and forecast 2023-2028 ($ million)
        • Data Table on China - Market size and forecast 2023-2028 ($ million)
        • Chart on China - Year-over-year growth 2023-2028 (%)
        • Data Table on China - Year-over-year growth 2023-2028 (%)
      • 10.9 Japan - Market size and forecast 2023-2028
        • Chart on Japan - Market size and forecast 2023-2028 ($ million)
        • Data Table on Japan - Market size and forecast 2023-2028 ($ million)
        • Chart on Japan - Year-over-year growth 2023-2028 (%)
        • Data Table on Japan - Year-over-year growth 2023-2028 (%)
      • 10.10 India - Market size and forecast 2023-2028
        • Chart on India - Market size and forecast 2023-2028 ($ million)
        • Data Table on India - Market size and forecast 2023-2028 ($ million)
        • Chart on India - Year-over-year growth 2023-2028 (%)
        • Data Table on India - Year-over-year growth 2023-2028 (%)
      • 10.11 Indonesia - Market size and forecast 2023-2028
        • Chart on Indonesia - Market size and forecast 2023-2028 ($ million)
        • Data Table on Indonesia - Market size and forecast 2023-2028 ($ million)
        • Chart on Indonesia - Year-over-year growth 2023-2028 (%)
        • Data Table on Indonesia - Year-over-year growth 2023-2028 (%)
      • 10.12 US - Market size and forecast 2023-2028
        • Chart on US - Market size and forecast 2023-2028 ($ million)
        • Data Table on US - Market size and forecast 2023-2028 ($ million)
        • Chart on US - Year-over-year growth 2023-2028 (%)
        • Data Table on US - Year-over-year growth 2023-2028 (%)
      • 10.13 Turkey - Market size and forecast 2023-2028
        • Chart on Turkey - Market size and forecast 2023-2028 ($ million)
        • Data Table on Turkey - Market size and forecast 2023-2028 ($ million)
        • Chart on Turkey - Year-over-year growth 2023-2028 (%)
        • Data Table on Turkey - Year-over-year growth 2023-2028 (%)
      • 10.14 Germany - Market size and forecast 2023-2028
        • Chart on Germany - Market size and forecast 2023-2028 ($ million)
        • Data Table on Germany - Market size and forecast 2023-2028 ($ million)
        • Chart on Germany - Year-over-year growth 2023-2028 (%)
        • Data Table on Germany - Year-over-year growth 2023-2028 (%)
      • 10.15 UK - Market size and forecast 2023-2028
        • Chart on UK - Market size and forecast 2023-2028 ($ million)
        • Data Table on UK - Market size and forecast 2023-2028 ($ million)
        • Chart on UK - Year-over-year growth 2023-2028 (%)
        • Data Table on UK - Year-over-year growth 2023-2028 (%)
      • 10.16 Canada - Market size and forecast 2023-2028
        • Chart on Canada - Market size and forecast 2023-2028 ($ million)
        • Data Table on Canada - Market size and forecast 2023-2028 ($ million)
        • Chart on Canada - Year-over-year growth 2023-2028 (%)
        • Data Table on Canada - Year-over-year growth 2023-2028 (%)
      • 10.17 France - Market size and forecast 2023-2028
        • Chart on France - Market size and forecast 2023-2028 ($ million)
        • Data Table on France - Market size and forecast 2023-2028 ($ million)
        • Chart on France - Year-over-year growth 2023-2028 (%)
        • Data Table on France - Year-over-year growth 2023-2028 (%)
      • 10.18 Market opportunity by geography
        • Market opportunity by geography ($ million)
        • Data Tables on Market opportunity by geography ($ million)

      11 Drivers, Challenges, and Opportunity/Restraints

      • 11.1 Market drivers
        • 11.2 Market challenges
          • 11.3 Impact of drivers and challenges
            • Impact of drivers and challenges in 2023 and 2028
          • 11.4 Market opportunities/restraints

            12 Competitive Landscape

            • 12.1 Overview
              • 12.2 Competitive Landscape
                • Overview on criticality of inputs and factors of differentiation
              • 12.3 Landscape disruption
                • Overview on factors of disruption
              • 12.4 Industry risks
                • Impact of key risks on business

              13 Competitive Analysis

              • 13.1 Companies profiled
                • Companies covered
              • 13.2 Company ranking index
                • Company ranking index
              • 13.3 Market positioning of companies
                • Matrix on companies position and classification
              • 13.4 Ashland Inc.
                • Ashland Inc. - Overview
                • Ashland Inc. - Business segments
                • Ashland Inc. - Key news
                • Ashland Inc. - Key offerings
                • Ashland Inc. - Segment focus
                • SWOT
              • 13.5 BASF SE
                • BASF SE - Overview
                • BASF SE - Business segments
                • BASF SE - Key news
                • BASF SE - Key offerings
                • BASF SE - Segment focus
                • SWOT
              • 13.6 CEMEX SAB de CV
                • CEMEX SAB de CV - Overview
                • CEMEX SAB de CV - Business segments
                • CEMEX SAB de CV - Key news
                • CEMEX SAB de CV - Key offerings
                • CEMEX SAB de CV - Segment focus
                • SWOT
              • 13.7 Don Construction Products Inc.
                • Don Construction Products Inc. - Overview
                • Don Construction Products Inc. - Product / Service
                • Don Construction Products Inc. - Key offerings
                • SWOT
              • 13.8 Dow Inc.
                • Dow Inc. - Overview
                • Dow Inc. - Business segments
                • Dow Inc. - Key news
                • Dow Inc. - Key offerings
                • Dow Inc. - Segment focus
                • SWOT
              • 13.9 Evonik Industries AG
                • Evonik Industries AG - Overview
                • Evonik Industries AG - Business segments
                • Evonik Industries AG - Key news
                • Evonik Industries AG - Key offerings
                • Evonik Industries AG - Segment focus
                • SWOT
              • 13.10 Mapei SpA
                • Mapei SpA - Overview
                • Mapei SpA - Product / Service
                • Mapei SpA - Key offerings
                • SWOT
              • 13.11 Sika AG
                • Sika AG - Overview
                • Sika AG - Business segments
                • Sika AG - Key news
                • Sika AG - Key offerings
                • Sika AG - Segment focus
                • SWOT
              • 13.12 The Euclid Chemical Co.
                • The Euclid Chemical Co. - Overview
                • The Euclid Chemical Co. - Product / Service
                • The Euclid Chemical Co. - Key offerings
                • SWOT
              • 13.13 Wacker Chemie AG
                • Wacker Chemie AG - Overview
                • Wacker Chemie AG - Business segments
                • Wacker Chemie AG - Key news
                • Wacker Chemie AG - Key offerings
                • Wacker Chemie AG - Segment focus
                • SWOT

              14 Appendix

              • 14.1 Scope of the report
                • 14.2 Inclusions and exclusions checklist
                  • Inclusions checklist
                  • Exclusions checklist
                • 14.3 Currency conversion rates for US$
                  • Currency conversion rates for US$
                • 14.4 Research methodology
                  • Research methodology
                • 14.5 Data procurement
                  • Information sources
                • 14.6 Data validation
                  • Data validation
                • 14.7 Validation techniques employed for market sizing
                  • Validation techniques employed for market sizing
                • 14.8 Data synthesis
                  • Data synthesis
                • 14.9 360 degree market analysis
                  • 360 degree market analysis
                • 14.10 List of abbreviations
                  • List of abbreviations

                Research Methodology

                Technavio presents a detailed picture of the market by way of study, synthesis, and summation of data from multiple sources. The analysts have presented the various facets of the market with a particular focus on identifying the key industry influencers. The data thus presented is comprehensive, reliable, and the result of extensive research, both primary and secondary.

                INFORMATION SOURCES

                Primary sources

                • Manufacturers and suppliers
                • Channel partners
                • Industry experts
                • Strategic decision makers

                Secondary sources

                • Industry journals and periodicals
                • Government data
                • Financial reports of key industry players
                • Historical data
                • Press releases

                DATA ANALYSIS

                Data Synthesis

                • Collation of data
                • Estimation of key figures
                • Analysis of derived insights

                Data Validation

                • Triangulation with data models
                • Reference against proprietary databases
                • Corroboration with industry experts

                REPORT WRITING

                Qualitative

                • Market drivers
                • Market challenges
                • Market trends
                • Five forces analysis

                Quantitative

                • Market size and forecast
                • Market segmentation
                • Geographical insights
                • Competitive landscape

                Interested in this report?

                Get your sample now to see our research methodology and insights!

                Download Now

                Frequently Asked Questions

                Dry Mix Mortar Additives And Chemicals market growth will increase by $ 13785.7 mn during 2024-2028 .

                The Dry Mix Mortar Additives And Chemicals market is expected to grow at a CAGR of 4.9% during 2024-2028 .

                Dry Mix Mortar Additives And Chemicals market is segmented by Type( Additives, Chemicals)

                Altana AG, Ashland Inc., BASF SE, Celanese Corp., CEMEX SAB de CV, CHT Germany GmbH, Clariant International Ltd, Compagnie de Saint-Gobain SA, Don Construction Products Inc., Dow Inc., Evonik Industries AG, Holcim Ltd., Innospec Inc., Mapei SpA, Nouryon Chemicals Holding B.V., Qingdao Oubo Chemical Co. Ltd., Sidley Chemical Co. Ltd., Sika AG, The Euclid Chemical Co., Wacker Chemie AG are a few of the key vendors in the Dry Mix Mortar Additives And Chemicals market.

                APAC will register the highest growth rate of 73% among the other regions. Therefore, the Dry Mix Mortar Additives And Chemicals market in APAC is expected to garner significant business opportunities for the vendors during the forecast period.

                China, Japan, India, Indonesia, US, Turkey, Germany, UK, France, Canada

                • Rapid increase in road and bridge constructionDry mix mortar additives and chemicals are highly used in the construction of roads and bridges. There is increased government funding and government support for infrastructure construction activities globally. For instance is the driving factor this market.
                • The Ministry of Road Transport and Highways of India released an estimated budget of around $15 billion to build national highways is the driving factor this market.
                • roads is the driving factor this market.
                • and bridges and maintain the existing infrastructure during 2021-2022. The budget is approximately 14% higher than the revised estimates for 2020-21. Such large investments are expected to propel the demand for a large volume of construction materials is the driving factor this market.
                • including dry mix mortar additives and chemicals. The Indian government aims to construct 200 is the driving factor this market.
                • 000 km of national highways by 2025.In recent years is the driving factor this market.
                • the rapid increase in road and bridge construction activities boosted the demand for dry mix mortar additives and chemicals. In 2020 is the driving factor this market.
                • the Roads and Transport Authority of Dubai is the driving factor this market.
                • UAE is the driving factor this market.
                • announced all construction works on roads and bridges leading to the Dubai Hills Mall project. The project comprises 13 bridges extending 3700 meters in length and 11-22 meters in width is the driving factor this market.
                • with a combined capacity of 23 is the driving factor this market.
                • 500 vehicles per hour.Similarly is the driving factor this market.
                • in the US is the driving factor this market.
                • some of the current key road construction projects include Florida I-4 Project is the driving factor this market.
                • California I-405 Widening Project is the driving factor this market.
                • the California I-5 North Coast Corridor Project is the driving factor this market.
                • the Virginias Hampton Roads Bridge-Tunnel Expansion Project is the driving factor this market.
                • and Texas I-635 LBJ East Project. Thus is the driving factor this market.
                • with an increase in road and bridge construction is the driving factor this market.
                • the demand for dry mix mortar additives and chemicals is expected to increase gradually during the forecast period. is the driving factor this market.

                The Dry Mix Mortar Additives And Chemicals market vendors should focus on grabbing business opportunities from the Additives segment as it accounted for the largest market share in the base year.