E-Brokerage Market Analysis, Size, and Forecast 2025-2029: North America (US, Canada, and Mexico), Europe (France, Germany, The Netherlands, and UK), Middle East and Africa (UAE), APAC (Australia, China, India, Japan, and South Korea), South America (Brazil), and Rest of World (ROW)

E-Brokerage Market Analysis, Size, and Forecast 2025-2029:
North America (US, Canada, and Mexico), Europe (France, Germany, The Netherlands, and UK), Middle East and Africa (UAE), APAC (Australia, China, India, Japan, and South Korea), South America (Brazil), and Rest of World (ROW)

Published: Apr 2025 213 Pages SKU: IRTNTR77805

Market Overview at a Glance

$7.39 B
Market Opportunity
7.9%
CAGR
7.2
YoY growth 2024-2025(%)

E-Brokerage Market Size 2025-2029

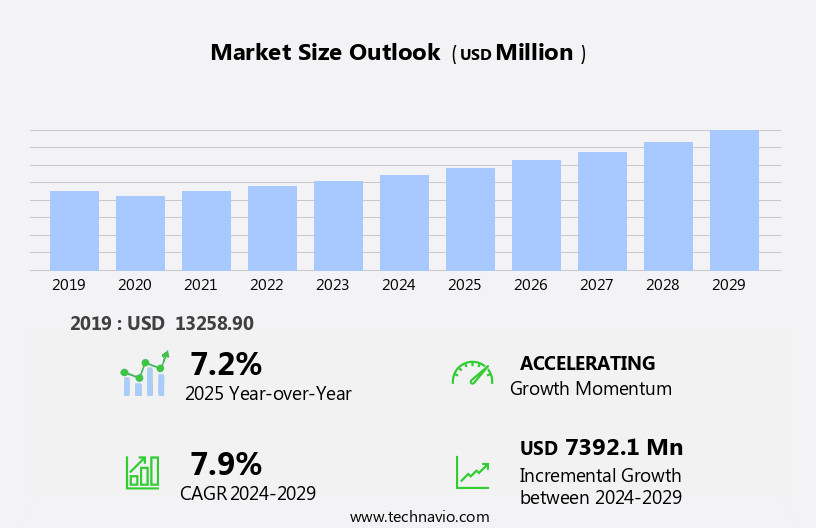
The e-brokerage market size is forecast to increase by USD 7.39 billion, at a CAGR of 7.9% between 2024 and 2029.

  • The market is experiencing significant growth, driven by the increasing proliferation of internet access worldwide. This expansion is fueled by the convenience and accessibility that e-brokerage platforms offer, enabling investors to manage their portfolios remotely and execute trades in real-time. Another key trend shaping the market is the rising demand for customization and personalization in e-brokerage solutions. As investors seek more tailored services to meet their unique needs, e-brokerage providers are responding by offering personalized investment advice, customizable interfaces, and a wide range of financial instruments. However, the market also faces notable challenges. With the increasing popularity of e-brokerage platforms, cybersecurity risks have become a significant concern.
  • As more investors turn to digital channels for their financial needs, the threat of data breaches, hacking, and other cyber attacks grows. E-brokerage providers must invest heavily in robust cybersecurity measures to protect their platforms and their clients' sensitive information. Additionally, regulatory compliance remains a complex and ever-evolving challenge for e-brokerage firms, requiring significant resources and expertise to navigate the intricacies of various financial regulations. These challenges, while daunting, present opportunities for e-brokerage providers that can effectively address these issues and provide a secure, reliable, and personalized platform for their clients.

What will be the Size of the E-Brokerage Market during the forecast period?

E-Brokerage Market Size

Explore in-depth regional segment analysis with market size data - historical 2019-2023 and forecasts 2025-2029 - in the full report.  
Request Free Sample

The market continues to evolve, with dynamic market dynamics shaping its various sectors. Investment products and services are increasingly integrated, offering users a comprehensive platform for financial management. Mobile app development is a key focus, enabling seamless trading and real-time data access. Cryptocurrency trading is gaining popularity, requiring advanced technology and robust security protocols. Market data and educational resources are essential components, empowering users with the tools for fundamental analysis and financial modeling. User experience is paramount, with customer support, account management, and portfolio optimization ensuring client satisfaction. Order routing and management systems facilitate efficient trade execution, while fractional shares and commission structures cater to diverse investment strategies.

Data analytics and technical analysis provide valuable insights, driving informed decisions. High-frequency trading and algorithmic trading require advanced API integration and direct market access. Risk management and tax optimization are crucial, with real-time data and automated trading offering enhanced control. Client onboarding and account minimums are essential considerations, with various brokerage services catering to different customer segments. Wealth management and retirement planning require a holistic approach, incorporating estate planning and dividend reinvestment. Security breaches and data encryption are ongoing concerns, with robust security protocols essential for safeguarding sensitive information. Investment products and trading platforms continue to expand, offering users a wide range of options, including futures trading and forex trading.

Charting tools and social trading provide additional resources for informed decision-making. The market's continuous dynamism ensures a constantly evolving landscape, requiring adaptability and innovation.

How is this E-Brokerage Industry segmented?

The e-brokerage industry research report provides comprehensive data (region-wise segment analysis), with forecasts and estimates in "USD million" for the period 2025-2029, as well as historical data from 2019-2023 for the following segments.

  • Service Type
    • Full time broker
    • Discounted broker
  • Application
    • Individual investor
    • Institutional investor
  • Ownership
    • Privately held
    • Publicly held
  • Platform
    • Web-based
    • Mobile apps
    • Desktop
  • Assest Type
    • Equities
    • Bonds
    • Derivatives
    • Cryptocurrencies
  • Geography
    • North America
      • US
      • Canada
      • Mexico
    • Europe
      • France
      • Germany
      • The Netherlands
      • UK
    • Middle East and Africa
      • UAE
    • APAC
      • Australia
      • China
      • India
      • Japan
      • South Korea
    • South America
      • Brazil
    • Rest of World (ROW)

    By Service Type Insights

    The full time broker segment is estimated to witness significant growth during the forecast period.

    In the dynamic world of E-brokerage, full-time brokers play a pivotal role in facilitating the trade of various financial securities for clients. These licensed professionals, regulated by bodies like the SEC and FCA, work closely with individuals, institutions, and corporations to understand their investment objectives, risk tolerance, and financial goals. They provide personalized service, fostering long-term relationships built on trust and transparency. E-brokerage services encompass real-time data access, efficient trade execution, algorithmic trading, financial planning, and various brokerage tools. These include fundamental and technical analysis, fractional shares, account management, risk management, desktop trading, charting tools, estate planning, retirement planning, and more.

    Wealth management services, such as tax optimization, client onboarding, and portfolio management, are also essential. Brokers employ advanced technologies like API integration, customer support, and research reports to enhance the user experience. Mobile trading, cryptocurrency trading, and mobile app development are increasingly popular. Direct market access, order routing, and customer segmentation enable tailored investment strategies. Historical data, educational resources, and market data are vital for informed decision-making. Investment products span from traditional stocks, bonds, and mutual funds to complex derivatives like futures, options, and automated trading. Security protocols ensure data encryption and protect against potential security breaches. Brokers offer various commission structures and margin requirements, catering to different investment strategies.

    E-brokerage continues to evolve, with a focus on user interface, quantitative analysis, financial modeling, and trading platforms. The integration of advanced technologies and personalized services enables brokers to cater to diverse client needs effectively.

    E-Brokerage Market Size

    Request Free Sample

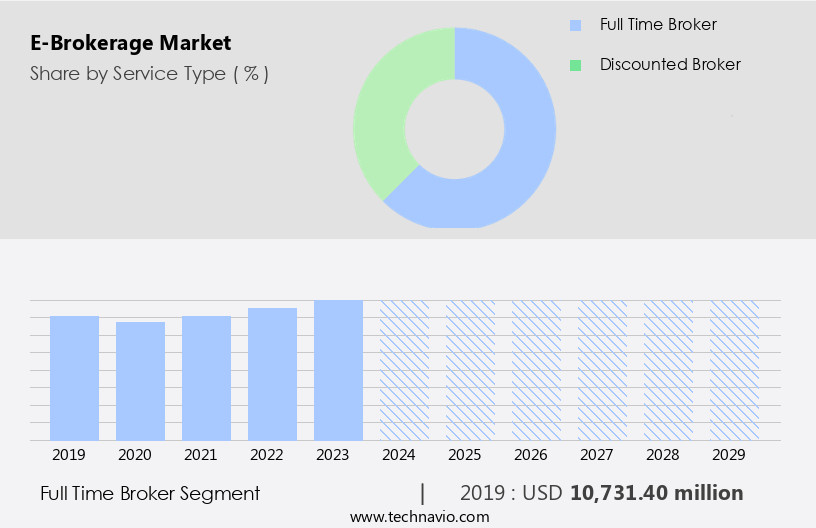
    The Full time broker segment was valued at USD 10.73 billion in 2019 and showed a gradual increase during the forecast period.
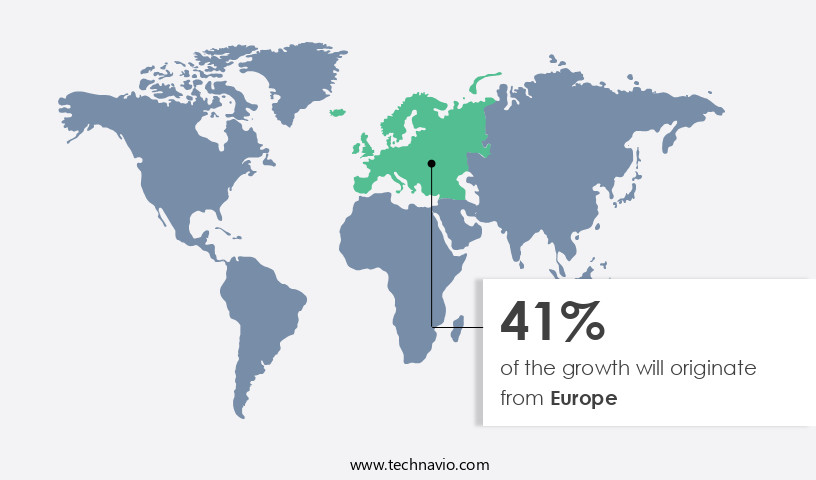
    Regional Analysis

    Europe is estimated to contribute 41% to the growth of the global market during the forecast period.Technavio’s analysts have elaborately explained the regional trends and drivers that shape the market during the forecast period.

    E-Brokerage Market Share by Geography

     Request Free Sample

    In North America, particularly in the US and Canada, the financial markets, including the New York Stock Exchange (NYSE) and the National Association of Securities Dealers Automated Quotations (NASDAQ), represent some of the world's largest and most liquid trading venues. The size and depth of these markets draw a significant number of investors, both domestic and international, to engage in trading activities via e-brokerage platforms. The region's technological hubs, such as Silicon Valley, foster the development of leading e-brokerage firms that utilize advanced technologies, including mobile apps, algorithmic trading, and real-time data, to deliver innovative and user-friendly trading experiences. E-brokerage platforms in North America provide various services, such as fundamental analysis, financial modeling, high-frequency trading, news feeds, investment education, customer support, dividend reinvestment, estate planning, account management, copy trading, risk management, API integration, client onboarding, portfolio optimization, options trading, trading platforms, retirement planning, tax optimization, real-time data, automated trading, account minimums, margin requirements, data encryption, trade execution, desktop trading, transaction fees, customer segmentation, web trading, wealth management, research reports, futures trading, quantitative analysis, asset allocation, investment strategies, brokerage services, historical data, security protocols, algorithmic trading, direct market access, forex trading, charting tools, security breaches, portfolio management, social trading, investment products, mobile app development, cryptocurrency trading, market data, and educational resources.

    These services cater to diverse investor needs and preferences, enabling them to make informed decisions and optimize their investment portfolios effectively. E-brokerage platforms prioritize user experience, offering intuitive interfaces, seamless navigation, and customizable features to cater to individual investor requirements. They also provide essential tools, such as technical analysis, risk management, and order routing, to help investors make informed trading decisions and manage their portfolios efficiently. Additionally, they offer various order management systems, fractional shares, and commission structures to accommodate different investment strategies and budgets. The market in North America continues to evolve, with a focus on enhancing the user experience, expanding service offerings, and incorporating emerging technologies, such as artificial intelligence and machine learning, to provide more personalized and data-driven investment advice.

    Overall, the North American the market represents a dynamic and competitive landscape, driven by technological innovation, investor demand, and regulatory compliance.

    Market Dynamics

    Our researchers analyzed the data with 2024 as the base year, along with the key drivers, trends, and challenges. A holistic analysis of drivers will help companies refine their marketing strategies to gain a competitive advantage.

    In the dynamic and technological world of finance, the market continues to thrive, offering investors a convenient and accessible platform for buying and selling securities. This marketplace, driven by advanced technology, enables real-time trading, robust research tools, and user-friendly interfaces. Online brokers provide various account types, including individual and joint accounts, catering to diverse investment needs. They offer a wide range of securities, from stocks and bonds to mutual funds and exchange-traded funds. Additionally, e-brokerages facilitate automated investment services, such as robo-advisors, and margin trading, allowing for leverage and increased potential returns. Furthermore, they prioritize security with multi-factor authentication, encryption, and regulatory compliance. The market empowers investors to make informed decisions through educational resources and customizable alerts. It's a powerful tool for those seeking financial growth and independence in the digital age.

    What are the key market drivers leading to the rise in the adoption of E-Brokerage Industry?

    • The expansion of internet access significantly drives the market growth by fueling the proliferation of e-brokerage services. 

    • The market growth is driven by increased internet access, enabling investors from diverse locations to engage with digital trading platforms. This expansion reaches previously inaccessible markets, providing e-brokerage firms with a broader customer base. The internet's availability around the clock allows investors to trade securities and manage portfolios at any time, offering unparalleled convenience and flexibility. E-brokerage firms benefit from internet-based operations by streamlining processes, automating tasks, and reducing costs related to physical locations and manual transactions. These savings are passed on to clients through lower fees and commissions, making e-brokerage services more affordable and appealing.
    • Advanced features, such as quantitative analysis, algorithmic trading, direct market access, futures trading, forex trading, charting tools, and social trading, cater to various investment strategies and asset allocation needs. Security protocols ensure the protection of investors' financial data, mitigating risks associated with potential security breaches. In summary, the market thrives on the convenience, flexibility, and cost savings offered by internet-based trading platforms, making it an attractive option for investors worldwide.

    What are the market trends shaping the E-Brokerage Industry?

    • Customization and personalization are increasingly in demand in the e-brokerage industry, representing an emerging market trend. E-brokerage solutions that cater to individual preferences and needs are gaining popularity among investors.

    • E-brokerage platforms offer investors a personalized investment experience with access to various investment products, including stocks, bonds, mutual funds, exchange-traded funds (ETFs), and even cryptocurrency trading. Advanced mobile app development enables users to access real-time market data, educational resources, and user-friendly mobile trading interfaces from anywhere. E-brokerage platforms employ order routing and order management systems to execute trades efficiently and manage portfolios effectively. Algorithmic trading tools enable investors to create and execute customized strategies based on market data and predefined parameters. These tools automate trading decisions, optimize portfolio performance, and adapt to changing market dynamics in real-time. Many e-brokerage platforms integrate robo-advisors, which use data analytics and machine learning to offer personalized investment advice and portfolio management based on investors' financial profiles and objectives.
    • Fractional shares allow investors to purchase portions of stocks and ETFs that may otherwise be out of reach. Data analytics and commission structures help investors make informed decisions and manage their investments efficiently. Overall, e-brokerage platforms provide a harmonious blend of technology, user experience, and financial planning tools to cater to diverse investor needs.

    What challenges does the E-Brokerage Industry face during its growth?

    • The escalating cybersecurity risks in e-brokerage platforms pose a significant challenge to the industry's growth, necessitating robust security measures to safeguard sensitive financial data and maintain client trust. 

    • E-brokerage platforms offer users a convenient and accessible way to engage in financial markets through user-friendly interfaces. However, the digital nature of these services also makes them vulnerable to cybersecurity threats, such as data breaches and hacking incidents. Such breaches pose significant risks to both e-brokerage firms and their customers. The compromise of sensitive customer information, including personal and financial data, can result in a loss of trust and confidence, leading to a decrease in customers and potential revenue. Reputational damage from negative publicity surrounding security breaches can deter new customers and drive existing ones to competitors.
    • The costs associated with investigating and remedying security incidents, regulatory fines, legal fees, and potential settlements can be substantial for e-brokerage firms. In addition to cybersecurity, e-brokerage platforms provide various features to facilitate investment, including fundamental analysis, financial modeling, high-frequency trading, news feeds, investment education, customer support, dividend reinvestment, estate planning, account management, copy trading, risk management, API integration, client onboarding, and portfolio optimization. These tools empower users to make informed investment decisions and effectively manage their portfolios.

    Exclusive Customer Landscape

    The e-brokerage market forecasting report includes the adoption lifecycle of the market, covering from the innovator’s stage to the laggard’s stage. It focuses on adoption rates in different regions based on penetration. Furthermore, the e-brokerage market report also includes key purchase criteria and drivers of price sensitivity to help companies evaluate and develop their market growth analysis strategies.
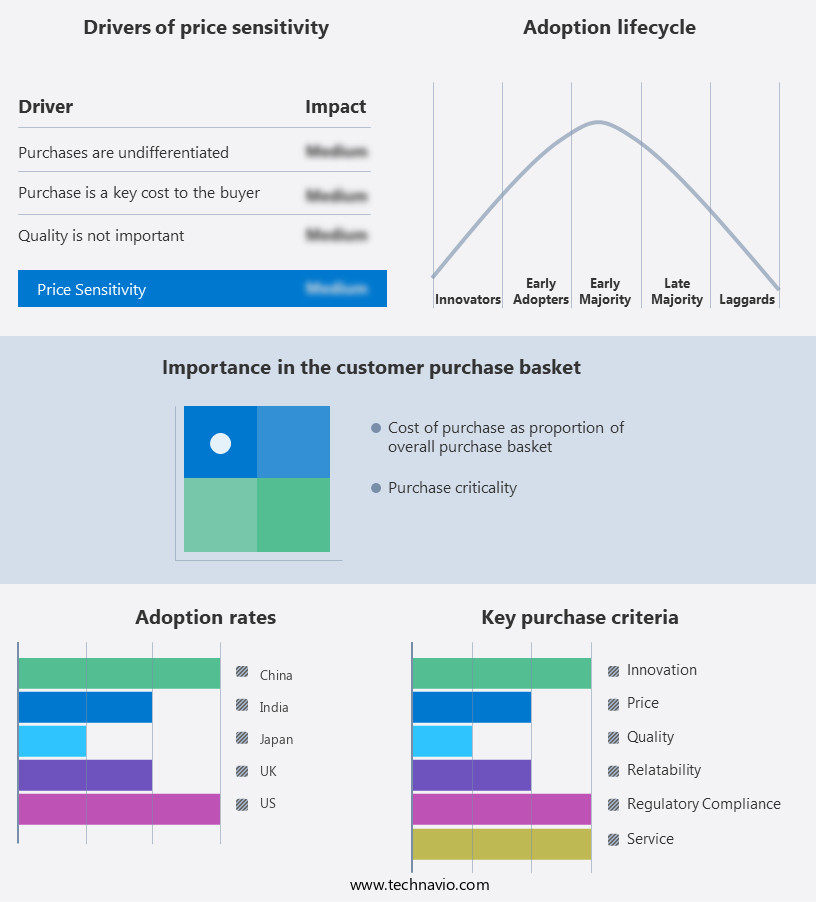
    E-Brokerage Market Share by Geography

     Customer Landscape

    Key Companies & Market Insights

    Companies are implementing various strategies, such as strategic alliances, e-brokerage market forecast, partnerships, mergers and acquisitions, geographical expansion, and product/service launches, to enhance their presence in the industry.

    5Paisa Capital Ltd. - The company provides e-trading services via Sharekhan TradeTiger platform, enabling access to equity, derivatives, commodity, and currency markets. This innovative solution empowers users to make informed investment decisions with real-time market data and advanced analytical tools.

    The industry research and growth report includes detailed analyses of the competitive landscape of the market and information about key companies, including:

    • 5Paisa Capital Ltd.
    • Angel One Ltd.
    • BNP Paribas SA
    • eToro
    • FMR LLC
    • FP Markets LLC
    • HDFC Bank Ltd.
    • Huatai Securities Co. Ltd.
    • IG Group Holdings Plc
    • Interactive Brokers LLC
    • Kotak Mahindra Bank Ltd.
    • Morgan Stanley
    • Motilal Oswal Financial Services Ltd.
    • Regal Securities Inc.
    • Saxo Bank AS
    • The Charles Schwab Corp.
    • Trading 212 Ltd.
    • VNS
    • XTB S.A.
    • Zerodha Broking Ltd.

    Qualitative and quantitative analysis of companies has been conducted to help clients understand the wider business environment as well as the strengths and weaknesses of key industry players. Data is qualitatively analyzed to categorize companies as pure play, category-focused, industry-focused, and diversified; it is quantitatively analyzed to categorize companies as dominant, leading, strong, tentative, and weak.

    Recent Development and News in E-Brokerage Market

    • In January 2024, leading E-brokerage platform, TradeHub, announced the launch of its advanced AI-driven trading assistant, "SmartTrade," designed to provide personalized investment recommendations to users based on their financial goals and risk tolerance. (TradeHub Press Release)
    • In March 2024, E-Trade and Charles Schwab, two major players in the E-brokerage industry, announced a strategic partnership to co-brand and offer joint promotions, aiming to attract a larger customer base and strengthen their market position. (Charles Schwab Press Release)
    • In May 2024, Robinhood, the disruptive E-brokerage startup, raised a USD323 million funding round led by Sequoia Capital and DST Global, bringing its valuation to USD22.1 billion. The funds will be used for product development and international expansion. (Robinhood Securities Filing)
    • In January 2025, the Securities and Exchange Commission (SEC) approved the use of digital assets as collateral for margin trading on E-brokerage platforms, paving the way for broader adoption of cryptocurrencies in the E-trading space. (SEC Press Release)

    Research Analyst Overview

    • In the dynamic the market, investors employ various strategies and investment vehicles to meet their unique investment goals. Exchange-traded funds (ETFs) and index funds have gained popularity among passive investors, allowing for diversified portfolios and lower costs. Order types, including market orders, limit orders, stop-limit orders, trailing stops, take-profit orders, and stop-loss orders, enable investors to manage risk and optimize returns. Trading psychology plays a crucial role in successful investing, with income investing, position sizing, and risk tolerance being essential factors. Mutual funds and private equity offer active management opportunities for those seeking to outperform the market.
    • Alternative investments, such as hedge funds and trusts and estates, provide diversification and potential tax benefits. Factor investing, value investing, and growth investing cater to different investment styles, while retirement accounts, education savings plans, and tax-advantaged accounts offer tax advantages for long-term investors. Financial literacy and financial education are essential components of effective investment strategies, with financial education resources readily available to US business readers. Short-term investors employ strategies like day trading and swing trading, while long-term investors focus on buy-and-hold strategies. Understanding order types, investment goals, and risk tolerance is essential for making informed decisions in the market.

    Dive into Technavio’s robust research methodology, blending expert interviews, extensive data synthesis, and validated models for unparalleled E-Brokerage Market insights. See full methodology.

    Market Scope

    Report Coverage

    Details

    Page number

    213

    Base year

    2024

    Historic period

    2019-2023

    Forecast period

    2025-2029

    Growth momentum & CAGR

    Accelerate at a CAGR of 7.9%

    Market growth 2025-2029

    USD 7392.1 million

    Market structure

    Fragmented

    YoY growth 2024-2025(%)

    7.2

    Key countries

    US, China, Germany, Japan, UK, Australia, India, France, Brazil, Canada, UAE, Rest of World (ROW), Saudi Arabia, France, South Korea, Mexico, and The Netherlands

    Competitive landscape

    Leading Companies, Market Positioning of Companies, Competitive Strategies, and Industry Risks

    Request Free Sample

    What are the Key Data Covered in this E-Brokerage Market Research and Growth Report?

    • CAGR of the E-Brokerage industry during the forecast period
    • Detailed information on factors that will drive the growth and forecasting between 2025 and 2029
    • Precise estimation of the size of the market and its contribution of the industry in focus to the parent market
    • Accurate predictions about upcoming growth and trends and changes in consumer behaviour
    • Growth of the market across North America, Europe, APAC, South America, and Middle East and Africa
    • Thorough analysis of the market’s competitive landscape and detailed information about companies
    • Comprehensive analysis of factors that will challenge the e-brokerage market growth of industry companies

    We can help! Our analysts can customize this e-brokerage market research report to meet your requirements.

    Get in touch


    1 Executive Summary

    • 1.1 Market overview
      • Executive Summary - Chart on Market Overview
      • Executive Summary - Data Table on Market Overview
      • Executive Summary - Chart on Global Market Characteristics
      • Executive Summary - Chart on Market by Geography
      • Executive Summary - Chart on Market Segmentation by Service Type
      • Executive Summary - Chart on Market Segmentation by Application
      • Executive Summary - Chart on Market Segmentation by Ownership
      • Executive Summary - Chart on Market Segmentation by Platform
      • Executive Summary - Chart on Incremental Growth
      • Executive Summary - Data Table on Incremental Growth
      • Executive Summary - Chart on Company Market Positioning

    2 Technavio Analysis

    • 2.1 Analysis of price sensitivity, lifecycle, customer purchase basket, adoption rates, and purchase criteria
      • Analysis of price sensitivity, lifecycle, customer purchase basket, adoption rates, and purchase criteria
    • 2.2 Criticality of inputs and Factors of differentiation
      • Overview on criticality of inputs and factors of differentiation
    • 2.3 Factors of disruption
      • Overview on factors of disruption
    • 2.4 Impact of drivers and challenges
      • Impact of drivers and challenges in 2024 and 2029

    3 Market Landscape

    • 3.1 Market ecosystem
      • Parent Market
      • Data Table on - Parent Market
    • 3.2 Market characteristics
      • Market characteristics analysis
    • 3.3 Value chain analysis
      • Value chain analysis

    4 Market Sizing

    • 4.1 Market definition
      • Offerings of companies included in the market definition
    • 4.2 Market segment analysis
      • Market segments
    • 4.3 Market size 2024
      • 4.4 Market outlook: Forecast for 2024-2029
        • Chart on Global - Market size and forecast 2024-2029 ($ million)
        • Data Table on Global - Market size and forecast 2024-2029 ($ million)
        • Chart on Global Market: Year-over-year growth 2024-2029 (%)
        • Data Table on Global Market: Year-over-year growth 2024-2029 (%)

      5 Historic Market Size

      • 5.1 Global E-Brokerage Market 2019 - 2023
        • Historic Market Size - Data Table on Global E-Brokerage Market 2019 - 2023 ($ million)
      • 5.2 Service Type segment analysis 2019 - 2023
        • Historic Market Size - Service Type Segment 2019 - 2023 ($ million)
      • 5.3 Application segment analysis 2019 - 2023
        • Historic Market Size - Application Segment 2019 - 2023 ($ million)
      • 5.4 Ownership segment analysis 2019 - 2023
        • Historic Market Size - Ownership Segment 2019 - 2023 ($ million)
      • 5.5 Platform segment analysis 2019 - 2023
        • Historic Market Size - Platform Segment 2019 - 2023 ($ million)
      • 5.6 Geography segment analysis 2019 - 2023
        • Historic Market Size - Geography Segment 2019 - 2023 ($ million)
      • 5.7 Country segment analysis 2019 - 2023
        • Historic Market Size - Country Segment 2019 - 2023 ($ million)

      6 Qualitative Analysis

      • 6.1 Impact of AI on global e-brokerage market

        7 Five Forces Analysis

        • 7.1 Five forces summary
          • Five forces analysis - Comparison between 2024 and 2029
        • 7.2 Bargaining power of buyers
          • Bargaining power of buyers - Impact of key factors 2024 and 2029
        • 7.3 Bargaining power of suppliers
          • Bargaining power of suppliers - Impact of key factors in 2024 and 2029
        • 7.4 Threat of new entrants
          • Threat of new entrants - Impact of key factors in 2024 and 2029
        • 7.5 Threat of substitutes
          • Threat of substitutes - Impact of key factors in 2024 and 2029
        • 7.6 Threat of rivalry
          • Threat of rivalry - Impact of key factors in 2024 and 2029
        • 7.7 Market condition
          • Chart on Market condition - Five forces 2024 and 2029

        8 Market Segmentation by Service Type

        • 8.1 Market segments
          • Chart on Service Type - Market share (2024-2029) (%)
          • Data Table on Service Type - Market share (2024-2029) (%)
        • 8.2 Comparison by Service Type
          • Chart on Comparison by Service Type
          • Data Table on Comparison by Service Type
        • 8.3 Full time broker - Market size and forecast (2024-2029)
          • Chart on Full time broker - Market size and forecast (2024-2029) ($ million)
          • Data Table on Full time broker - Market size and forecast (2024-2029) ($ million)
          • Chart on Full time broker - Year-over-year growth (2024-2029) (%)
          • Data Table on Full time broker - Year-over-year growth (2024-2029) (%)
        • 8.4 Discounted broker - Market size and forecast (2024-2029)
          • Chart on Discounted broker - Market size and forecast (2024-2029) ($ million)
          • Data Table on Discounted broker - Market size and forecast (2024-2029) ($ million)
          • Chart on Discounted broker - Year-over-year growth (2024-2029) (%)
          • Data Table on Discounted broker - Year-over-year growth (2024-2029) (%)
        • 8.5 Market opportunity by Service Type
          • Market opportunity by Service Type ($ million)
          • Data Table on Market opportunity by Service Type ($ million)

        9 Market Segmentation by Application

        • 9.1 Market segments
          • Chart on Application - Market share (2024-2029) (%)
          • Data Table on Application - Market share (2024-2029) (%)
        • 9.2 Comparison by Application
          • Chart on Comparison by Application
          • Data Table on Comparison by Application
        • 9.3 Individual investor - Market size and forecast (2024-2029)
          • Chart on Individual investor - Market size and forecast (2024-2029) ($ million)
          • Data Table on Individual investor - Market size and forecast (2024-2029) ($ million)
          • Chart on Individual investor - Year-over-year growth (2024-2029) (%)
          • Data Table on Individual investor - Year-over-year growth (2024-2029) (%)
        • 9.4 Institutional investor - Market size and forecast (2024-2029)
          • Chart on Institutional investor - Market size and forecast (2024-2029) ($ million)
          • Data Table on Institutional investor - Market size and forecast (2024-2029) ($ million)
          • Chart on Institutional investor - Year-over-year growth (2024-2029) (%)
          • Data Table on Institutional investor - Year-over-year growth (2024-2029) (%)
        • 9.5 Market opportunity by Application
          • Market opportunity by Application ($ million)
          • Data Table on Market opportunity by Application ($ million)

        10 Market Segmentation by Ownership

        • 10.1 Market segments
          • Chart on Ownership - Market share (2024-2029) (%)
          • Data Table on Ownership - Market share (2024-2029) (%)
        • 10.2 Comparison by Ownership
          • Chart on Comparison by Ownership
          • Data Table on Comparison by Ownership
        • 10.3 Privately held - Market size and forecast (2024-2029)
          • Chart on Privately held - Market size and forecast (2024-2029) ($ million)
          • Data Table on Privately held - Market size and forecast (2024-2029) ($ million)
          • Chart on Privately held - Year-over-year growth (2024-2029) (%)
          • Data Table on Privately held - Year-over-year growth (2024-2029) (%)
        • 10.4 Publicly held - Market size and forecast (2024-2029)
          • Chart on Publicly held - Market size and forecast (2024-2029) ($ million)
          • Data Table on Publicly held - Market size and forecast (2024-2029) ($ million)
          • Chart on Publicly held - Year-over-year growth (2024-2029) (%)
          • Data Table on Publicly held - Year-over-year growth (2024-2029) (%)
        • 10.5 Market opportunity by Ownership
          • Market opportunity by Ownership ($ million)
          • Data Table on Market opportunity by Ownership ($ million)

        11 Market Segmentation by Platform

        • 11.1 Market segments
          • Chart on Platform - Market share (2024-2029) (%)
          • Data Table on Platform - Market share (2024-2029) (%)
        • 11.2 Comparison by Platform
          • Chart on Comparison by Platform
          • Data Table on Comparison by Platform
        • 11.3 Web-based - Market size and forecast (2024-2029)
          • Chart on Web-based - Market size and forecast (2024-2029) ($ million)
          • Data Table on Web-based - Market size and forecast (2024-2029) ($ million)
          • Chart on Web-based - Year-over-year growth (2024-2029) (%)
          • Data Table on Web-based - Year-over-year growth (2024-2029) (%)
        • 11.4 Mobile apps - Market size and forecast (2024-2029)
          • Chart on Mobile apps - Market size and forecast (2024-2029) ($ million)
          • Data Table on Mobile apps - Market size and forecast (2024-2029) ($ million)
          • Chart on Mobile apps - Year-over-year growth (2024-2029) (%)
          • Data Table on Mobile apps - Year-over-year growth (2024-2029) (%)
        • 11.5 Desktop - Market size and forecast (2024-2029)
          • Chart on Desktop - Market size and forecast (2024-2029) ($ million)
          • Data Table on Desktop - Market size and forecast (2024-2029) ($ million)
          • Chart on Desktop - Year-over-year growth (2024-2029) (%)
          • Data Table on Desktop - Year-over-year growth (2024-2029) (%)
        • 11.6 Market opportunity by Platform
          • Market opportunity by Platform ($ million)
          • Data Table on Market opportunity by Platform ($ million)

        12 Market Segmentation by Assest Type

        • 12.1 Market segments
          • Chart on Assest Type - Market share (2024-2029) (%)
          • Data Table on Assest Type - Market share (2024-2029) (%)
        • 12.2 Comparison by Assest Type
          • Chart on Comparison by Assest Type
          • Data Table on Comparison by Assest Type
        • 12.3 Equities - Market size and forecast (2024-2029)
          • Chart on Equities - Market size and forecast (2024-2029) ($ million)
          • Data Table on Equities - Market size and forecast (2024-2029) ($ million)
          • Chart on Equities - Year-over-year growth (2024-2029) (%)
          • Data Table on Equities - Year-over-year growth (2024-2029) (%)
        • 12.4 Bonds - Market size and forecast (2024-2029)
          • Chart on Bonds - Market size and forecast (2024-2029) ($ million)
          • Data Table on Bonds - Market size and forecast (2024-2029) ($ million)
          • Chart on Bonds - Year-over-year growth (2024-2029) (%)
          • Data Table on Bonds - Year-over-year growth (2024-2029) (%)
        • 12.5 Derivatives - Market size and forecast (2024-2029)
          • Chart on Derivatives - Market size and forecast (2024-2029) ($ million)
          • Data Table on Derivatives - Market size and forecast (2024-2029) ($ million)
          • Chart on Derivatives - Year-over-year growth (2024-2029) (%)
          • Data Table on Derivatives - Year-over-year growth (2024-2029) (%)
        • 12.6 Cryptocurrencies - Market size and forecast (2024-2029)
          • Chart on Cryptocurrencies - Market size and forecast (2024-2029) ($ million)
          • Data Table on Cryptocurrencies - Market size and forecast (2024-2029) ($ million)
          • Chart on Cryptocurrencies - Year-over-year growth (2024-2029) (%)
          • Data Table on Cryptocurrencies - Year-over-year growth (2024-2029) (%)
        • 12.7 Market opportunity by Assest Type
          • Market opportunity by Assest Type ($ million)
          • Data Table on Market opportunity by Assest Type ($ million)

        13 Customer Landscape

        • 13.1 Customer landscape overview
          • Analysis of price sensitivity, lifecycle, customer purchase basket, adoption rates, and purchase criteria

        14 Geographic Landscape

        • 14.1 Geographic segmentation
          • Chart on Market share by geography 2024-2029 (%)
          • Data Table on Market share by geography 2024-2029 (%)
        • 14.2 Geographic comparison
          • Chart on Geographic comparison
          • Data Table on Geographic comparison
        • 14.3 North America - Market size and forecast 2024-2029
          • Chart on North America - Market size and forecast 2024-2029 ($ million)
          • Data Table on North America - Market size and forecast 2024-2029 ($ million)
          • Chart on North America - Year-over-year growth 2024-2029 (%)
          • Data Table on North America - Year-over-year growth 2024-2029 (%)
        • 14.4 Europe - Market size and forecast 2024-2029
          • Chart on Europe - Market size and forecast 2024-2029 ($ million)
          • Data Table on Europe - Market size and forecast 2024-2029 ($ million)
          • Chart on Europe - Year-over-year growth 2024-2029 (%)
          • Data Table on Europe - Year-over-year growth 2024-2029 (%)
        • 14.5 APAC - Market size and forecast 2024-2029
          • Chart on APAC - Market size and forecast 2024-2029 ($ million)
          • Data Table on APAC - Market size and forecast 2024-2029 ($ million)
          • Chart on APAC - Year-over-year growth 2024-2029 (%)
          • Data Table on APAC - Year-over-year growth 2024-2029 (%)
        • 14.6 South America - Market size and forecast 2024-2029
          • Chart on South America - Market size and forecast 2024-2029 ($ million)
          • Data Table on South America - Market size and forecast 2024-2029 ($ million)
          • Chart on South America - Year-over-year growth 2024-2029 (%)
          • Data Table on South America - Year-over-year growth 2024-2029 (%)
        • 14.7 Middle East and Africa - Market size and forecast 2024-2029
          • Chart on Middle East and Africa - Market size and forecast 2024-2029 ($ million)
          • Data Table on Middle East and Africa - Market size and forecast 2024-2029 ($ million)
          • Chart on Middle East and Africa - Year-over-year growth 2024-2029 (%)
          • Data Table on Middle East and Africa - Year-over-year growth 2024-2029 (%)
        • 14.8 US - Market size and forecast 2024-2029
          • Chart on US - Market size and forecast 2024-2029 ($ million)
          • Data Table on US - Market size and forecast 2024-2029 ($ million)
          • Chart on US - Year-over-year growth 2024-2029 (%)
          • Data Table on US - Year-over-year growth 2024-2029 (%)
        • 14.9 China - Market size and forecast 2024-2029
          • Chart on China - Market size and forecast 2024-2029 ($ million)
          • Data Table on China - Market size and forecast 2024-2029 ($ million)
          • Chart on China - Year-over-year growth 2024-2029 (%)
          • Data Table on China - Year-over-year growth 2024-2029 (%)
        • 14.10 Canada - Market size and forecast 2024-2029
          • Chart on Canada - Market size and forecast 2024-2029 ($ million)
          • Data Table on Canada - Market size and forecast 2024-2029 ($ million)
          • Chart on Canada - Year-over-year growth 2024-2029 (%)
          • Data Table on Canada - Year-over-year growth 2024-2029 (%)
        • 14.11 UK - Market size and forecast 2024-2029
          • Chart on UK - Market size and forecast 2024-2029 ($ million)
          • Data Table on UK - Market size and forecast 2024-2029 ($ million)
          • Chart on UK - Year-over-year growth 2024-2029 (%)
          • Data Table on UK - Year-over-year growth 2024-2029 (%)
        • 14.12 Germany - Market size and forecast 2024-2029
          • Chart on Germany - Market size and forecast 2024-2029 ($ million)
          • Data Table on Germany - Market size and forecast 2024-2029 ($ million)
          • Chart on Germany - Year-over-year growth 2024-2029 (%)
          • Data Table on Germany - Year-over-year growth 2024-2029 (%)
        • 14.13 France - Market size and forecast 2024-2029
          • Chart on France - Market size and forecast 2024-2029 ($ million)
          • Data Table on France - Market size and forecast 2024-2029 ($ million)
          • Chart on France - Year-over-year growth 2024-2029 (%)
          • Data Table on France - Year-over-year growth 2024-2029 (%)
        • 14.14 Japan - Market size and forecast 2024-2029
          • Chart on Japan - Market size and forecast 2024-2029 ($ million)
          • Data Table on Japan - Market size and forecast 2024-2029 ($ million)
          • Chart on Japan - Year-over-year growth 2024-2029 (%)
          • Data Table on Japan - Year-over-year growth 2024-2029 (%)
        • 14.15 Italy - Market size and forecast 2024-2029
          • Chart on Italy - Market size and forecast 2024-2029 ($ million)
          • Data Table on Italy - Market size and forecast 2024-2029 ($ million)
          • Chart on Italy - Year-over-year growth 2024-2029 (%)
          • Data Table on Italy - Year-over-year growth 2024-2029 (%)
        • 14.16 Spain - Market size and forecast 2024-2029
          • Chart on Spain - Market size and forecast 2024-2029 ($ million)
          • Data Table on Spain - Market size and forecast 2024-2029 ($ million)
          • Chart on Spain - Year-over-year growth 2024-2029 (%)
          • Data Table on Spain - Year-over-year growth 2024-2029 (%)
        • 14.17 India - Market size and forecast 2024-2029
          • Chart on India - Market size and forecast 2024-2029 ($ million)
          • Data Table on India - Market size and forecast 2024-2029 ($ million)
          • Chart on India - Year-over-year growth 2024-2029 (%)
          • Data Table on India - Year-over-year growth 2024-2029 (%)
        • 14.18 Market opportunity by geography
          • Market opportunity by geography ($ million)
          • Data Tables on Market opportunity by geography ($ million)
        • 14.19 Australia - Market size and forecast (2024-2029)
          • Chart on Australia - Market size and forecast (2024-2029) ($ million)
          • Data Table on Australia - Market size and forecast (2024-2029) ($ million)
          • Chart on Australia - Year-over-year growth (2024-2029) (%)
          • Data Table on Australia - Year-over-year growth (2024-2029) (%)
        • 14.20 Brazil - Market size and forecast (2024-2029)
          • Chart on Brazil - Market size and forecast (2024-2029) ($ million)
          • Data Table on Brazil - Market size and forecast (2024-2029) ($ million)
          • Chart on Brazil - Year-over-year growth (2024-2029) (%)
          • Data Table on Brazil - Year-over-year growth (2024-2029) (%)
        • 14.21 UAE - Market size and forecast (2024-2029)
          • Chart on UAE - Market size and forecast (2024-2029) ($ million)
          • Data Table on UAE - Market size and forecast (2024-2029) ($ million)
          • Chart on UAE - Year-over-year growth (2024-2029) (%)
          • Data Table on UAE - Year-over-year growth (2024-2029) (%)
        • 14.22 Rest of World (ROW) - Market size and forecast (2024-2029)
          • Chart on Rest of World (ROW) - Market size and forecast (2024-2029) ($ million)
          • Data Table on Rest of World (ROW) - Market size and forecast (2024-2029) ($ million)
          • Chart on Rest of World (ROW) - Year-over-year growth (2024-2029) (%)
          • Data Table on Rest of World (ROW) - Year-over-year growth (2024-2029) (%)
        • 14.23 Saudi Arabia - Market size and forecast (2024-2029)
          • Chart on Saudi Arabia - Market size and forecast (2024-2029) ($ million)
          • Data Table on Saudi Arabia - Market size and forecast (2024-2029) ($ million)
          • Chart on Saudi Arabia - Year-over-year growth (2024-2029) (%)
          • Data Table on Saudi Arabia - Year-over-year growth (2024-2029) (%)
        • 14.24 South Korea - Market size and forecast (2024-2029)
          • Chart on South Korea - Market size and forecast (2024-2029) ($ million)
          • Data Table on South Korea - Market size and forecast (2024-2029) ($ million)
          • Chart on South Korea - Year-over-year growth (2024-2029) (%)
          • Data Table on South Korea - Year-over-year growth (2024-2029) (%)
        • 14.25 Mexico - Market size and forecast (2024-2029)
          • Chart on Mexico - Market size and forecast (2024-2029) ($ million)
          • Data Table on Mexico - Market size and forecast (2024-2029) ($ million)
          • Chart on Mexico - Year-over-year growth (2024-2029) (%)
          • Data Table on Mexico - Year-over-year growth (2024-2029) (%)
        • 14.26 The Netherlands - Market size and forecast (2024-2029)
          • Chart on The Netherlands - Market size and forecast (2024-2029) ($ million)
          • Data Table on The Netherlands - Market size and forecast (2024-2029) ($ million)
          • Chart on The Netherlands - Year-over-year growth (2024-2029) (%)
          • Data Table on The Netherlands - Year-over-year growth (2024-2029) (%)

        15 Drivers, Challenges, and Opportunity/Restraints

        • 15.1 Market drivers
          • 15.2 Market challenges
            • 15.3 Impact of drivers and challenges
              • Impact of drivers and challenges in 2024 and 2029
            • 15.4 Market opportunities/restraints

              16 Competitive Landscape

              • 16.1 Overview
                • 16.2 Competitive Landscape
                  • Overview on criticality of inputs and factors of differentiation
                • 16.3 Landscape disruption
                  • Overview on factors of disruption
                • 16.4 Industry risks
                  • Impact of key risks on business

                17 Competitive Analysis

                • 17.1 Companies profiled
                  • Companies covered
                • 17.2 Company ranking index
                  • Company ranking index
                • 17.3 Market positioning of companies
                  • Matrix on companies position and classification
                • 17.4 BNP Paribas SA
                  • BNP Paribas SA - Overview
                  • BNP Paribas SA - Business segments
                  • BNP Paribas SA - Key news
                  • BNP Paribas SA - Key offerings
                  • BNP Paribas SA - Segment focus
                  • SWOT
                • 17.5 eToro
                  • eToro - Overview
                  • eToro - Product / Service
                  • eToro - Key offerings
                  • SWOT
                • 17.6 FMR LLC
                  • FMR LLC - Overview
                  • FMR LLC - Product / Service
                  • FMR LLC - Key offerings
                  • SWOT
                • 17.7 FP Markets LLC
                  • FP Markets LLC - Overview
                  • FP Markets LLC - Product / Service
                  • FP Markets LLC - Key offerings
                  • SWOT
                • 17.8 HDFC Bank Ltd.
                  • HDFC Bank Ltd. - Overview
                  • HDFC Bank Ltd. - Business segments
                  • HDFC Bank Ltd. - Key offerings
                  • HDFC Bank Ltd. - Segment focus
                  • SWOT
                • 17.9 IG Group Holdings Plc
                  • IG Group Holdings Plc - Overview
                  • IG Group Holdings Plc - Business segments
                  • IG Group Holdings Plc - Key offerings
                  • IG Group Holdings Plc - Segment focus
                  • SWOT
                • 17.10 Interactive Brokers LLC
                  • Interactive Brokers LLC - Overview
                  • Interactive Brokers LLC - Product / Service
                  • Interactive Brokers LLC - Key offerings
                  • SWOT
                • 17.11 Kotak Mahindra Bank Ltd.
                  • Kotak Mahindra Bank Ltd. - Overview
                  • Kotak Mahindra Bank Ltd. - Business segments
                  • Kotak Mahindra Bank Ltd. - Key offerings
                  • Kotak Mahindra Bank Ltd. - Segment focus
                  • SWOT
                • 17.12 Morgan Stanley
                  • Morgan Stanley - Overview
                  • Morgan Stanley - Business segments
                  • Morgan Stanley - Key offerings
                  • Morgan Stanley - Segment focus
                  • SWOT
                • 17.13 Regal Securities Inc.
                  • Regal Securities Inc. - Overview
                  • Regal Securities Inc. - Product / Service
                  • Regal Securities Inc. - Key offerings
                  • SWOT
                • 17.14 Saxo Bank AS
                  • Saxo Bank AS - Overview
                  • Saxo Bank AS - Product / Service
                  • Saxo Bank AS - Key offerings
                  • SWOT
                • 17.15 The Charles Schwab Corp.
                  • The Charles Schwab Corp. - Overview
                  • The Charles Schwab Corp. - Business segments
                  • The Charles Schwab Corp. - Key offerings
                  • The Charles Schwab Corp. - Segment focus
                  • SWOT
                • 17.16 Trading 212 Ltd.
                  • Trading 212 Ltd. - Overview
                  • Trading 212 Ltd. - Product / Service
                  • Trading 212 Ltd. - Key offerings
                  • SWOT
                • 17.17 XTB S.A.
                  • XTB S.A. - Overview
                  • XTB S.A. - Business segments
                  • XTB S.A. - Key offerings
                  • XTB S.A. - Segment focus
                  • SWOT
                • 17.18 Zerodha Broking Ltd.
                  • Zerodha Broking Ltd. - Overview
                  • Zerodha Broking Ltd. - Product / Service
                  • Zerodha Broking Ltd. - Key offerings
                  • SWOT

                18 Appendix

                • 18.1 Scope of the report
                  • 18.2 Inclusions and exclusions checklist
                    • Inclusions checklist
                    • Exclusions checklist
                  • 18.3 Currency conversion rates for US$
                    • Currency conversion rates for US$
                  • 18.4 Research methodology
                    • Research methodology
                  • 18.5 Data procurement
                    • Information sources
                  • 18.6 Data validation
                    • Data validation
                  • 18.7 Validation techniques employed for market sizing
                    • Validation techniques employed for market sizing
                  • 18.8 Data synthesis
                    • Data synthesis
                  • 18.9 360 degree market analysis
                    • 360 degree market analysis
                  • 18.10 List of abbreviations
                    • List of abbreviations

                  Research Methodology

                  Technavio presents a detailed picture of the market by way of study, synthesis, and summation of data from multiple sources. The analysts have presented the various facets of the market with a particular focus on identifying the key industry influencers. The data thus presented is comprehensive, reliable, and the result of extensive research, both primary and secondary.

                  INFORMATION SOURCES

                  Primary sources

                  • Manufacturers and suppliers
                  • Channel partners
                  • Industry experts
                  • Strategic decision makers

                  Secondary sources

                  • Industry journals and periodicals
                  • Government data
                  • Financial reports of key industry players
                  • Historical data
                  • Press releases

                  DATA ANALYSIS

                  Data Synthesis

                  • Collation of data
                  • Estimation of key figures
                  • Analysis of derived insights

                  Data Validation

                  • Triangulation with data models
                  • Reference against proprietary databases
                  • Corroboration with industry experts

                  REPORT WRITING

                  Qualitative

                  • Market drivers
                  • Market challenges
                  • Market trends
                  • Five forces analysis

                  Quantitative

                  • Market size and forecast
                  • Market segmentation
                  • Geographical insights
                  • Competitive landscape

                  Interested in this report?

                  Get your sample now to see our research methodology and insights!

                  Download Now

                  Frequently Asked Questions

                  E-Brokerage market growth will increase by $ 7392.1 mn during 2025-2029 .

                  The E-Brokerage market is expected to grow at a CAGR of 7.9% during 2025-2029 .

                  E-Brokerage market is segmented by Service Type( Full time broker, Discounted broker) Application( Individual investor, Institutional investor) Ownership( Privately held, Publicly held, APAC, South America, Middle East and Africa)

                  5Paisa Capital Ltd., Angel One Ltd., BNP Paribas SA, eToro, FMR LLC, FP Markets LLC, HDFC Bank Ltd., Huatai Securities Co. Ltd., IG Group Holdings Plc, Interactive Brokers LLC, Kotak Mahindra Bank Ltd., Morgan Stanley, Motilal Oswal Financial Services Ltd., Regal Securities Inc., Saxo Bank AS, The Charles Schwab Corp., Trading 212 Ltd., VNS, XTB S.A., Zerodha Broking Ltd. are a few of the key vendors in the E-Brokerage market.

                  Europe will register the highest growth rate of 41% among the other regions. Therefore, the E-Brokerage market in Europe is expected to garner significant business opportunities for the vendors during the forecast period.

                  US, China, Germany, Japan, UK, Australia, India, France, Brazil, Canada, UAE, Rest of World (ROW), Saudi Arabia, France, South Korea, Mexico, The Netherlands

                  • Proliferation of internet access boosting e-brokerageIncreased internet access means more people have the ability to connect to e-brokerage platforms from various locations worldwide. This expanded reach has broadened the potential customer base for e-brokerage firms is the driving factor this market.
                  • allowing them to tap into markets that were previously inaccessible. With the internet is the driving factor this market.
                  • e-brokerage platforms are accessible around the clock is the driving factor this market.
                  • regardless of time zones or geographical barriers. Investors can trade securities and manage their portfolios at any time is the driving factor this market.
                  • providing unprecedented convenience and flexibility. Internet-based operations allow e-brokerage firms to streamline processes is the driving factor this market.
                  • automate tasks is the driving factor this market.
                  • and reduce overhead costs associated with physical locations and manual transactions. These cost savings can be passed on to clients in the form of lower fees and commissions is the driving factor this market.
                  • making e-brokerage more affordable and attractive. User-friendly interfaces and intuitive design make e-brokerage platforms accessible to investors of all skill levels. With simple navigation and comprehensive features is the driving factor this market.
                  • even novice investors can easily navigate through the platform is the driving factor this market.
                  • execute trades is the driving factor this market.
                  • and manage their portfolios with confidence. The internet enables e-brokerage platforms to deliver real-time market data is the driving factor this market.
                  • news updates is the driving factor this market.
                  • and research tools to investors instantly. This access to timely information empowers investors to make informed decisions and react quickly to market developments is the driving factor this market.
                  • enhancing their trading effectiveness. The proliferation of internet access has democratized access to financial markets and empowered individual investors by making investing more accessible is the driving factor this market.
                  • affordable is the driving factor this market.
                  • and convenient for people around the globe is the driving factor this market.
                  • which will fuel the growth of the global e-brokerage market during the forecast period. is the driving factor this market.

                  The E-Brokerage market vendors should focus on grabbing business opportunities from the Full time broker segment as it accounted for the largest market share in the base year.