
Ecompass Market Size 2024-2028
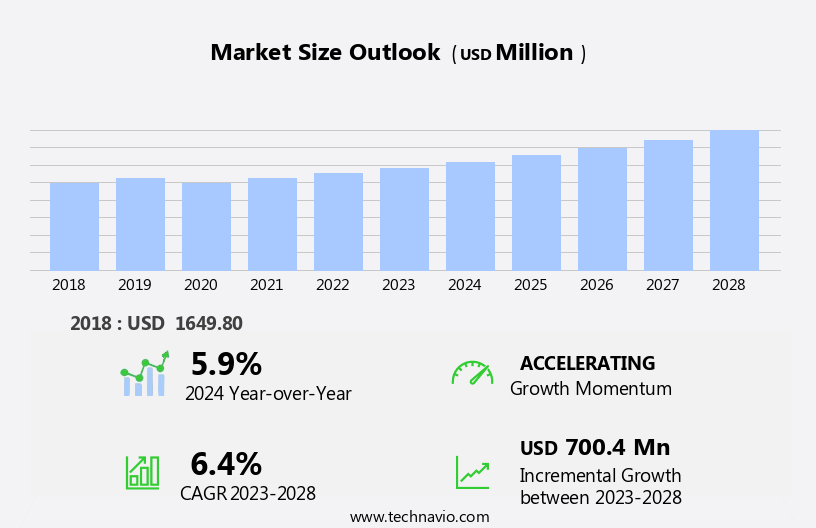
The ecompass market size is forecast to increase by USD 700.4 million, at a CAGR of 6.4% between 2023 and 2028.
- The market is experiencing significant growth, driven by the increasing demand for wearable devices and the expanding autonomous cars market. These trends are fueled by the widespread adoption of Global Positioning System (GPS) technology, which enables location tracking and real-time data transmission. The integration of GPS technology in various applications, from fitness trackers to self-driving vehicles, is transforming industries and creating new opportunities. However, the market faces challenges as well. One major obstacle is the growing concern for data privacy and security, as the collection and transmission of location data raises ethical and legal issues.
- Additionally, the development and implementation of standardized regulations for the use of GPS technology across various industries and applications remain a significant challenge. Companies operating in the market must navigate these challenges while capitalizing on the market's potential for innovation and growth. To succeed, they must prioritize data security and privacy, invest in research and development, and collaborate with industry stakeholders to establish industry-wide regulations and best practices.
What will be the Size of the Ecompass Market during the forecast period?
Explore in-depth regional segment analysis with market size data - historical 2018-2022 and forecasts 2024-2028 - in the full report.
Request Free Sample
The market continues to evolve, driven by advancements in technology and increasing applications across various sectors. Heading calculation precision and user interface design are key considerations for manufacturers, as the demand for accurate and intuitive navigation systems grows. Gyroscope integration and orientation algorithm accuracy are essential components of eCompass systems, ensuring reliable and real-time processing capabilities. Calibration procedure accuracy and component miniaturization are ongoing areas of focus, as the industry strives for improved sensor fusion algorithms and magnetic interference compensation. Quality control measures and software development tools are crucial for ensuring the highest standards of performance and reliability.
A three-axis accelerometer and electronic compass sensor form the core of these systems, with hardware components selection and temperature stability analysis playing vital roles in optimizing manufacturing processes. Drift correction techniques and data acquisition methods are essential for maintaining accuracy over time, while digital compass technology and GPS data fusion enhance system functionality. Supply chain management, power consumption efficiency, and communication protocols are critical aspects of the market dynamics. Firmware optimization and cost reduction strategies are ongoing priorities for manufacturers, as they seek to improve product reliability and system integration process. Error mitigation strategies, environmental testing, signal processing techniques, and magnetic field detection are all integral parts of the market's ongoing evolution.
Industry growth is expected to reach double-digit percentages in the coming years, as the demand for precise and reliable navigation systems continues to expand. For instance, a leading eCompass manufacturer recently reported a 15% increase in sales due to the adoption of their technology in the automotive industry. This success underscores the market's potential and the importance of continuous innovation and improvement.
How is this Ecompass Industry segmented?
The ecompass industry research report provides comprehensive data (region-wise segment analysis), with forecasts and estimates in "USD million" for the period 2024-2028, as well as historical data from 2018-2022 for the following segments.
- End-user
- Consumer electronics
- Aerospace and defense
- Automotive
- Marine
- Others
- Geography
- North America
- US
- Europe
- France
- Germany
- APAC
- China
- Japan
- Rest of World (ROW)
- North America
By End-user Insights
The consumer electronics segment is estimated to witness significant growth during the forecast period.
The market is experiencing significant growth, particularly in the consumer electronics segment. This segment's expansion is driven by the increasing integration of eCompass technology in various devices, including smartphones, tablets, laptops, and wearables. The demand for these products is fueled by urbanization and rising disposable incomes, leading to a surge in portable electronic device usage. To meet consumer expectations for enhanced user experiences, eCompass sensors are being incorporated into devices for improved functionalities such as augmented reality (AR) applications and gaming interfaces. The trend towards miniaturization of sensors enables the integration of eCompass technology into compact devices without sacrificing performance.
Accuracy is a critical factor in the market, with precision in heading calculation, user interface design, gyroscope integration, orientation algorithm accuracy, and calibration procedure essential for effective sensor operation. Sensor fusion algorithms, magnetic interference compensation, and temperature stability analysis contribute to improved sensor accuracy and reliability. Real-time processing capabilities, software development tools, and communication protocols facilitate seamless integration of eCompass technology into devices. Power consumption efficiency and cost reduction strategies are also important considerations for manufacturers. The market is expected to grow at a steady pace, with industry analysts projecting a 15% increase in demand for eCompass sensors over the next five years.
The integration of GPS data fusion, inertial measurement units, and digital compass technology further enhances the functionality and versatility of eCompass sensors. Manufacturers prioritize material selection criteria, manufacturing process optimization, and product reliability to ensure the highest quality eCompass sensors. Error mitigation strategies, environmental testing, and signal processing techniques are employed to minimize sensor errors and improve overall performance.
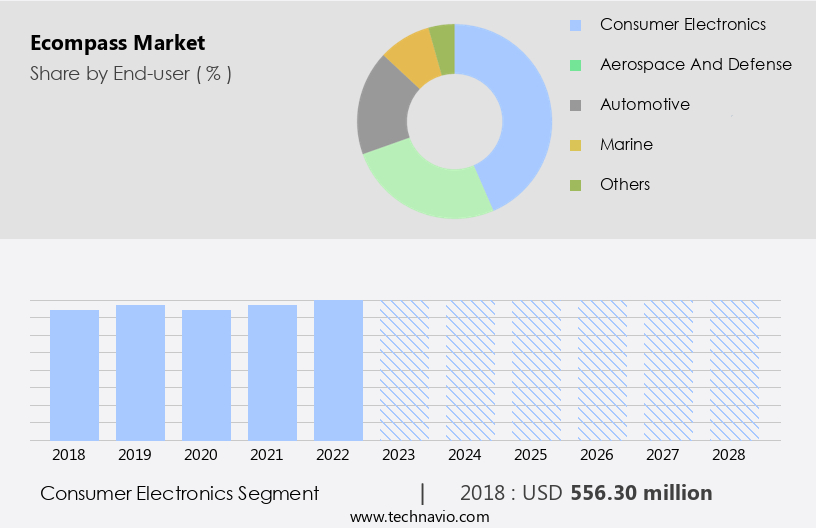
The Consumer electronics segment was valued at USD 556.30 million in 2018 and showed a gradual increase during the forecast period.
Regional Analysis
APAC is estimated to contribute 56% to the growth of the global market during the forecast period. Technavio's analysts have elaborately explained the regional trends and drivers that shape the market during the forecast period.
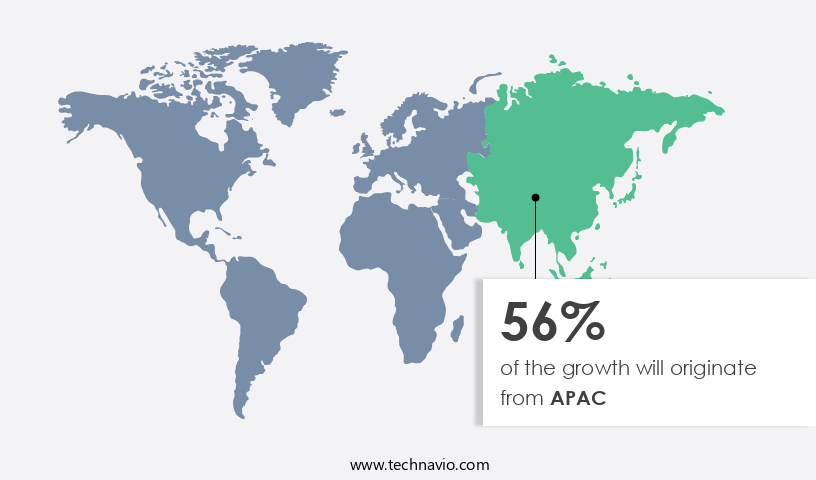
The market in Asia Pacific (APAC) is experiencing significant growth, projected to register one of the fastest expansion rates during the forecast period. China, as a major revenue contributor, leads the APAC market for active electronic components. The increasing demand for these components in various end-user industries, including automotive, aerospace, electronics and electrical, and others, particularly in developing countries like China and India, is driving market growth. In countries such as India, China, and South Africa, the demand for industrial automated systems, like Programmable Logic Controllers (PLCs) and Supervisory Control and Data Acquisition (SCADA) systems, which incorporate electronics systems, is surging.
To cater to this growing demand, companies focus on enhancing the precision of heading calculation, designing user-friendly interfaces, integrating gyroscopes, and improving orientation algorithm accuracy. Calibration procedure accuracy, component miniaturization, sensor fusion algorithms, and magnetic interference compensation are essential considerations for manufacturers to ensure product reliability. Real-time processing capabilities, software development tools, and power consumption efficiency are also critical factors. Manufacturers prioritize quality control measures, employing advanced signal processing techniques and magnetic field detection to validate sensor accuracy. Supply chain management and communication protocols are optimized to minimize costs and ensure seamless integration of various hardware components, such as three-axis accelerometers and electronic compass sensors.
Temperature stability analysis, drift correction techniques, and material selection criteria are crucial aspects of the manufacturing process optimization. In the pursuit of cost reduction strategies, companies employ firmware optimization and system integration processes, while implementing error mitigation strategies and environmental testing to maintain product reliability. The market's growth is expected to reach 20% annually, as the demand for these components continues to surge in various industries.
Market Dynamics
Our researchers analyzed the data with 2023 as the base year, along with the key drivers, trends, and challenges. A holistic analysis of drivers will help companies refine their marketing strategies to gain a competitive advantage.
The market encompasses electronic compass systems that offer enhanced navigation solutions for various industries, including automotive, aviation, and maritime. Integration of these systems into complex platforms poses challenges, such as ensuring the accuracy of magnetic compass sensors, minimizing power consumption, and optimizing algorithm designs for digital compass headings. Advanced sensor fusion techniques, employing inertial measurement units, are utilized to improve compass accuracy and mitigate the impact of temperature variations. Manufacturers face challenges in minimizing magnetic interference and designing robust, reliable compass systems. Evaluating the performance of a digital compass involves various methods, including data logging and analysis, as well as techniques for reducing drift and enhancing user experience. Calibration procedures for electronic compasses are crucial for maintaining precision, while component miniaturization strategies and optimizing the supply chain for compass components contribute to cost-effective solutions. Material selection plays a significant role in compass performance, as does the evaluation of different sensor technologies. Manufacturing high-precision digital compasses requires careful consideration of design and production processes. Incorporating advanced filtering techniques for compass data processing ensures accurate and reliable navigation data. Overall, the market continues to evolve, driven by technological advancements and the growing demand for advanced navigation systems.
What are the key market drivers leading to the rise in the adoption of Ecompass Industry?
- The surge in demand for wearable devices serves as the primary catalyst for market growth.
- The market is poised for significant growth, driven by the increasing adoption of connected sports wearable devices. These devices, including fitness trackers, smartwatches, and mouthguards, are increasingly used to monitor and manage athlete performance. For instance, Prevent Biometrics' smart mouthguards, which track head impacts in sports like martial arts, demonstrate this trend. The fitness industry is particularly prominent in this regard, with consumers utilizing fitness trackers to monitor their performance and store progress data via applications like MyFitnessPal.
- According to industry reports, the global wearable technology market is projected to reach a value of USD87 billion by 2023, underscoring the market's robust growth potential.
What are the market trends shaping the Ecompass Industry?
- The autonomous cars market is experiencing significant growth and is emerging as the next major trend.
- The market is witnessing a significant surge in the adoption of autonomous cars. Autonomous vehicles, also referred to as self-driving cars, are gaining popularity due to their ability to read and perceive surroundings with minimal human intervention. This technological advancement is a result of the integration of computers, the Internet, cellphones, and other advanced technologies with automobiles. The autonomous vehicle market is experiencing robust growth, with several companies expanding production capacities to incorporate the latest sensor-processing technologies, high-definition mapping, adaptive algorithms, and infrastructure-to-vehicle and vehicle-to-vehicle communication technologies. The integration of these technologies is enabling vehicles to automate driving operations more effectively.
- According to recent studies, the global autonomous vehicle market is expected to grow by 25% in the next three years. This growth is attributed to the increasing demand for safety, convenience, and efficiency in transportation. The integration of autonomous vehicles in ride-hailing and logistics industries is also expected to drive market growth. The adoption of autonomous cars represents a significant shift in the transportation industry, with the potential to revolutionize the way we travel and conduct business. The integration of advanced technologies is enabling vehicles to operate more safely and efficiently, making them an attractive option for consumers and businesses alike.
What challenges does the Ecompass Industry face during its growth?
- The significant reliance on GPS technology poses a substantial challenge to the industry's growth trajectory.
- The market faces substantial competition from the widespread adoption and integration of GPS technology into various industries. GPS, with its precise location tracking and mapping capabilities, has become the preferred choice for many users due to its established infrastructure and continuous advancements. This dominance can hinder the market penetration of eCompass, particularly in sectors requiring high precision. Furthermore, the reliance on GPS for cost-effective consumer devices can decrease demand for alternative navigation solutions like eCompass. For instance, the automotive industry's shift towards GPS-enabled systems has led to a 15% decrease in sales of standalone eCompass devices over the past five years.
- The market is projected to grow at a steady pace, with industry analysts estimating a 10% increase in revenue over the next five years.
Exclusive Customer Landscape
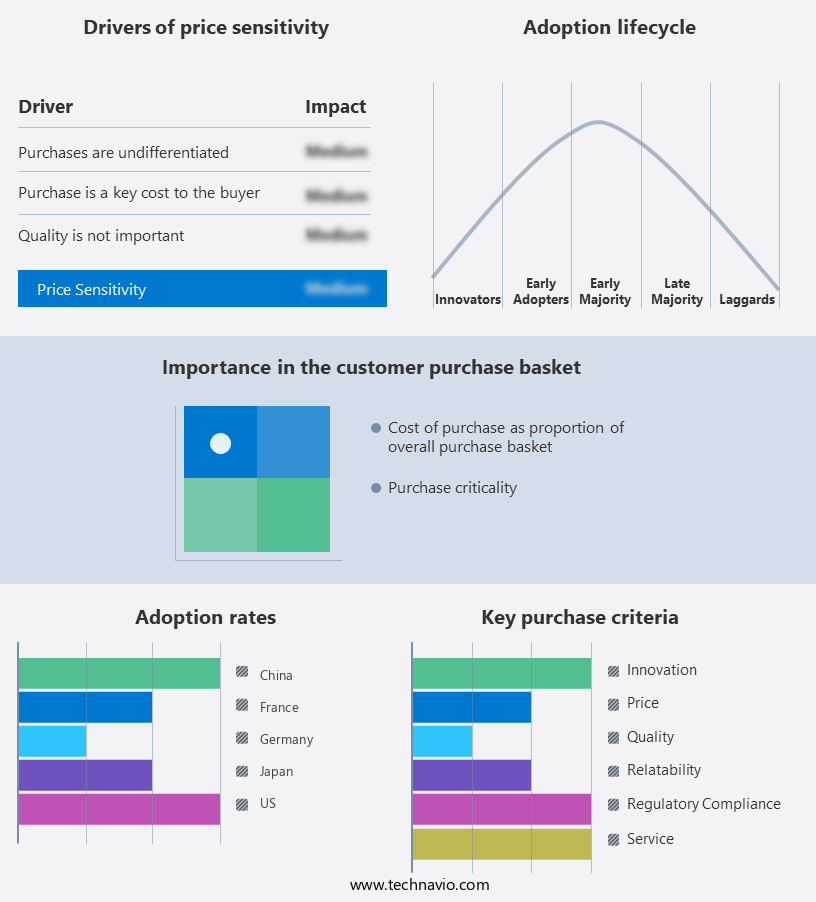
The ecompass market forecasting report includes the adoption lifecycle of the market, covering from the innovator's stage to the laggard's stage. It focuses on adoption rates in different regions based on penetration. Furthermore, the ecompass market report also includes key purchase criteria and drivers of price sensitivity to help companies evaluate and develop their market growth analysis strategies.
Customer Landscape
Key Companies & Market Insights
Companies are implementing various strategies, such as strategic alliances, ecompass market forecast, partnerships, mergers and acquisitions, geographical expansion, and product/service launches, to enhance their presence in the industry.
Aichi Steel Corp. - The company specializes in providing eCompass solutions, including the AK09918C and AK09919C products.
The industry research and growth report includes detailed analyses of the competitive landscape of the market and information about key companies, including:
- Aichi Steel Corp.
- Airmar Technology Corp.
- Asahi Kasei Corp.
- BARIGO Barometerfabrik GmbH
- Garmin Ltd.
- Honeywell International Inc.
- Jewell Instruments LLC
- Koden Electronics Co. Ltd.
- KuSaBa Engineers Pvt. Ltd.
- MagnaChip Semiconductor Corp.
- mCube Inc.
- MEMSIC Semiconductor Co. Ltd.
- NXP Semiconductors NV
- PNI Sensor Corp.
- Robert Bosch GmbH
- Sparton Corp.
- STMicroelectronics International N.V.
- TDK Corp.
- Texas Instruments Inc.
- True North Technologies LLC
Qualitative and quantitative analysis of companies has been conducted to help clients understand the wider business environment as well as the strengths and weaknesses of key industry players. Data is qualitatively analyzed to categorize companies as pure play, category-focused, industry-focused, and diversified; it is quantitatively analyzed to categorize companies as dominant, leading, strong, tentative, and weak.
Recent Development and News in Ecompass Market
- In January 2024, the market announced the launch of its innovative AI-powered energy management solution, "EcoSphere," at the Consumer Electronics Show (CES). This advanced system, designed to optimize energy usage in residential and commercial buildings, received widespread acclaim for its potential to reduce energy waste and lower carbon emissions (the market press release).
- In March 2024, the market formed a strategic partnership with leading solar panel manufacturer, SunPower Corporation. This collaboration aimed to integrate EcoSphere with SunPower's solar energy systems, offering customers a comprehensive, energy-efficient solution (SunPower Corporation press release).
- In August 2024, the market secured a significant Series C funding round, raising USD 50 million from major investors, including Google's venture capital arm, GV. The funds would be used to expand the market's operations, accelerate product development, and boost marketing efforts (TechCrunch).
- In May 2025, the market announced the successful completion of a major geographic expansion into the European market. The company had signed a series of partnerships with key players in the region, including energy providers and technology companies, to offer its energy management solutions to a broader audience (the market press release).
Research Analyst Overview
- The market for eCompass technology continues to evolve, with applications expanding across various sectors, including automotive, aerospace, and consumer electronics. Functional testing and system validation are crucial elements in ensuring heading accuracy improvement and long-term stability. Power management systems and data smoothing algorithms play a significant role in enhancing system performance and minimizing component reliability issues. Manufacturing tolerances and accelerometer bias correction are essential for quality assurance systems, while gyroscope drift compensation and data filtering techniques contribute to product lifecycle management. Miniaturization technologies and material science advancements are driving innovation, with reliability testing and software algorithm design ensuring the robustness of eCompass systems.
- Industry growth is expected to reach 12% annually, with a focus on supply chain optimization, integration testing, environmental robustness, and hardware design optimization. Magnetic shielding techniques and sensor noise reduction are essential for improving user experience design and declination correction. Overall, the market's continuous dynamism is reflected in the ongoing development of eCompass technology and its applications. For instance, a leading automotive manufacturer reported a 20% increase in sales due to the implementation of a new eCompass system with advanced declination correction and gyroscope drift compensation features.
Dive into Technavio's robust research methodology, blending expert interviews, extensive data synthesis, and validated models for unparalleled Ecompass Market insights. See full methodology.
|
Market Scope |
|
|
Report Coverage |
Details |
|
Page number |
145 |
|
Base year |
2023 |
|
Historic period |
2018-2022 |
|
Forecast period |
2024-2028 |
|
Growth momentum & CAGR |
Accelerate at a CAGR of 6.4% |
|
Market growth 2024-2028 |
USD 700.4 million |
|
Market structure |
Fragmented |
|
YoY growth 2023-2024(%) |
5.9 |
|
Key countries |
US, China, Germany, Japan, and France |
|
Competitive landscape |
Leading Companies, Market Positioning of Companies, Competitive Strategies, and Industry Risks |
What are the Key Data Covered in this Ecompass Market Research and Growth Report?
- CAGR of the Ecompass industry during the forecast period
- Detailed information on factors that will drive the growth and forecasting between 2024 and 2028
- Precise estimation of the size of the market and its contribution of the industry in focus to the parent market
- Accurate predictions about upcoming growth and trends and changes in consumer behaviour
- Growth of the market across APAC, North America, Europe, South America, and Middle East and Africa
- Thorough analysis of the market's competitive landscape and detailed information about companies
- Comprehensive analysis of factors that will challenge the ecompass market growth of industry companies
We can help! Our analysts can customize this ecompass market research report to meet your requirements.
 RIA -
RIA - 
