
Edge Ai Hardware For Iot Market Size and Growth Forecast 2026-2030
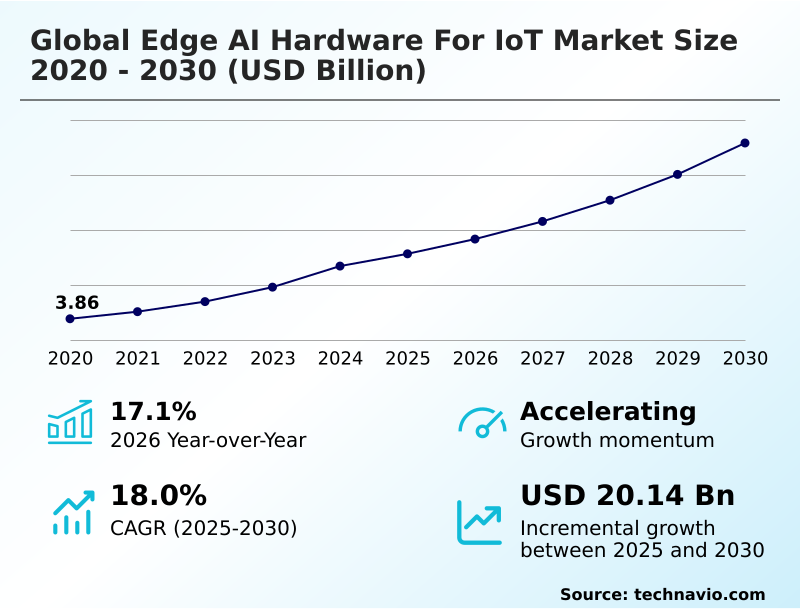
The Edge Ai Hardware For Iot Market size was valued at USD 15.67 billion in 2025 growing at a CAGR of 18% during the forecast period 2026-2030.
North America accounts for 33.5% of incremental growth during the forecast period. The Smartphones segment by Device was valued at USD 5.64 billion in 2024, while the ASIC segment holds the largest revenue share by Component.
The market is projected to grow by USD 31.95 billion from 2020 to 2030, with USD 20.14 billion of the growth expected during the forecast period of 2025 to 2030.
Get Key Insights on Market Forecast (PDF) Request Free Sample
Edge Ai Hardware For Iot Market Overview
The edge AI hardware for IoT market is defined by the shift of computational power from centralized clouds to decentralized devices. This move is driven by the need for immediate data analysis in applications where latency is critical. For instance, in an advanced manufacturing facility, machine vision systems powered by a vision processing unit (VPU) inspect components on a high-speed assembly line. Using on-device training, the system learns to identify microscopic defects in real-time, triggering an alert without sending massive video files to a remote server. This localized processing, which relies on a real-time operating system (RTOS) and efficient hardware-software co-design, not only improves production quality but also significantly reduces network bandwidth requirements. The year-over-year market growth of 17.1% underscores the industry's rapid adoption of these technologies, including specialized tensor processing unit (TPU) and dynamically reconfigurable processor designs, to build more responsive and secure autonomous systems.
Drivers, Trends, and Challenges in the Edge Ai Hardware For Iot Market
Procurement decisions in the global edge AI hardware for IoT market 2026-2030 are increasingly influenced by the total cost of ownership, which extends beyond initial hardware acquisition. The power consumption of edge AI accelerators is a major factor, as devices deployed in the field often rely on limited battery life, making energy efficiency a critical performance metric.
Furthermore, organizations face significant security vulnerabilities in edge AI devices, necessitating hardware with built-in protections. For many, the central challenge is the cost-benefit analysis of ASIC vs FPGA for AI workloads; while ASICs offer superior performance for a specific task, FPGAs provide the flexibility to adapt to evolving algorithms.
This is particularly relevant given the complex integration with legacy industrial systems, a process that can incur substantial engineering costs. The real-time object detection on embedded systems, essential for applications from automated retail to industrial safety, demonstrates the clear advantages of decentralized processing.
A typical edge-based computer vision system can achieve latency under 20 milliseconds, a performance metric that cloud-based alternatives, with round-trip times often exceeding 200 milliseconds, cannot match, making the case for localized hardware compelling for any time-sensitive operation.
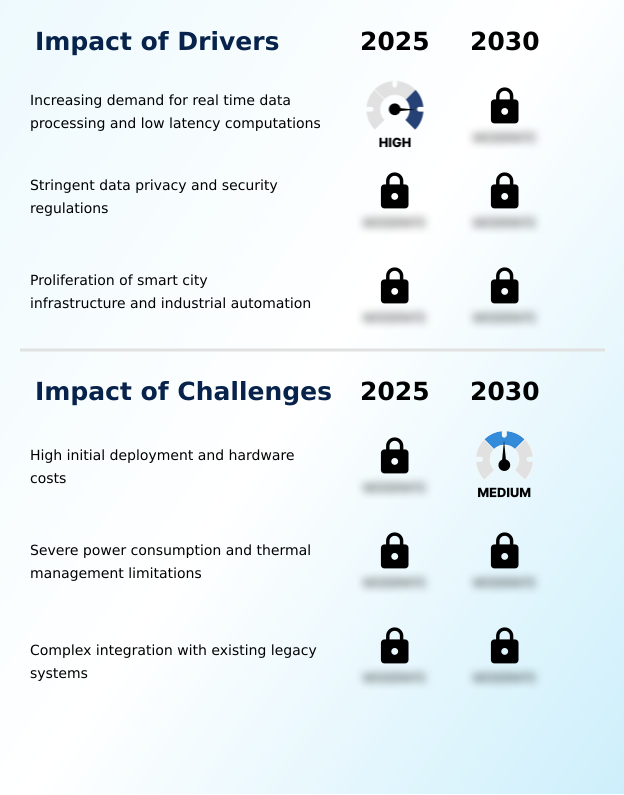
Primary Growth Driver: The increasing demand for real-time data processing and low-latency computations serves as a key driver for the market.
The market's expansion, marked by a 17.1% year-over-year growth, is primarily driven by the critical need for real-time data processing. Applications in industrial automation and autonomous navigation cannot tolerate the latency of cloud-based computation, making on-device inference engines essential.
A second major driver is the increasing stringency of data privacy regulations, such as the GDPR, which incentivize processing sensitive information locally using a secure enclave to minimize data breach risks.
Finally, the proliferation of smart city infrastructure and industrial IoT relies on the ability of embedded systems to perform complex tasks like computer vision and predictive maintenance without overwhelming network bandwidth, cementing the need for powerful, decentralized hardware.
Emerging Market Trend: The integration of neuromorphic engineering within microprocessor architectures is an emerging trend. This development aims to address critical power consumption and parallel processing demands for complex AI algorithms at the edge.
Key trends are reshaping hardware design, with a notable shift toward neuromorphic engineering to emulate the human brain's efficiency. This approach, utilizing spiking neural networks, is ideal for power-constrained tinyML applications. Another significant development is the rise of open-source instruction set architectures, which democratizes the design of custom machine learning accelerators and reduces reliance on proprietary cores.
This fosters innovation in application-specific integrated circuits (ASIC) and field-programmable gate arrays (FPGA). Concurrently, the integration of energy harvesting modules with low-power microcontrollers is enabling the deployment of battery-free, self-sustaining sensors, fundamentally altering the operational lifecycle and total cost of ownership for large-scale IoT networks.
Key Industry Challenge: High initial deployment and hardware costs present a key challenge affecting widespread industry adoption and growth.
Significant challenges restrain market adoption, led by the high initial hardware and deployment costs of specialized system-on-chip (SoC) solutions. For many enterprises, the capital expenditure required to transition from cloud-based models is a major barrier.
Another critical issue involves the severe power consumption and thermal management limitations of high-performance processors like GPUs and FPGAs when deployed in compact, passively cooled edge devices. This engineering trade-off often limits computational capabilities.
Lastly, the complex integration with existing legacy systems, which often lack modern APIs and run on proprietary protocols, presents a formidable technical hurdle, demanding extensive custom software development and increasing project risk and timelines.
Explore Full Market Dynamics Analysis Request Free Sample
Edge Ai Hardware For Iot Market Segmentation
The edge ai hardware for iot industry research report provides comprehensive data including region-wise segment analysis, with forecasts and analysis for the period 2026-2030, as well as historical data from 2020-2024 for the following segments.
Device Segment Analysis
The smartphones segment is estimated to witness significant growth during the forecast period.
Smartphones represent the most significant device category, where the integration of a dedicated inference engine and advanced neural processing unit is now standard.
This is driven by consumer demand for on-device AI features, such as real-time language translation and computational photography, which rely on low-power microcontrollers and efficient machine learning accelerators.
Executing these tasks locally enhances user privacy, a key purchasing driver, as biometric authentication data never leaves the device. The intense competition compels manufacturers to adopt sophisticated hardware-software co-design principles to maximize performance within strict thermal and battery constraints.
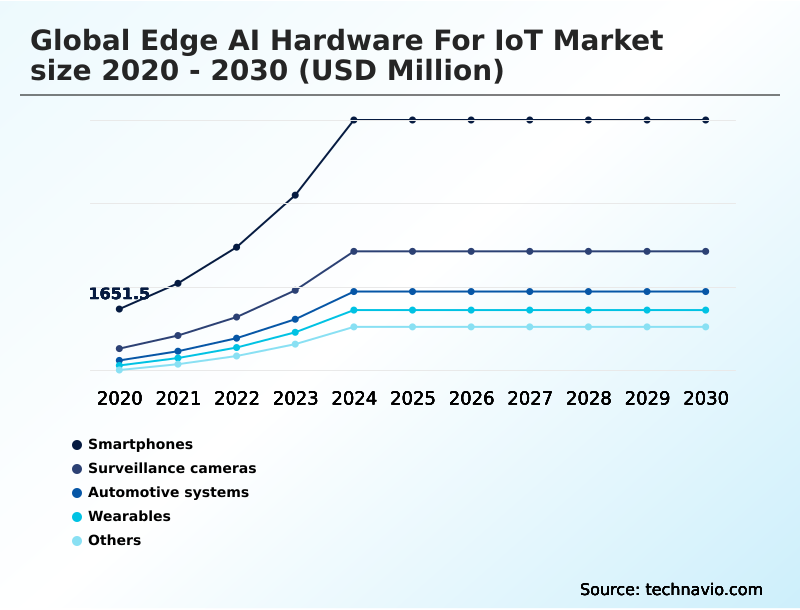
Consequently, the smartphone segment, which is forecast to reach a market size of 6546.5 USD million in 2025, acts as a primary vehicle for deploying cutting-edge system-on-chip architectures with integrated tinyML applications to a mass audience.
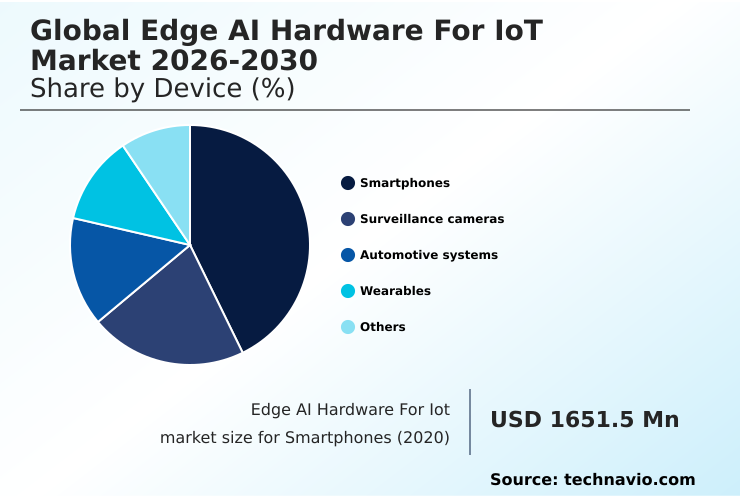
The Smartphones segment was valued at USD 5.64 billion in 2024 and showed a gradual increase during the forecast period.
Edge Ai Hardware For Iot Market by Region: North America Leads with 33.5% Growth Share
North America is estimated to contribute 33.5% to the growth of the global market during the forecast period.
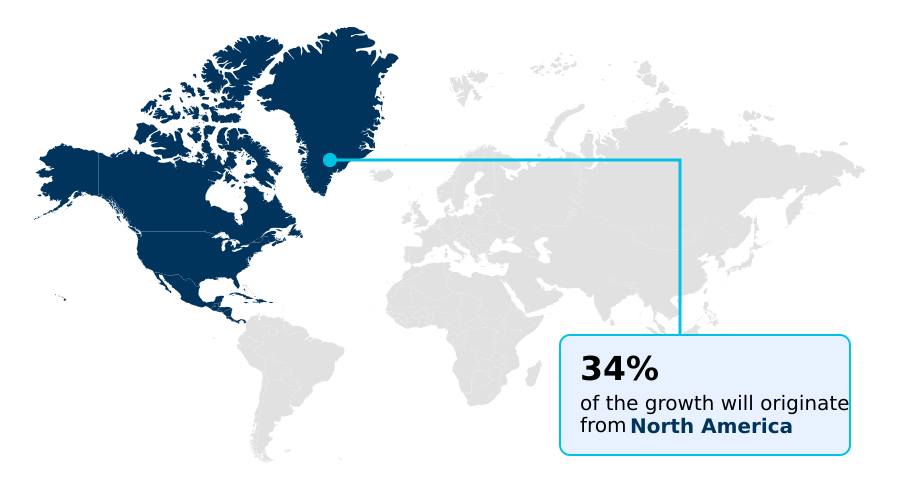
The geographic landscape is led by North America, which is projected to account for 33.5% of the market's growth, largely due to heavy investment in autonomous navigation and advanced medical technology.
These applications demand powerful system-on-chip (SoC) solutions and sophisticated sensor fusion capabilities. In contrast, the APAC region, contributing 29.2% of growth, is driven by large-scale industrial automation and smart city infrastructure projects.
This requires ruggedized embedded systems and machine learning accelerators for deployment in harsh environments. Europe’s focus is on industrial modernization and adherence to strict data privacy regulations, pushing innovation in secure enclave technology and power-efficient microprocessors.
This regional differentiation highlights the diverse end-user requirements shaping global hardware development and procurement strategies.
Customer Landscape Analysis for the Edge Ai Hardware For Iot Market
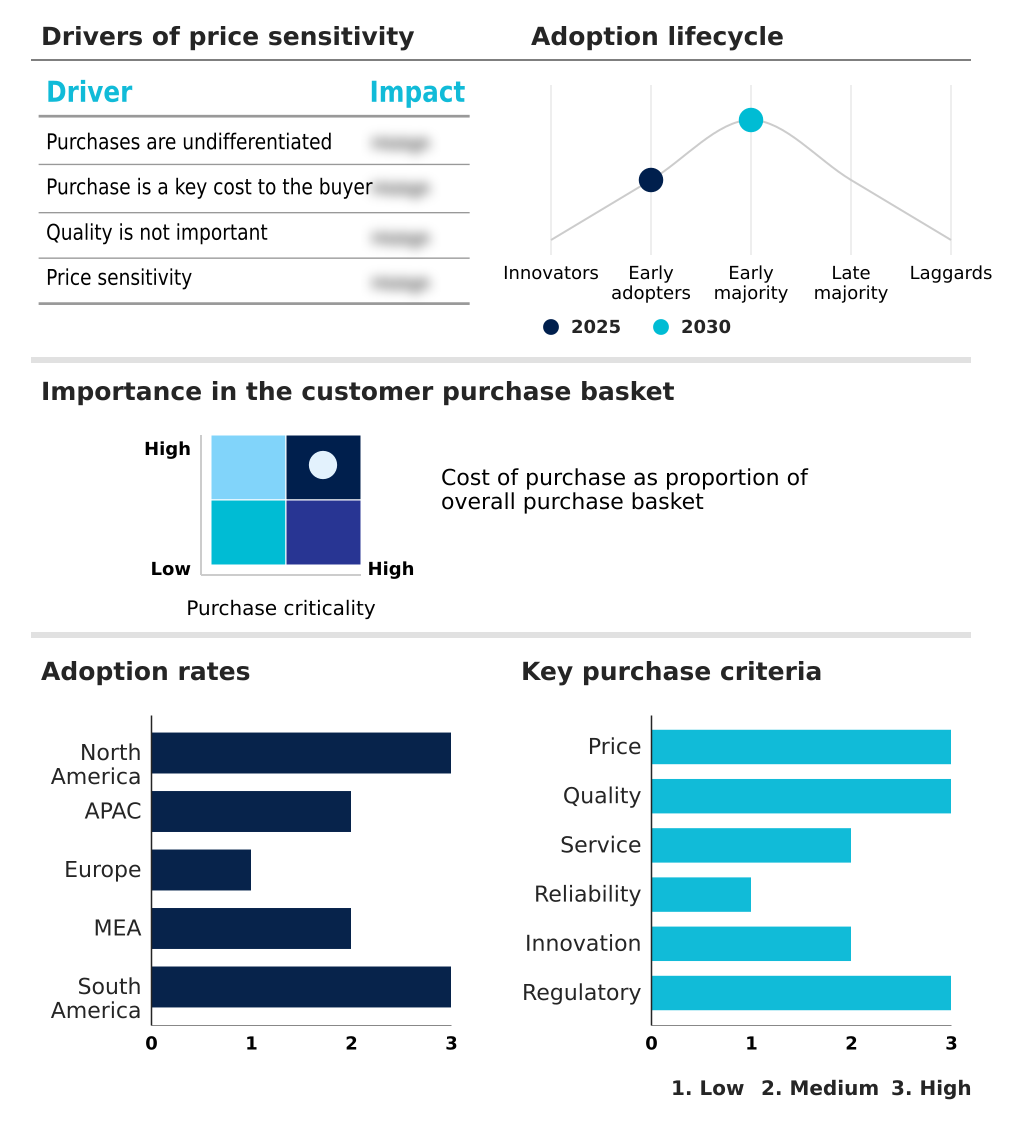
The edge ai hardware for iot market forecasting report includes the adoption lifecycle of the market, covering from the innovator’s stage to the laggard’s stage. It focuses on adoption rates in different regions based on penetration. Furthermore, the edge ai hardware for iot market report also includes key purchase criteria and drivers of price sensitivity to help companies evaluate and develop their market growth analysis strategies.
Competitive Landscape of the Edge Ai Hardware For Iot Market
Companies are implementing various strategies, such as strategic alliances, partnerships, mergers and acquisitions, geographical expansion, and product/service launches, to enhance their presence in the edge ai hardware for iot market industry.
Advanced Micro Devices Inc. - Offerings include specialized silicon and integrated platforms engineered to accelerate AI workloads and complex sensor fusion tasks at the network periphery.
The industry research and growth report includes detailed analyses of the competitive landscape of the market and information about key companies, including:
- Advanced Micro Devices Inc.
- Advantech Co. Ltd.
- Arm Ltd.
- Cisco Systems Inc.
- Dell Technologies Inc.
- Google LLC
- Hailo Technologies Ltd.
- Helium
- Hewlett Packard Enterprise Co.
- Intel Corp.
- Lattice Semiconductor Corp.
- Microchip Technology Inc.
- NVIDIA Corp.
- NXP Semiconductors NV
- Qualcomm Inc.
- Renesas Electronics Corp.
- Silicon Laboratories Inc.
- SiMa Technologies Inc.
- STMicroelectronics NV
- Texas Instruments Inc.
Qualitative and quantitative analysis of companies has been conducted to help clients understand the wider business environment as well as the strengths and weaknesses of key industry players. Data is qualitatively analyzed to categorize companies as pure play, category-focused, industry-focused, and diversified; it is quantitatively analyzed to categorize companies as dominant, leading, strong, tentative, and weak.
Recent Developments in the Edge Ai Hardware For Iot Market
- In March, 2025, embedUR Systems introduced its ModelNova edge AI platform, which combined hardware optimization with pre-trained AI models to simplify deployment for various IoT applications.
- In September, 2025, ASUS IoT formed a strategic partnership with Algorized to co-develop advanced AI-enabled sensing solutions, focusing on improving real-time perception capabilities in smart environment and safety devices.
- In October, 2025, Arm Holdings expanded its AI-focused chip licensing program based on the Armv9 architecture, enabling startups and device manufacturers to design customized, low-power edge AI processors more efficiently.
- In November, 2025, Qualcomm announced its acquisition of Arduino, a strategic move aimed at democratizing AI hardware by integrating advanced AI capabilities into the widely adopted microcontroller platform.
Research Analyst Overview: Edge Ai Hardware For Iot Market
The competitive landscape is characterized by intense innovation cycles focused on optimizing performance-per-watt for AI inference at the network periphery. Boardroom decisions on capital expenditure are increasingly tied to the capabilities of a vendor's hardware-software co-design, which directly impacts the total cost of ownership for large-scale IoT deployments.
For instance, in the automotive sector, adherence to functional safety standards like ISO 26262 is a non-negotiable vendor qualification criterion, demanding processors with a secure enclave and deterministic execution. The market’s year-over-year growth of 17.1% is fueled by the adoption of specialized silicon like vision processing unit (VPU) and tensor processing unit (TPU) hardware.
Established semiconductor firms and agile startups are competing to deliver optimized solutions, from low-power microcontrollers for tinyML applications to high-performance machine learning accelerators for complex sensor fusion, making the ecosystem both fragmented and highly dynamic.
Dive into Technavio’s robust research methodology, blending expert interviews, extensive data synthesis, and validated models for unparalleled Edge Ai Hardware For Iot Market insights. See full methodology.
| Market Scope | |
|---|---|
| Page number | 321 |
| Base year | 2025 |
| Historic period | 2020-2024 |
| Forecast period | 2026-2030 |
| Growth momentum & CAGR | Accelerate at a CAGR of 18% |
| Market growth 2026-2030 | USD 20142.5 million |
| Market structure | Fragmented |
| YoY growth 2025-2026(%) | 17.1% |
| Key countries | US, Canada, Mexico, China, Japan, India, South Korea, Australia, Indonesia, Germany, UK, France, Italy, Spain, The Netherlands, UAE, Saudi Arabia, South Africa, Israel, Qatar, Brazil, Argentina and Chile |
| Competitive landscape | Leading Companies, Market Positioning of Companies, Competitive Strategies, and Industry Risks |
Edge Ai Hardware For Iot Market: Key Questions Answered in This Report
-
What is the expected growth of the Edge Ai Hardware For Iot Market between 2026 and 2030?
-
The Edge Ai Hardware For Iot Market is expected to grow by USD 20.14 billion during 2026-2030, registering a CAGR of 18%. Year-over-year growth in 2026 is estimated at 17.1%%. This acceleration is shaped by increasing demand for real time data processing and low latency computations, which is intensifying demand across multiple end-use verticals covered in the report.
-
-
What segmentation does the market report cover?
-
The report is segmented by Device (Smartphones, Surveillance cameras, Automotive systems, Wearables, and Others), Component (ASIC, GPU, CPU, and FPGA), End-user (Consumer electronics, Manufacturing, Automotive, Healthcare, and Others) and Geography (North America, APAC, Europe, Middle East and Africa, South America). Among these, the Smartphones segment is estimated to witness significant growth during the forecast period, driven by rising adoption across key application areas. Each segment includes detailed qualitative and quantitative analysis, along with historical data from 2020-2024 and forecasts through 2030 with year-over-year growth rates.
-
-
Which regions are analyzed in the report?
-
The report covers North America, APAC, Europe, Middle East and Africa and South America. North America is estimated to contribute 33.5% to market growth during the forecast period. Country-level analysis includes US, Canada, Mexico, China, Japan, India, South Korea, Australia, Indonesia, Germany, UK, France, Italy, Spain, The Netherlands, UAE, Saudi Arabia, South Africa, Israel, Qatar, Brazil, Argentina and Chile, with dedicated market size tables and year-over-year growth for each.
-
-
What are the key growth drivers and market challenges?
-
The primary driver is increasing demand for real time data processing and low latency computations, which is accelerating investment and industry demand. The main challenge is high initial deployment and hardware costs, creating operational barriers for key market participants. The report quantifies the impact of each driver and challenge across 2026 and 2030 with comparative analysis.
-
-
Who are the major players in the Edge Ai Hardware For Iot Market?
-
Key vendors include Advanced Micro Devices Inc., Advantech Co. Ltd., Arm Ltd., Cisco Systems Inc., Dell Technologies Inc., Google LLC, Hailo Technologies Ltd., Helium, Hewlett Packard Enterprise Co., Intel Corp., Lattice Semiconductor Corp., Microchip Technology Inc., NVIDIA Corp., NXP Semiconductors NV, Qualcomm Inc., Renesas Electronics Corp., Silicon Laboratories Inc., SiMa Technologies Inc., STMicroelectronics NV and Texas Instruments Inc.. The report provides qualitative and quantitative analysis categorizing companies as dominant, leading, strong, tentative, and weak based on their market positioning. Company profiles include business segment analysis, SWOT assessment, key offerings, and recent strategic developments.
-
Edge Ai Hardware For Iot Market Research Insights
Market dynamics are shaped by stringent data privacy mandates, such as the General Data Protection Regulation (GDPR), which compel organizations to adopt on-device processing. This minimizes the cross-border transfer of sensitive data, a critical consideration for applications like remote patient monitoring and biometric authentication.
The geographic landscape reflects this, with North America contributing 33.5% to the market's incremental growth, driven by investments in autonomous systems. At the same time, the emergence of energy harvesting modules is enabling new deployments in remote locations.
This complex interplay between regulatory pressure, regional investment, and technological innovation forces decision-makers to continuously evaluate their hardware strategies for federated learning and secure boot processes to maintain a competitive edge.
We can help! Our analysts can customize this edge ai hardware for iot market research report to meet your requirements.
 RIA -
RIA - 
