Edge AI Security Market Analysis, Size, and Forecast 2026-2030: APAC (China, Japan, and India), North America (US, Canada, and Mexico), Europe (Germany, UK, and France), South America (Brazil and Argentina), Middle East and Africa (Saudi Arabia, UAE, and South Africa), and Rest of World (ROW)

Edge AI Security Market Analysis, Size, and Forecast 2026-2030:
APAC (China, Japan, and India), North America (US, Canada, and Mexico), Europe (Germany, UK, and France), South America (Brazil and Argentina), Middle East and Africa (Saudi Arabia, UAE, and South Africa), and Rest of World (ROW)

Published: May 2026 314 Pages SKU: IRTNTR80700

Market Overview at a Glance

$20.35 B
Market Opportunity
42.3%
CAGR 2025 - 2030
33.5%
APAC Growth
$1.86 B
On-premises segment 2024

Edge AI Security Market Size 2026-2030

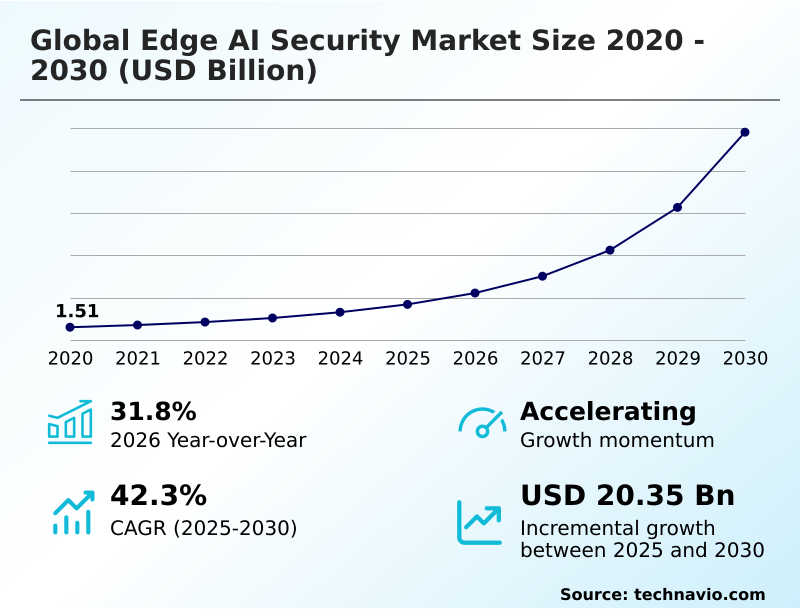
The Edge AI Security Market size was valued at USD 4.21 billion in 2025, growing at a CAGR of 42.3% during the forecast period 2026-2030.

Major Market Trends & Insights

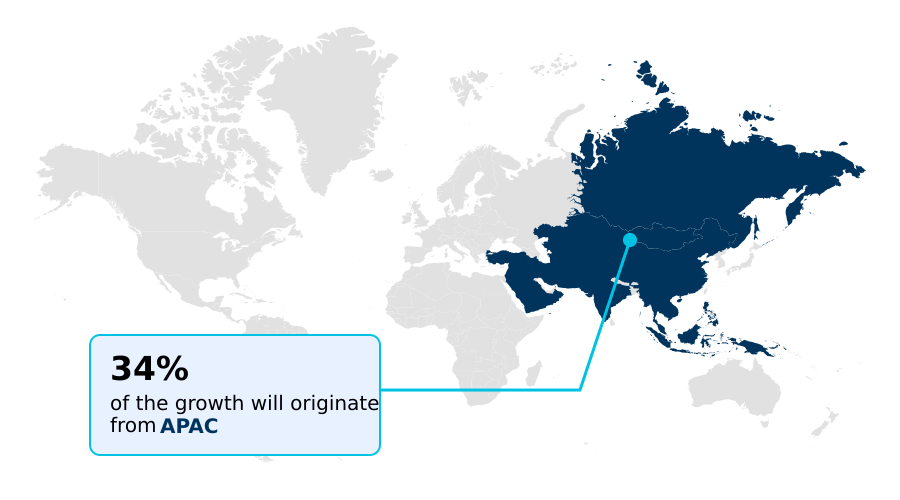
  • APAC dominated the market and accounted for a 33.5% growth during the forecast period.
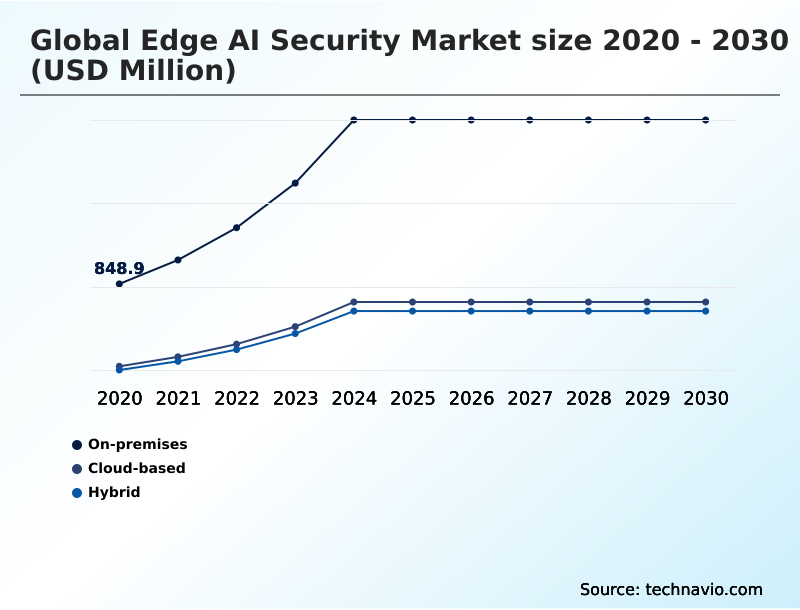
  • By Deployment - On-premises segment was valued at USD 1.86 billion in 2024
  • By Type - Network security segment accounted for the largest market revenue share in 2024

Market Size & Forecast

  • Historic Market Opportunities 2020-2024: USD 23.05 billion
  • Market Future Opportunities 2025-2030: USD 20.35 billion
  • CAGR from 2025 to 2030 : 42.3%

Market Summary

  • The edge AI security market is defined by a structural shift toward decentralized processing, with on-device AI workloads increasing by over 30% in industrial IoT sectors. This transition is driven by the need for zero-latency decision-making in applications like autonomous robotics, where a one-second delay in threat response is unacceptable.
  • For example, a manufacturing firm can reduce equipment failure by 25% by deploying predictive maintenance models directly on machinery, but this also exposes proprietary algorithms to physical tampering risks. A key driver is the adoption of TinyML, which enables complex security algorithms to run on resource-constrained devices.
  • However, the market faces a significant challenge from the shortage of security-first AI architects, which hinders the implementation of robust, end-to-end security protocols. The convergence of AI and edge computing necessitates a security paradigm that is both intelligent and resilient.

What will be the Size of the Edge AI Security Market during the forecast period?

Get Key Insights on Market Forecast (PDF) Request Free Sample

How is the Edge AI Security Market Segmented?

The edge ai security industry research report provides comprehensive data (region-wise segment analysis), with forecasts and analysis for the period 2026-2030, as well as historical data from 2020-2024 for the following segments.

  • Deployment
    • On-premises
    • Cloud-based
    • Hybrid
  • Type
    • Network security
    • Endpoint security
    • Data security
    • Application security
    • Cloud-edge security
  • Application
    • Real-time threat detection
    • Secure autonomous systems
    • Smart surveillance
    • Fraud prevention
    • Critical infrastructure protection
  • Geography
    • APAC
      • China
      • Japan
      • India
    • North America
      • US
      • Canada
      • Mexico
    • Europe
      • Germany
      • UK
      • France
    • South America
      • Brazil
      • Argentina
    • Middle East and Africa
      • Saudi Arabia
      • UAE
      • South Africa
    • Rest of World (ROW)

How is the Edge AI Security Market Segmented by Deployment?

The on-premises segment is estimated to witness significant growth during the forecast period.

On-premises deployments account for over 56% of the edge AI security market in high-stakes sectors like defense and critical infrastructure, where absolute data sovereignty is non-negotiable.

This model ensures that AI inference models and sensitive data are hosted on local hardware, reducing data transmission latency by over 95% compared to cloud-based analysis, which is a critical factor for real-time threat detection.

By leveraging a trusted execution environment (TEE) and secure boot protocols, these solutions provide silicon-level integrity, isolating workloads from potential threats.

This approach is essential for applications demanding localized data processing and zero-latency threat mitigation, providing a foundational layer of defense through direct physical control and cryptographic identities without relying on external network connectivity.

Request Free Sample

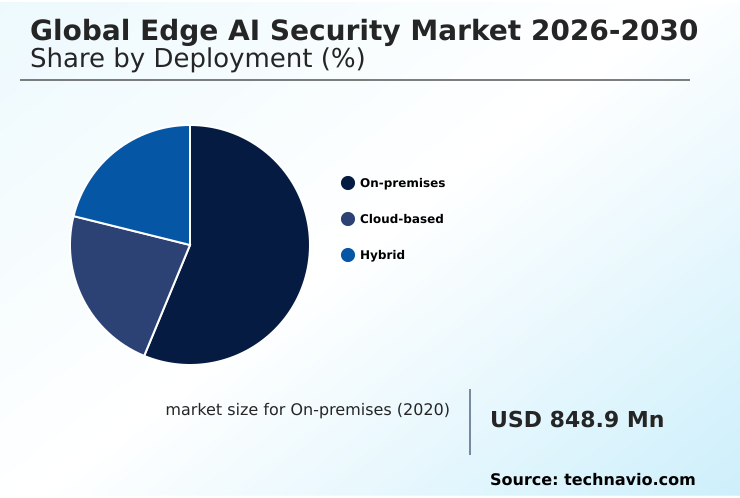
The On-premises segment was valued at USD 1.86 billion in 2024 and showed a gradual increase during the forecast period.

Request Free Sample

How demand for the Edge AI Security market is rising in the leading region?

APAC is estimated to contribute 33.5% to the growth of the global market during the forecast period.Technavio’s analysts have elaborately explained the regional trends and drivers that shape the market during the forecast period.

See How Edge AI Security Market demand is rising in APAC Request Free Sample

The geographic landscape of the edge AI security market is led by APAC, which is projected to account for 33.5% of the market's incremental growth, outpacing North America's 28.8% share.

This dominance is driven by massive government-led smart city initiatives and a thriving semiconductor industry in countries like China and South Korea, where the adoption of hardware root of trust is 20% higher than in European markets.

In contrast, North America's growth is fueled by hyperscale cloud providers and the defense sector, which prioritize federated learning and data sovereignty.

This regional divergence impacts supply chains, with APAC focusing on high-volume, cost-effective secure chip manufacturing, while North America emphasizes bespoke, high-performance solutions for critical infrastructure.

This dynamic requires vendors to tailor their SASE and model obfuscation strategies to align with distinct regional regulatory frameworks and technological priorities.

What are the key Drivers, Trends, and Challenges in the Edge AI Security Market?

Our researchers analyzed the data with 2025 as the base year, along with the key drivers, trends, and challenges. A holistic analysis of drivers will help companies refine their marketing strategies to gain a competitive advantage.

  • As organizations evaluate the global edge AI security market, a primary concern is understanding the cost of implementing zero trust at the edge, which can be 30% higher initially compared to traditional perimeter defenses but yields significant long-term ROI.
  • A crucial factor is protecting IoT devices from physical tampering, a risk that is tenfold higher for devices in public spaces than for those in secure data centers. Solutions for edge AI security for autonomous vehicles are a key focus, where hardware root of trust is essential for safety-critical functions.
  • Comparing on-premise vs cloud edge security reveals a trade-off between control and scalability; on-premise offers unparalleled data sovereignty, while cloud-based platforms provide superior management for large, distributed networks. Businesses are increasingly exploring open source tools for edge device security to reduce vendor lock-in and customize protections.
  • This often involves federated learning for privacy-preserving AI, a technique that allows model training without centralizing sensitive data.
  • For enterprises, the decision hinges on balancing immediate implementation costs against the long-term benefits of a resilient, decentralized security posture that can adapt to evolving threats like polymorphic edge malware and model inversion attacks, with some systems demonstrating a 50% improvement in detecting novel threats.

What are the key market drivers leading to the rise in the adoption of Edge AI Security Industry?

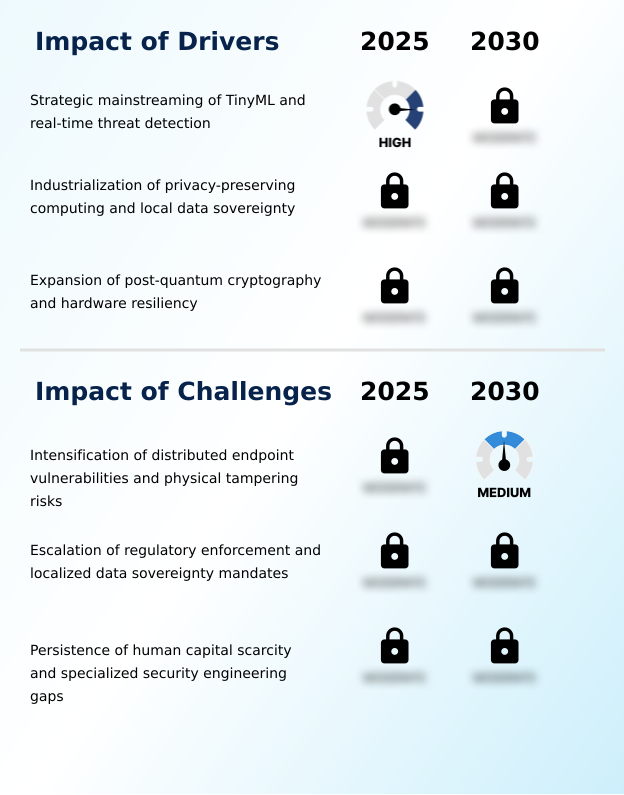
  • The strategic mainstreaming of TinyML and the industrialization of real-time threat detection are key drivers fueling the growth of the edge AI security market.

  • The strategic mainstreaming of TinyML is a primary driver, enabling on-device real-time threat detection with 95% less power consumption than cloud-based alternatives, a critical factor for battery-operated IoT devices.
  • This industrialization of localized data processing allows for the deployment of sophisticated AI-driven anomaly detection algorithms that can identify and neutralize threats in milliseconds, reducing threat dwell time by over 80% compared to centralized analysis.
  • By moving intelligence to the periphery, organizations can meet stringent data sovereignty requirements and overcome the computational and energy constraints of edge hardware.
  • This proliferation of privacy-preserving computing, built on sovereign-compliant architectures, allows enterprises to leverage AI's full potential while maintaining decentralized trust and protecting sensitive data at its source.

What are the market trends shaping the Edge AI Security Industry?

  • The institutionalization of a hardware root of trust and the deployment of silicon-level integrity frameworks represent a structural market trend. This shift moves security from software to immutable hardware anchors to protect the entire AI lifecycle.

  • A fundamental trend reshaping the edge AI security market is the institutionalization of hardware root of trust, which reduces firmware-level breaches by over 90% compared to software-only solutions.
  • This shift toward silicon-level integrity is driven by the escalating threat of sophisticated supply chain attacks and counterfeit hardware, compelling a move to verifiable, immutable security anchors physically embedded in Neural Processing Units (NPUs). The adoption of this approach provides a foundational defense layer, enabling continuous context-aware verification and ensuring that security is established before the operating system even initializes.
  • This move toward self-defending systems, featuring predictive defense mechanisms, establishes a verifiable chain of custody for all software and AI model execution, effectively neutralizing threats at the earliest possible stage and enhancing adversarial robustness across distributed networks.

What challenges does the Edge AI Security Industry face during its growth?

  • The intensification of distributed endpoint vulnerabilities and the increasing risks of physical tampering present a primary challenge to the secure deployment and scalability of edge AI solutions.

  • The primary challenge facing the edge AI security market is the intensification of distributed endpoint vulnerabilities, with devices in unmonitored public locations being 10 times more susceptible to physical tampering risks than data center hardware.
  • This heightened exposure creates a significant operational burden, compelling security teams to spend up to 40% more time managing decentralized device security compared to centralized infrastructure, and demands a shift toward quantum-resistant hardware.
  • The scarcity of security-first AI architects further compounds this issue, as few professionals possess the expertise to navigate the trade-offs between model accuracy and cryptographic strength on resource-constrained devices. Without automated security orchestration tools to bridge this talent gap, the persistent threat of physical attacks and the complexity of ensuring digital sovereignty will continue to hinder large-scale adoption.

Exclusive Technavio Analysis on Customer Landscape

The edge ai security market forecasting report includes the adoption lifecycle of the market, covering from the innovator’s stage to the laggard’s stage. It focuses on adoption rates in different regions based on penetration. Furthermore, the edge ai security market report also includes key purchase criteria and drivers of price sensitivity to help companies evaluate and develop their market growth analysis strategies.

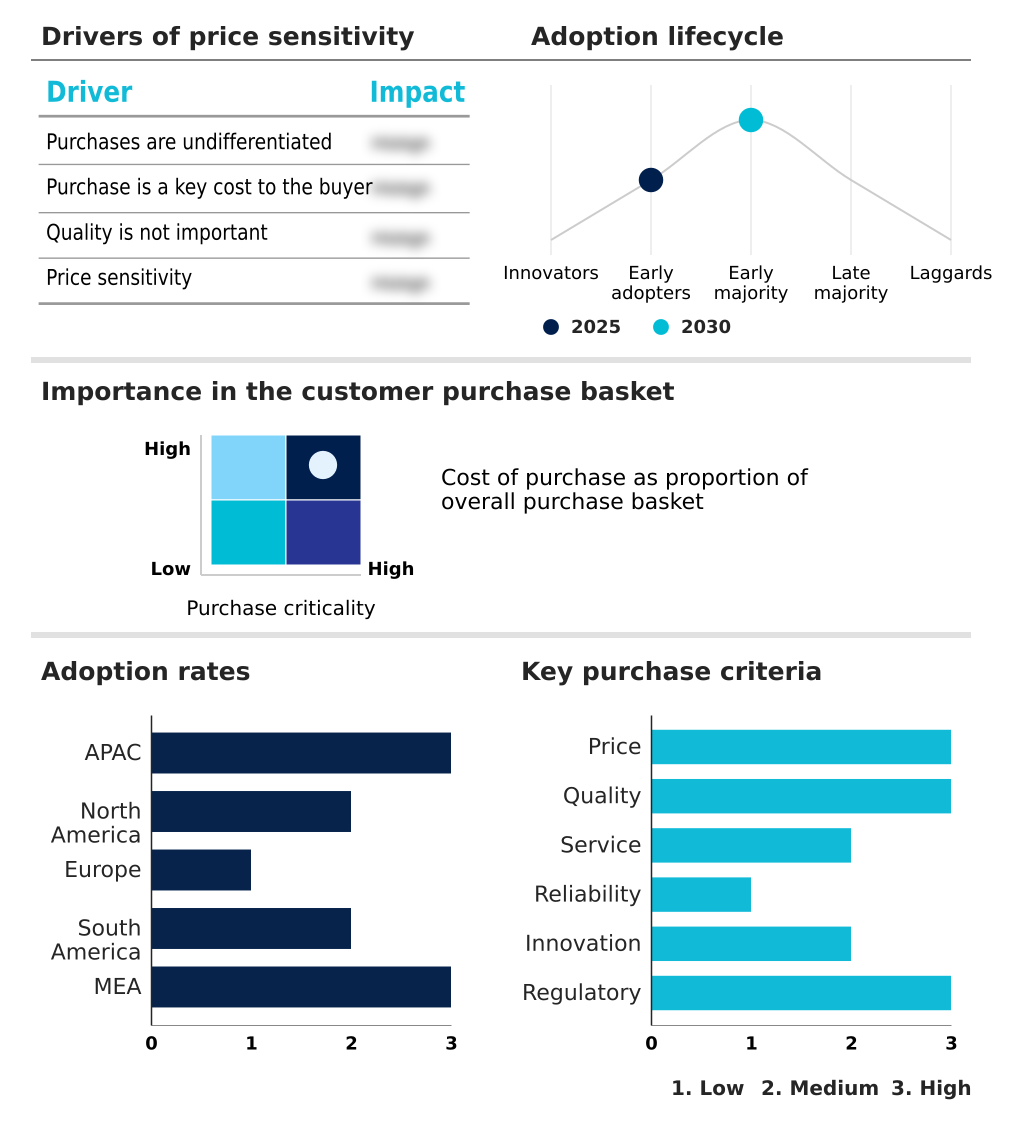
Customer Landscape of Edge AI Security Industry

Competitive Landscape

Companies are implementing various strategies, such as strategic alliances, edge ai security market forecast, partnerships, mergers and acquisitions, geographical expansion, and product/service launches, to enhance their presence in the industry.

Akamai Technologies Inc. - Key offerings feature AI-driven threat intelligence, zero-trust segmentation, and hardware-level security to protect decentralized AI workloads and distributed IoT environments across the network periphery.

The industry research and growth report includes detailed analyses of the competitive landscape of the market and information about key companies, including:

  • Akamai Technologies Inc.
  • Amazon.com Inc.
  • Arm Ltd.
  • Check Point Software Tech Ltd.
  • Cisco Systems Inc.
  • Cloudflare Inc.
  • CrowdStrike Inc.
  • Darktrace Holdings Ltd.
  • Dell Technologies Inc.
  • Fortinet Inc.
  • Google LLC
  • Hewlett Packard Enterprise Co.
  • Intel Corp.
  • Microsoft Corp.
  • Nozomi Networks Inc.
  • NVIDIA Corp.
  • Palo Alto Networks Inc.
  • Renesas Electronics Corp.
  • Sentinelone Inc.
  • Vectra AI Inc.
  • ZEDEDA Inc.

Qualitative and quantitative analysis of companies has been conducted to help clients understand the wider business environment as well as the strengths and weaknesses of key industry players. Data is qualitatively analyzed to categorize companies as pure play, category-focused, industry-focused, and diversified; it is quantitatively analyzed to categorize companies as dominant, leading, strong, tentative, and weak.

Market Intelligence Radar: High-Impact Developments & Growth Signals

  • In the Application Software industry, the pervasive shift to subscription-based SaaS delivery models has created a need for continuous, automated security validation, directly increasing demand for cloud-managed edge AI security platforms that can orchestrate policies across thousands of endpoints.
  • The rising automation of business processes through RPA and BPM tools has expanded the attack surface to include automated software agents, driving the need for edge AI security that can perform real-time behavioral analysis and anomaly detection to protect these autonomous workflows.
  • Heightened data security concerns and stringent regulations like GDPR have forced a pivot towards privacy-preserving architectures, fueling demand for edge AI security solutions featuring federated learning and on-device processing to ensure digital sovereignty and compliance.
  • The increased availability of open-source applications has lowered entry barriers but also introduced new supply chain vulnerabilities, creating a market for security-by-design tools that can perform code integrity checks and validate software components at the point of deployment.

Dive into Technavio’s robust research methodology, blending expert interviews, extensive data synthesis, and validated models for unparalleled Edge AI Security Market insights. See full methodology.

Market Scope
Page number 314
Base year 2025
Historic period 2020-2024
Forecast period 2026-2030
Growth momentum & CAGR Accelerate at a CAGR of 42.3%
Market growth 2026-2030 USD 20347.8 million
Market structure Fragmented
YoY growth 2025-2026(%) 31.8%
Key countries China, Japan, India, South Korea, Australia, Indonesia, US, Canada, Mexico, Germany, UK, France, Italy, Spain, The Netherlands, Brazil, Argentina, Chile, Saudi Arabia, UAE, South Africa, Turkey and Israel
Competitive landscape Leading Companies, Market Positioning of Companies, Competitive Strategies, and Industry Risks

Request Free Sample

Research Analyst Overview

  • The edge AI security market ecosystem is a complex interplay of stakeholders, initiated by silicon designers and IP core providers like Arm Ltd., which supply the fundamental hardware root of trust. On top of this foundation, cybersecurity vendors, cloud hyperscalers, and specialized software companies build platforms for on-device inference and threat detection.
  • These solutions are distributed through direct sales and channel partners to end-users in critical sectors such as industrial automation, automotive, and healthcare, which together represent over 60% of the market. Regulatory bodies and standards organizations influence development by mandating compliance with data sovereignty and privacy laws.
  • The value chain is supported by research institutions that drive innovation in areas like post-quantum cryptography and federated learning, ensuring the ecosystem evolves to counter emerging threats. This collaborative structure enables the delivery of integrated security from the chip to the cloud.

What are the Key Data Covered in this Edge AI Security Market Research and Growth Report?

  • What is the expected growth of the Edge AI Security Market between 2026 and 2030?

    • The Edge AI Security Market is expected to grow by USD 20.35 billion during 2026-2030, registering a CAGR of 42.3%. Year-over-year growth in 2026 is estimated at 31.8%%. This acceleration is shaped by strategic mainstreaming of tinyml and real-time threat detection, which is intensifying demand across multiple end-use verticals covered in the report.

  • What segmentation does the market report cover?

    • The report is segmented by Deployment (On-premises, Cloud-based, and Hybrid), Type (Network security, Endpoint security, Data security, Application security, and Cloud-edge security), Application (Real-time threat detection, Secure autonomous systems, Smart surveillance, Fraud prevention, and Critical infrastructure protection) and Geography (APAC, North America, Europe, South America, Middle East and Africa). Among these, the On-premises segment is estimated to witness significant growth during the forecast period, driven by rising adoption across key application areas. Each segment includes detailed qualitative and quantitative analysis, along with historical data from 2020-2024 and forecasts through 2030 with year-over-year growth rates.

  • Which regions are analyzed in the report?

    • The report covers APAC, North America, Europe, South America and Middle East and Africa. APAC is estimated to contribute 33.5% to market growth during the forecast period. Country-level analysis includes China, Japan, India, South Korea, Australia, Indonesia, US, Canada, Mexico, Germany, UK, France, Italy, Spain, The Netherlands, Brazil, Argentina, Chile, Saudi Arabia, UAE, South Africa, Turkey and Israel, with dedicated market size tables and year-over-year growth for each.

  • What are the key growth drivers and market challenges?

    • The primary driver is strategic mainstreaming of tinyml and real-time threat detection, which is accelerating investment and industry demand. The main challenge is intensification of distributed endpoint vulnerabilities and physical tampering risks, creating operational barriers for key market participants. The report quantifies the impact of each driver and challenge across 2026 and 2030 with comparative analysis.

  • Who are the major players in the Edge AI Security Market?

    • Key vendors include Akamai Technologies Inc., Amazon.com Inc., Arm Ltd., Check Point Software Tech Ltd., Cisco Systems Inc., Cloudflare Inc., CrowdStrike Inc., Darktrace Holdings Ltd., Dell Technologies Inc., Fortinet Inc., Google LLC, Hewlett Packard Enterprise Co., Intel Corp., Microsoft Corp., Nozomi Networks Inc., NVIDIA Corp., Palo Alto Networks Inc., Renesas Electronics Corp., Sentinelone Inc., Vectra AI Inc. and ZEDEDA Inc.. The report provides qualitative and quantitative analysis categorizing companies as dominant, leading, strong, tentative, and weak based on their market positioning. Company profiles include business segment analysis, SWOT assessment, key offerings, and recent strategic developments.

Market Research Insights

  • The competitive landscape for edge AI security is shaped by a convergence of hardware and software expertise, with the top five vendors accounting for over 45% of the market. Key companies like NVIDIA Corp. and Intel Corp. are embedding security features directly into silicon, launching hardware-level accelerators and new processors that integrate trusted execution environments.
  • In response, cybersecurity leaders such as Palo Alto Networks Inc. and Cisco Systems Inc. are expanding their SASE and AI Defense solutions to govern agentic AI interactions at the network edge, a market segment growing by nearly 40% annually. These developments directly address enterprise demand for unified security across hybrid cloud environments.
  • However, vendors face the persistent challenge of adapting to post-quantum cryptography standards, requiring continuous R&D investment to ensure long-term platform resiliency against future threats.

We can help! Our analysts can customize this edge ai security market research report to meet your requirements.

Get in touch

1. Executive Summary

1.1 Market overview

Executive Summary - Chart on Market Overview
Executive Summary - Data Table on Market Overview
Executive Summary - Chart on Global Market Characteristics
Executive Summary - Chart on Market by Geography
Executive Summary - Chart on Market Segmentation by Deployment
Executive Summary - Chart on Market Segmentation by Type
Executive Summary - Chart on Market Segmentation by Application
Executive Summary - Chart on Incremental Growth
Executive Summary - Data Table on Incremental Growth
Executive Summary - Chart on Company Market Positioning

2. Technavio Analysis

2.1 Analysis of price sensitivity, lifecycle, customer purchase basket, adoption rates, and purchase criteria

2.2 Criticality of inputs and Factors of differentiation

Chart on Overview on criticality of inputs and factors of differentiation

2.3 Factors of disruption

Chart on Overview on factors of disruption

2.4 Impact of drivers and challenges

Chart on Impact of drivers and challenges in 2025 and 2030

3. Market Landscape

3.1 Market ecosystem

Chart on Parent Market
Data Table on - Parent Market

3.2 Market characteristics

Chart on Market characteristics analysis

3.3 Value chain analysis

Chart on Value chain analysis

4. Market Sizing

4.1 Market definition

Data Table on Offerings of companies included in the market definition

4.2 Market segment analysis

Market segments

4.3 Market size 2025

4.4 Market outlook: Forecast for 2025-2030

Chart on Global - Market size and forecast 2025-2030 ($ million)
Data Table on Global - Market size and forecast 2025-2030 ($ million)
Chart on Global Market: Year-over-year growth 2025-2030 (%)
Data Table on Global Market: Year-over-year growth 2025-2030 (%)

5. Historic Market Size

5.1 Global Edge AI Security Market 2020 - 2024

Historic Market Size - Data Table on Global Edge AI Security Market 2020 - 2024 ($ million)

5.2 Deployment segment analysis 2020 - 2024

Historic Market Size - Deployment Segment 2020 - 2024 ($ million)

5.3 Type segment analysis 2020 - 2024

Historic Market Size - Type Segment 2020 - 2024 ($ million)

5.4 Application segment analysis 2020 - 2024

Historic Market Size - Application Segment 2020 - 2024 ($ million)

5.5 Geography segment analysis 2020 - 2024

Historic Market Size - Geography Segment 2020 - 2024 ($ million)

5.6 Country segment analysis 2020 - 2024

Historic Market Size - Country Segment 2020 - 2024 ($ million)

6. Qualitative Analysis

6.1 Impact of geopolitical conflict for global edge AI security market

7. Five Forces Analysis

7.1 Five forces summary

Five forces analysis - Comparison between 2025 and 2030

7.2 Bargaining power of buyers

Bargaining power of buyers - Impact of key factors 2025 and 2030

7.3 Bargaining power of suppliers

Bargaining power of suppliers - Impact of key factors in 2025 and 2030

7.4 Threat of new entrants

Threat of new entrants - Impact of key factors in 2025 and 2030

7.5 Threat of substitutes

Threat of substitutes - Impact of key factors in 2025 and 2030

7.6 Threat of rivalry

Threat of rivalry - Impact of key factors in 2025 and 2030

7.7 Market condition

Chart on Market condition - Five forces 2025 and 2030

8. Market Segmentation by Deployment

8.1 Market segments

Chart on Deployment - Market share 2025-2030 (%)
Data Table on Deployment - Market share 2025-2030 (%)

8.2 Comparison by Deployment

Chart on Comparison by Deployment
Data Table on Comparison by Deployment

8.3 On-premises - Market size and forecast 2025-2030

Chart on On-premises - Market size and forecast 2025-2030 ($ million)
Data Table on On-premises - Market size and forecast 2025-2030 ($ million)
Chart on On-premises - Year-over-year growth 2025-2030 (%)
Data Table on On-premises - Year-over-year growth 2025-2030 (%)

8.4 Cloud-based - Market size and forecast 2025-2030

Chart on Cloud-based - Market size and forecast 2025-2030 ($ million)
Data Table on Cloud-based - Market size and forecast 2025-2030 ($ million)
Chart on Cloud-based - Year-over-year growth 2025-2030 (%)
Data Table on Cloud-based - Year-over-year growth 2025-2030 (%)

8.5 Hybrid - Market size and forecast 2025-2030

Chart on Hybrid - Market size and forecast 2025-2030 ($ million)
Data Table on Hybrid - Market size and forecast 2025-2030 ($ million)
Chart on Hybrid - Year-over-year growth 2025-2030 (%)
Data Table on Hybrid - Year-over-year growth 2025-2030 (%)

8.6 Market opportunity by Deployment

Market opportunity by Deployment ($ million)
Data Table on Market opportunity by Deployment ($ million)

9. Market Segmentation by Type

9.1 Market segments

Chart on Type - Market share 2025-2030 (%)
Data Table on Type - Market share 2025-2030 (%)

9.2 Comparison by Type

Chart on Comparison by Type
Data Table on Comparison by Type

9.3 Network security - Market size and forecast 2025-2030

Chart on Network security - Market size and forecast 2025-2030 ($ million)
Data Table on Network security - Market size and forecast 2025-2030 ($ million)
Chart on Network security - Year-over-year growth 2025-2030 (%)
Data Table on Network security - Year-over-year growth 2025-2030 (%)

9.4 Endpoint security - Market size and forecast 2025-2030

Chart on Endpoint security - Market size and forecast 2025-2030 ($ million)
Data Table on Endpoint security - Market size and forecast 2025-2030 ($ million)
Chart on Endpoint security - Year-over-year growth 2025-2030 (%)
Data Table on Endpoint security - Year-over-year growth 2025-2030 (%)

9.5 Data security - Market size and forecast 2025-2030

Chart on Data security - Market size and forecast 2025-2030 ($ million)
Data Table on Data security - Market size and forecast 2025-2030 ($ million)
Chart on Data security - Year-over-year growth 2025-2030 (%)
Data Table on Data security - Year-over-year growth 2025-2030 (%)

9.6 Application security - Market size and forecast 2025-2030

Chart on Application security - Market size and forecast 2025-2030 ($ million)
Data Table on Application security - Market size and forecast 2025-2030 ($ million)
Chart on Application security - Year-over-year growth 2025-2030 (%)
Data Table on Application security - Year-over-year growth 2025-2030 (%)

9.7 Cloud-edge security - Market size and forecast 2025-2030

Chart on Cloud-edge security - Market size and forecast 2025-2030 ($ million)
Data Table on Cloud-edge security - Market size and forecast 2025-2030 ($ million)
Chart on Cloud-edge security - Year-over-year growth 2025-2030 (%)
Data Table on Cloud-edge security - Year-over-year growth 2025-2030 (%)

9.8 Market opportunity by Type

Market opportunity by Type ($ million)
Data Table on Market opportunity by Type ($ million)

10. Market Segmentation by Application

10.1 Market segments

Chart on Application - Market share 2025-2030 (%)
Data Table on Application - Market share 2025-2030 (%)

10.2 Comparison by Application

Chart on Comparison by Application
Data Table on Comparison by Application

10.3 Real-time threat detection - Market size and forecast 2025-2030

Chart on Real-time threat detection - Market size and forecast 2025-2030 ($ million)
Data Table on Real-time threat detection - Market size and forecast 2025-2030 ($ million)
Chart on Real-time threat detection - Year-over-year growth 2025-2030 (%)
Data Table on Real-time threat detection - Year-over-year growth 2025-2030 (%)

10.4 Secure autonomous systems - Market size and forecast 2025-2030

Chart on Secure autonomous systems - Market size and forecast 2025-2030 ($ million)
Data Table on Secure autonomous systems - Market size and forecast 2025-2030 ($ million)
Chart on Secure autonomous systems - Year-over-year growth 2025-2030 (%)
Data Table on Secure autonomous systems - Year-over-year growth 2025-2030 (%)

10.5 Smart surveillance - Market size and forecast 2025-2030

Chart on Smart surveillance - Market size and forecast 2025-2030 ($ million)
Data Table on Smart surveillance - Market size and forecast 2025-2030 ($ million)
Chart on Smart surveillance - Year-over-year growth 2025-2030 (%)
Data Table on Smart surveillance - Year-over-year growth 2025-2030 (%)

10.6 Fraud prevention - Market size and forecast 2025-2030

Chart on Fraud prevention - Market size and forecast 2025-2030 ($ million)
Data Table on Fraud prevention - Market size and forecast 2025-2030 ($ million)
Chart on Fraud prevention - Year-over-year growth 2025-2030 (%)
Data Table on Fraud prevention - Year-over-year growth 2025-2030 (%)

10.7 Critical infrastructure protection - Market size and forecast 2025-2030

Chart on Critical infrastructure protection - Market size and forecast 2025-2030 ($ million)
Data Table on Critical infrastructure protection - Market size and forecast 2025-2030 ($ million)
Chart on Critical infrastructure protection - Year-over-year growth 2025-2030 (%)
Data Table on Critical infrastructure protection - Year-over-year growth 2025-2030 (%)

10.8 Market opportunity by Application

Market opportunity by Application ($ million)
Data Table on Market opportunity by Application ($ million)

11. Customer Landscape

11.1 Customer landscape overview

Analysis of price sensitivity, lifecycle, customer purchase basket, adoption rates, and purchase criteria

12. Geographic Landscape

12.1 Geographic segmentation

Chart on Market share by geography 2025-2030 (%)
Data Table on Market share by geography 2025-2030 (%)

12.2 Geographic comparison

Chart on Geographic comparison
Data Table on Geographic comparison

12.3 APAC - Market size and forecast 2025-2030

Chart on APAC - Market size and forecast 2025-2030 ($ million)
Data Table on APAC - Market size and forecast 2025-2030 ($ million)
Chart on APAC - Year-over-year growth 2025-2030 (%)
Data Table on APAC - Year-over-year growth 2025-2030 (%)
Chart on Regional Comparison - APAC
Data Table on Regional Comparison - APAC

12.3.1 China - Market size and forecast 2025-2030

Chart on China - Market size and forecast 2025-2030 ($ million)
Data Table on China - Market size and forecast 2025-2030 ($ million)
Chart on China - Year-over-year growth 2025-2030 (%)
Data Table on China - Year-over-year growth 2025-2030 (%)

12.3.2 Japan - Market size and forecast 2025-2030

Chart on Japan - Market size and forecast 2025-2030 ($ million)
Data Table on Japan - Market size and forecast 2025-2030 ($ million)
Chart on Japan - Year-over-year growth 2025-2030 (%)
Data Table on Japan - Year-over-year growth 2025-2030 (%)

12.3.3 India - Market size and forecast 2025-2030

Chart on India - Market size and forecast 2025-2030 ($ million)
Data Table on India - Market size and forecast 2025-2030 ($ million)
Chart on India - Year-over-year growth 2025-2030 (%)
Data Table on India - Year-over-year growth 2025-2030 (%)

12.3.4 South Korea - Market size and forecast 2025-2030

Chart on South Korea - Market size and forecast 2025-2030 ($ million)
Data Table on South Korea - Market size and forecast 2025-2030 ($ million)
Chart on South Korea - Year-over-year growth 2025-2030 (%)
Data Table on South Korea - Year-over-year growth 2025-2030 (%)

12.3.5 Australia - Market size and forecast 2025-2030

Chart on Australia - Market size and forecast 2025-2030 ($ million)
Data Table on Australia - Market size and forecast 2025-2030 ($ million)
Chart on Australia - Year-over-year growth 2025-2030 (%)
Data Table on Australia - Year-over-year growth 2025-2030 (%)

12.3.6 Indonesia - Market size and forecast 2025-2030

Chart on Indonesia - Market size and forecast 2025-2030 ($ million)
Data Table on Indonesia - Market size and forecast 2025-2030 ($ million)
Chart on Indonesia - Year-over-year growth 2025-2030 (%)
Data Table on Indonesia - Year-over-year growth 2025-2030 (%)

12.4 North America - Market size and forecast 2025-2030

Chart on North America - Market size and forecast 2025-2030 ($ million)
Data Table on North America - Market size and forecast 2025-2030 ($ million)
Chart on North America - Year-over-year growth 2025-2030 (%)
Data Table on North America - Year-over-year growth 2025-2030 (%)
Chart on Regional Comparison - North America
Data Table on Regional Comparison - North America

12.4.1 US - Market size and forecast 2025-2030

Chart on US - Market size and forecast 2025-2030 ($ million)
Data Table on US - Market size and forecast 2025-2030 ($ million)
Chart on US - Year-over-year growth 2025-2030 (%)
Data Table on US - Year-over-year growth 2025-2030 (%)

12.4.2 Canada - Market size and forecast 2025-2030

Chart on Canada - Market size and forecast 2025-2030 ($ million)
Data Table on Canada - Market size and forecast 2025-2030 ($ million)
Chart on Canada - Year-over-year growth 2025-2030 (%)
Data Table on Canada - Year-over-year growth 2025-2030 (%)

12.4.3 Mexico - Market size and forecast 2025-2030

Chart on Mexico - Market size and forecast 2025-2030 ($ million)
Data Table on Mexico - Market size and forecast 2025-2030 ($ million)
Chart on Mexico - Year-over-year growth 2025-2030 (%)
Data Table on Mexico - Year-over-year growth 2025-2030 (%)

12.5 Europe - Market size and forecast 2025-2030

Chart on Europe - Market size and forecast 2025-2030 ($ million)
Data Table on Europe - Market size and forecast 2025-2030 ($ million)
Chart on Europe - Year-over-year growth 2025-2030 (%)
Data Table on Europe - Year-over-year growth 2025-2030 (%)
Chart on Regional Comparison - Europe
Data Table on Regional Comparison - Europe

12.5.1 Germany - Market size and forecast 2025-2030

Chart on Germany - Market size and forecast 2025-2030 ($ million)
Data Table on Germany - Market size and forecast 2025-2030 ($ million)
Chart on Germany - Year-over-year growth 2025-2030 (%)
Data Table on Germany - Year-over-year growth 2025-2030 (%)

12.5.2 UK - Market size and forecast 2025-2030

Chart on UK - Market size and forecast 2025-2030 ($ million)
Data Table on UK - Market size and forecast 2025-2030 ($ million)
Chart on UK - Year-over-year growth 2025-2030 (%)
Data Table on UK - Year-over-year growth 2025-2030 (%)

12.5.3 France - Market size and forecast 2025-2030

Chart on France - Market size and forecast 2025-2030 ($ million)
Data Table on France - Market size and forecast 2025-2030 ($ million)
Chart on France - Year-over-year growth 2025-2030 (%)
Data Table on France - Year-over-year growth 2025-2030 (%)

12.5.4 Italy - Market size and forecast 2025-2030

Chart on Italy - Market size and forecast 2025-2030 ($ million)
Data Table on Italy - Market size and forecast 2025-2030 ($ million)
Chart on Italy - Year-over-year growth 2025-2030 (%)
Data Table on Italy - Year-over-year growth 2025-2030 (%)

12.5.5 Spain - Market size and forecast 2025-2030

Chart on Spain - Market size and forecast 2025-2030 ($ million)
Data Table on Spain - Market size and forecast 2025-2030 ($ million)
Chart on Spain - Year-over-year growth 2025-2030 (%)
Data Table on Spain - Year-over-year growth 2025-2030 (%)

12.5.6 The Netherlands - Market size and forecast 2025-2030

Chart on The Netherlands - Market size and forecast 2025-2030 ($ million)
Data Table on The Netherlands - Market size and forecast 2025-2030 ($ million)
Chart on The Netherlands - Year-over-year growth 2025-2030 (%)
Data Table on The Netherlands - Year-over-year growth 2025-2030 (%)

12.6 South America - Market size and forecast 2025-2030

Chart on South America - Market size and forecast 2025-2030 ($ million)
Data Table on South America - Market size and forecast 2025-2030 ($ million)
Chart on South America - Year-over-year growth 2025-2030 (%)
Data Table on South America - Year-over-year growth 2025-2030 (%)
Chart on Regional Comparison - South America
Data Table on Regional Comparison - South America

12.6.1 Brazil - Market size and forecast 2025-2030

Chart on Brazil - Market size and forecast 2025-2030 ($ million)
Data Table on Brazil - Market size and forecast 2025-2030 ($ million)
Chart on Brazil - Year-over-year growth 2025-2030 (%)
Data Table on Brazil - Year-over-year growth 2025-2030 (%)

12.6.2 Argentina - Market size and forecast 2025-2030

Chart on Argentina - Market size and forecast 2025-2030 ($ million)
Data Table on Argentina - Market size and forecast 2025-2030 ($ million)
Chart on Argentina - Year-over-year growth 2025-2030 (%)
Data Table on Argentina - Year-over-year growth 2025-2030 (%)

12.6.3 Chile - Market size and forecast 2025-2030

Chart on Chile - Market size and forecast 2025-2030 ($ million)
Data Table on Chile - Market size and forecast 2025-2030 ($ million)
Chart on Chile - Year-over-year growth 2025-2030 (%)
Data Table on Chile - Year-over-year growth 2025-2030 (%)

12.7 Middle East and Africa - Market size and forecast 2025-2030

Chart on Middle East and Africa - Market size and forecast 2025-2030 ($ million)
Data Table on Middle East and Africa - Market size and forecast 2025-2030 ($ million)
Chart on Middle East and Africa - Year-over-year growth 2025-2030 (%)
Data Table on Middle East and Africa - Year-over-year growth 2025-2030 (%)
Chart on Regional Comparison - Middle East and Africa
Data Table on Regional Comparison - Middle East and Africa

12.7.1 Saudi Arabia - Market size and forecast 2025-2030

Chart on Saudi Arabia - Market size and forecast 2025-2030 ($ million)
Data Table on Saudi Arabia - Market size and forecast 2025-2030 ($ million)
Chart on Saudi Arabia - Year-over-year growth 2025-2030 (%)
Data Table on Saudi Arabia - Year-over-year growth 2025-2030 (%)

12.7.2 UAE - Market size and forecast 2025-2030

Chart on UAE - Market size and forecast 2025-2030 ($ million)
Data Table on UAE - Market size and forecast 2025-2030 ($ million)
Chart on UAE - Year-over-year growth 2025-2030 (%)
Data Table on UAE - Year-over-year growth 2025-2030 (%)

12.7.3 South Africa - Market size and forecast 2025-2030

Chart on South Africa - Market size and forecast 2025-2030 ($ million)
Data Table on South Africa - Market size and forecast 2025-2030 ($ million)
Chart on South Africa - Year-over-year growth 2025-2030 (%)
Data Table on South Africa - Year-over-year growth 2025-2030 (%)

12.7.4 Turkey - Market size and forecast 2025-2030

Chart on Turkey - Market size and forecast 2025-2030 ($ million)
Data Table on Turkey - Market size and forecast 2025-2030 ($ million)
Chart on Turkey - Year-over-year growth 2025-2030 (%)
Data Table on Turkey - Year-over-year growth 2025-2030 (%)

12.7.5 Israel - Market size and forecast 2025-2030

Chart on Israel - Market size and forecast 2025-2030 ($ million)
Data Table on Israel - Market size and forecast 2025-2030 ($ million)
Chart on Israel - Year-over-year growth 2025-2030 (%)
Data Table on Israel - Year-over-year growth 2025-2030 (%)

12.8 Market opportunity by geography

Market opportunity by geography ($ million)
Data Tables on Market opportunity by geography ($ million)

13. Drivers, Challenges, and Opportunity

13.1 Market drivers

Strategic mainstreaming of TinyML and real-time threat detection
Industrialization of privacy-preserving computing and local data sovereignty
Expansion of post-quantum cryptography and hardware resiliency

13.2 Market challenges

Intensification of distributed endpoint vulnerabilities and physical tampering risks
Escalation of regulatory enforcement and localized data sovereignty mandates
Persistence of human capital scarcity and specialized security engineering gaps

13.3 Impact of drivers and challenges

Impact of drivers and challenges in 2025 and 2030

13.4 Market opportunities

Institutionalization of hardware root of trust and silicon-level integrity
Proliferation of zero trust architecture and continuous edge verification
Expansion of predictive defense and AI-driven anomaly detection

14. Competitive Landscape

14.1 Overview

14.2

Overview on criticality of inputs and factors of differentiation

14.3 Landscape disruption

Overview on factors of disruption

14.4 Industry risks

Impact of key risks on business

15. Competitive Analysis

15.1 Companies profiled

Companies covered

15.2 Company ranking index

15.3 Market positioning of companies

Matrix on companies position and classification

15.4 Akamai Technologies Inc.

Akamai Technologies Inc. - Overview
Akamai Technologies Inc. - Business segments
Akamai Technologies Inc. - Key news
Akamai Technologies Inc. - Key offerings
Akamai Technologies Inc. - Segment focus
SWOT

15.5 Amazon.com Inc.

Amazon.com Inc. - Overview
Amazon.com Inc. - Business segments
Amazon.com Inc. - Key news
Amazon.com Inc. - Key offerings
Amazon.com Inc. - Segment focus
SWOT

15.6 Arm Ltd.

Arm Ltd. - Overview
Arm Ltd. - Product / Service
Arm Ltd. - Key offerings
SWOT

15.7 Check Point Software Tech Ltd.

Check Point Software Tech Ltd. - Overview
Check Point Software Tech Ltd. - Product / Service
Check Point Software Tech Ltd. - Key offerings
SWOT

15.8 Cisco Systems Inc.

Cisco Systems Inc. - Overview
Cisco Systems Inc. - Business segments
Cisco Systems Inc. - Key news
Cisco Systems Inc. - Key offerings
Cisco Systems Inc. - Segment focus
SWOT

15.9 Cloudflare Inc.

Cloudflare Inc. - Overview
Cloudflare Inc. - Product / Service
Cloudflare Inc. - Key offerings
SWOT

15.10 Dell Technologies Inc.

Dell Technologies Inc. - Overview
Dell Technologies Inc. - Business segments
Dell Technologies Inc. - Key news
Dell Technologies Inc. - Key offerings
Dell Technologies Inc. - Segment focus
SWOT

15.11 Fortinet Inc.

Fortinet Inc. - Overview
Fortinet Inc. - Business segments
Fortinet Inc. - Key offerings
Fortinet Inc. - Segment focus
SWOT

15.12 Google LLC

Google LLC - Overview
Google LLC - Product / Service
Google LLC - Key offerings
SWOT

15.13 Hewlett Packard Enterprise Co.

Hewlett Packard Enterprise Co. - Overview
Hewlett Packard Enterprise Co. - Business segments
Hewlett Packard Enterprise Co. - Key news
Hewlett Packard Enterprise Co. - Key offerings
Hewlett Packard Enterprise Co. - Segment focus
SWOT

15.14 Intel Corp.

Intel Corp. - Overview
Intel Corp. - Business segments
Intel Corp. - Key news
Intel Corp. - Key offerings
Intel Corp. - Segment focus
SWOT

15.15 Microsoft Corp.

Microsoft Corp. - Overview
Microsoft Corp. - Business segments
Microsoft Corp. - Key news
Microsoft Corp. - Key offerings
Microsoft Corp. - Segment focus
SWOT

15.16 NVIDIA Corp.

NVIDIA Corp. - Overview
NVIDIA Corp. - Business segments
NVIDIA Corp. - Key news
NVIDIA Corp. - Key offerings
NVIDIA Corp. - Segment focus
SWOT

15.17 Palo Alto Networks Inc.

Palo Alto Networks Inc. - Overview
Palo Alto Networks Inc. - Business segments
Palo Alto Networks Inc. - Key offerings
Palo Alto Networks Inc. - Segment focus
SWOT

15.18 Renesas Electronics Corp.

Renesas Electronics Corp. - Overview
Renesas Electronics Corp. - Business segments
Renesas Electronics Corp. - Key news
Renesas Electronics Corp. - Key offerings
Renesas Electronics Corp. - Segment focus
SWOT

16. Appendix

16.1 Scope of the report

Market definition
Objectives
Notes and caveats

16.2 Inclusions and exclusions checklist

Inclusions checklist
Exclusions checklist

16.3 Currency conversion rates for US$

16.4 Research methodology

16.5 Data procurement

Information sources

16.6 Data validation

16.7 Validation techniques employed for market sizing

16.8 Data synthesis

16.9 360 degree market analysis

16.10 List of abbreviations

Research Methodology

Technavio presents a detailed picture of the market by way of study, synthesis, and summation of data from multiple sources. The analysts have presented the various facets of the market with a particular focus on identifying the key industry influencers. The data thus presented is comprehensive, reliable, and the result of extensive research, both primary and secondary.

INFORMATION SOURCES

Primary sources

  • Manufacturers and suppliers
  • Channel partners
  • Industry experts
  • Strategic decision makers

Secondary sources

  • Industry journals and periodicals
  • Government data
  • Financial reports of key industry players
  • Historical data
  • Press releases

DATA ANALYSIS

Data Synthesis

  • Collation of data
  • Estimation of key figures
  • Analysis of derived insights

Data Validation

  • Triangulation with data models
  • Reference against proprietary databases
  • Corroboration with industry experts

REPORT WRITING

Qualitative

  • Market drivers
  • Market challenges
  • Market trends
  • Five forces analysis

Quantitative

  • Market size and forecast
  • Market segmentation
  • Geographical insights
  • Competitive landscape

Interested in this report?

Get your sample now to see our research methodology and insights!

Download Now

Frequently Asked Questions

Edge AI Security market growth will increase by USD 20347.8 million during 2026-2030.

The Edge AI Security market is expected to grow at a CAGR of 42.3% during 2026-2030.

Edge AI Security market is segmented by Deployment (On-premises, Cloud-based, Hybrid) Type (Network security, Endpoint security, Data security, Application security, Cloud-edge security) Application (Real-time threat detection, Secure autonomous systems, Smart surveillance, Fraud prevention, Critical infrastructure protection)

Akamai Technologies Inc., Amazon.com Inc., Arm Ltd., Check Point Software Tech Ltd., Cisco Systems Inc., Cloudflare Inc., CrowdStrike Inc., Darktrace Holdings Ltd., Dell Technologies Inc., Fortinet Inc., Google LLC, Hewlett Packard Enterprise Co., Intel Corp., Microsoft Corp., Nozomi Networks Inc., NVIDIA Corp., Palo Alto Networks Inc., Renesas Electronics Corp., Sentinelone Inc., Vectra AI Inc., ZEDEDA Inc. are a few of the key vendors in the Edge AI Security market.

APAC will register the highest growth rate of 33.5% among the other regions. Therefore, the Edge AI Security market in APAC is expected to garner significant business opportunities for the vendors during the forecast period.

China, Japan, India, South Korea, Australia, Indonesia, US, Canada, Mexico, Germany, UK, France, Italy, Spain, The Netherlands, Brazil, Argentina, Chile, Saudi Arabia, UAE, South Africa, Turkey, Israel

  • Strategic mainstreaming of TinyML and real-time threat detection is the driving factor this market.

The Edge AI Security market vendors should focus on grabbing business opportunities from the Deployment segment as it accounted for the largest market share in the base year.
RIA - Research AI Assistant
Ask RIA