Edible Fungi Market Analysis, Size, and Forecast 2026-2030: Europe (Germany, France, and UK), APAC (China, Japan, and India), North America (US, Canada, and Mexico), South America (Brazil, Argentina, and Colombia), Middle East and Africa (South Africa, Saudi Arabia, and UAE), and Rest of World (ROW)

Edible Fungi Market Analysis, Size, and Forecast 2026-2030:
Europe (Germany, France, and UK), APAC (China, Japan, and India), North America (US, Canada, and Mexico), South America (Brazil, Argentina, and Colombia), Middle East and Africa (South Africa, Saudi Arabia, and UAE), and Rest of World (ROW)

Published: Apr 2026 303 Pages SKU: IRTNTR81424

Market Overview at a Glance

$26.04 B
Market Opportunity
7.5%
CAGR 2025 - 2030
42.1%
APAC Growth
$23.86 B
Button mushroom segment 2024

Edible Fungi Market Size 2026-2030

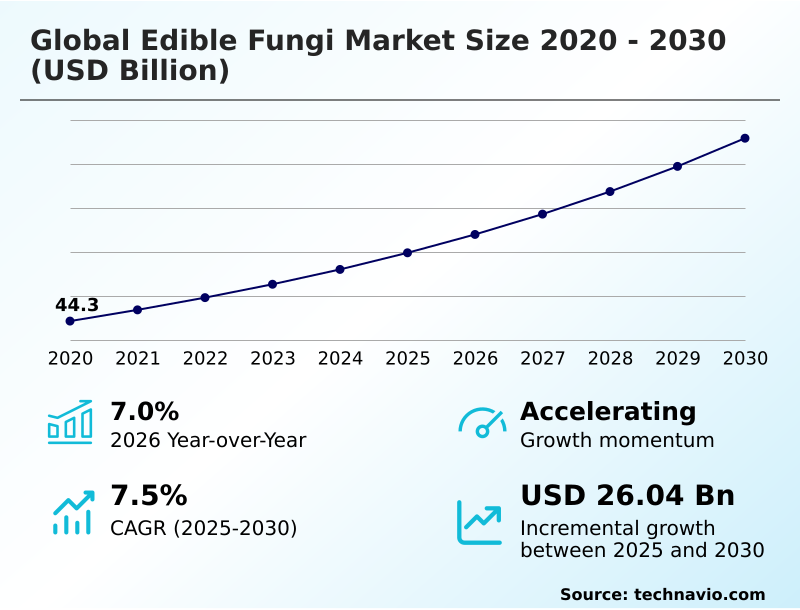
The edible fungi market size is valued to increase by USD 26.04 billion, at a CAGR of 7.5% from 2025 to 2030. Increasing consumer demand for plant-based and alternative protein sources will drive the edible fungi market.

Major Market Trends & Insights

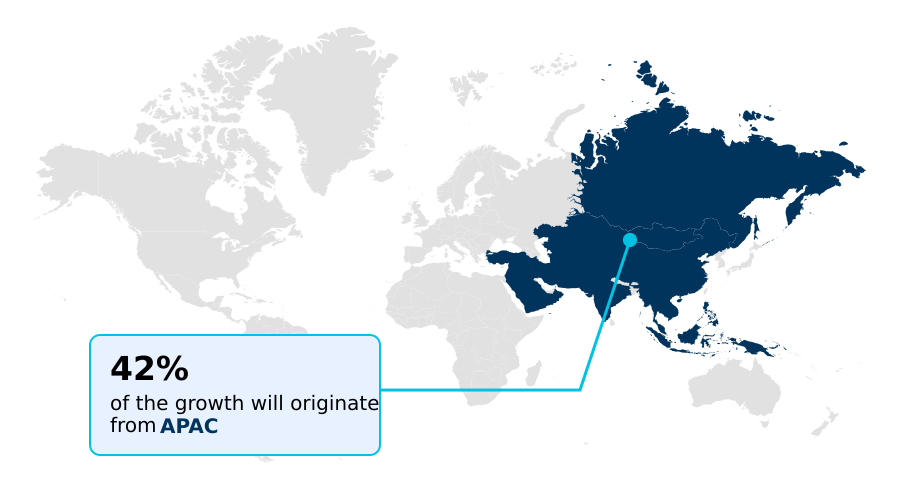
  • APAC dominated the market and accounted for a 42.1% growth during the forecast period.
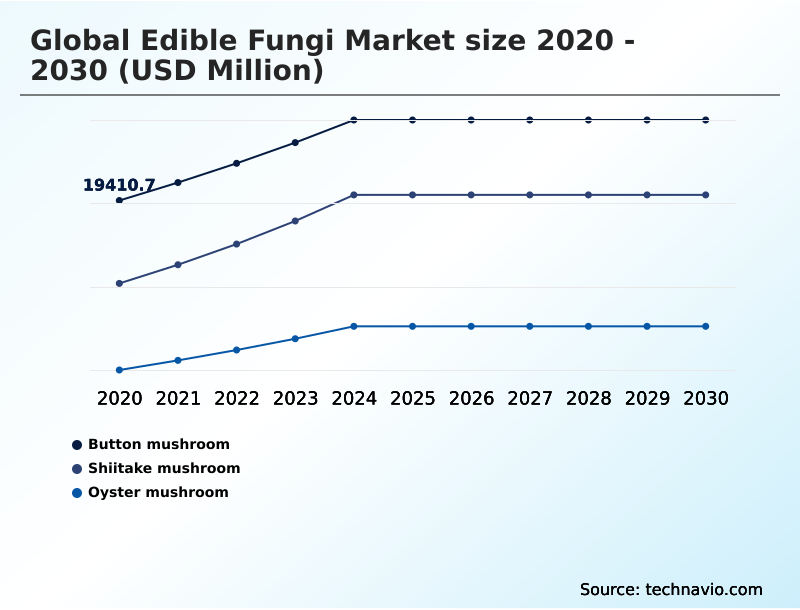
  • By Product - Button mushroom segment was valued at USD 23.86 billion in 2024
  • By End-user - Household consumption segment accounted for the largest market revenue share in 2024

Market Size & Forecast

  • Market Opportunities: USD 41.56 billion
  • Market Future Opportunities: USD 26.04 billion
  • CAGR from 2025 to 2030 : 7.5%

Market Summary

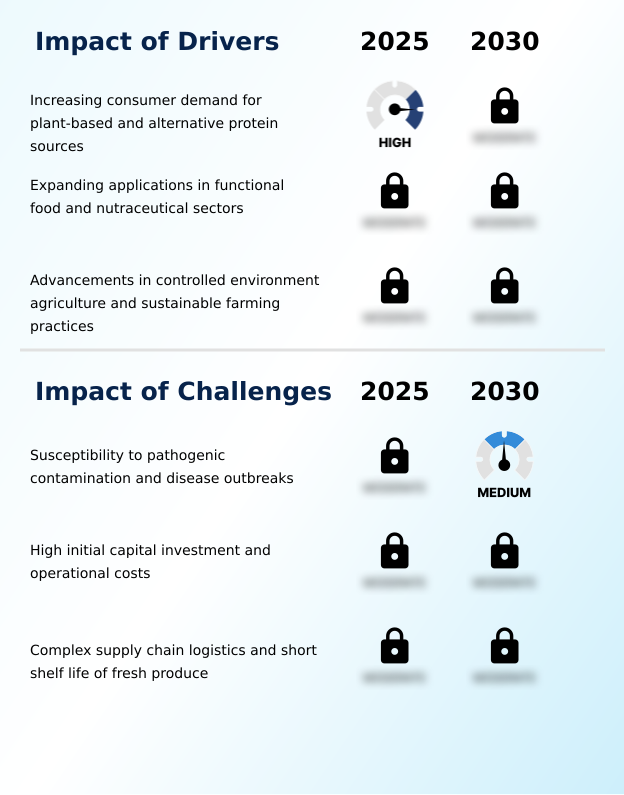
  • The edible fungi market is undergoing substantial expansion, propelled by evolving dietary habits and a heightened focus on wellness. A significant driver is the consumer shift toward plant-based diets, where fungi serve as a nutrient-rich meat alternative. This demand is met by advancements in controlled environment agriculture, which allow for year-round, high-yield production.
  • Innovations in cultivation are paralleled by the market's expansion into new sectors, such as nutraceutical formulation, where mushroom extracts are valued for their health-promoting properties. However, the industry contends with significant logistical hurdles.
  • For instance, a food processor aiming to secure a consistent supply of a specific mushroom variety for a new product line must navigate challenges related to the produce's short shelf life and the need for a resilient, temperature-controlled supply chain.
  • This requires strategic partnerships with growers who can guarantee quality and delivery schedules, highlighting the operational complexities that companies must manage to capitalize on market opportunities. The market's trajectory is shaped by this interplay between strong consumer demand, technological progress, and persistent operational challenges.

What will be the Size of the Edible Fungi Market during the forecast period?

Get Key Insights on Market Forecast (PDF) Request Free Sample

How is the Edible Fungi Market Segmented?

The edible fungi industry research report provides comprehensive data (region-wise segment analysis), with forecasts and estimates in "USD million" for the period 2026-2030, as well as historical data from 2020-2024 for the following segments.

  • Product
    • Button mushroom
    • Shiitake mushroom
    • Oyster mushroom
  • End-user
    • Household consumption
    • Food service
    • Nutraceutical and pharmaceutical
    • Cosmetics and personal care
  • Type
    • Fresh mushroom
    • Dried mushroom
    • Canned mushroom
  • Geography
    • Europe
      • Germany
      • France
      • UK
    • APAC
      • China
      • Japan
      • India
    • North America
      • US
      • Canada
      • Mexico
    • South America
      • Brazil
      • Argentina
      • Colombia
    • Middle East and Africa
      • South Africa
      • Saudi Arabia
      • UAE
    • Rest of World (ROW)

By Product Insights

The button mushroom segment is estimated to witness significant growth during the forecast period.

The button mushroom maintains its market dominance through highly optimized cultivation, making it a cornerstone of sustainable food systems.

Its mild umami flavor profile makes it an ideal plant-based protein alternative, driving consistent consumer purchasing behavior and strong food service industry demand. To meet this, producers rely on advanced sterile tissue culture and a rigorous substrate sterilization protocol.

The mainstream retail expansion is supported by sophisticated supply chain optimization and cold chain logistics to manage post-harvest loss reduction.

For instance, the deployment of automated picking systems guided by environmental sensor data analysis has reduced mechanical damage during harvesting by 15%, ensuring higher quality produce reaches consumers.

Request Free Sample

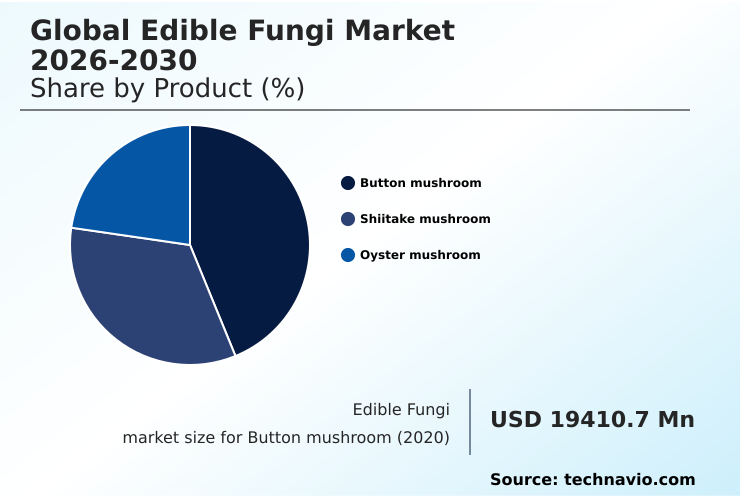
The Button mushroom segment was valued at USD 23.86 billion in 2024 and showed a gradual increase during the forecast period.

Request Free Sample

Regional Analysis

APAC is estimated to contribute 42.1% to the growth of the global market during the forecast period.Technavio’s analysts have elaborately explained the regional trends and drivers that shape the market during the forecast period.

See How Edible Fungi Market Demand is Rising in APAC Request Free Sample

The Asia-Pacific region, contributing 42% of the market's incremental growth, is a dominant force, driven by large-scale production and high consumer demand for alternative protein sources.

This region is a leader in advancing circular economy agriculture through innovations in liquid spawn production and bioactive compound extraction for dermatological applications.

In contrast, Europe and North America focus on high-tech controlled environment agriculture to ensure pathogenic contamination control and meet stringent quality standards for the food service industry.

These regions leverage machine learning growth prediction, which improves yield forecasting by over 25%, and advanced micro-perforated film technology to extend product freshness.

Growing environmental sustainability awareness is also fueling demand in emerging markets, where exotic fungi cultivation is expanding to cater to shifting consumer purchasing behavior and an interest in clean beauty ingredients.

Market Dynamics

Our researchers analyzed the data with 2025 as the base year, along with the key drivers, trends, and challenges. A holistic analysis of drivers will help companies refine their marketing strategies to gain a competitive advantage.

  • Analyzing the edible fungi market growth in APAC reveals a landscape ripe with opportunity, though not without hurdles. The benefits of edible fungi in nutraceuticals are a primary catalyst, with significant research into the bioactive compounds in medicinal mushrooms. Concurrently, the impact of robotics on mushroom harvesting is reshaping commercial button mushroom farming techniques through advancements in mushroom spawn technology.
  • However, challenges in the fresh mushroom supply chain persist, primarily concerning how to optimize logistics for perishable fungi. The high investment costs for vertical mushroom farming are a barrier for new entrants, yet the role of fungi in the circular economy, supported by sustainable mushroom cultivation practices, presents a compelling business case.
  • Controlling contamination in fungi cultivation remains a critical operational focus. On the demand side, growth drivers for plant-based fungi protein are strong, with edible fungi as meat substitutes gaining mainstream acceptance. This is reflected in consumer trends in gourmet mushroom consumption, which are creating market opportunities for exotic fungi, especially in categories like edible fungi for cosmetics and skincare.
  • The comparison of oyster vs shiitake mushroom cultivation often centers on yield and market price. To capitalize on these dynamics, businesses use smart packaging for extending shelf life, a strategy that delivers operational efficiencies nearly double those of traditional methods, directly addressing the regulatory landscape for functional mushrooms.

What are the key market drivers leading to the rise in the adoption of Edible Fungi Industry?

  • The primary market driver is the increasing consumer demand for plant-based and alternative protein sources, fueled by shifting dietary preferences toward healthier and more sustainable options.

  • The market is propelled by strong consumer demand for plant-based dietary shift and a heightened focus on environmental sustainability.
  • Sustainable cultivation techniques are central to this trend, with vertical farming methodology increasing yield per square foot by over 300% compared to traditional approaches.
  • The use of upcycled agricultural waste, such as agricultural byproduct substrate, can lower raw material costs by up to 50%, contributing to a reduced carbon footprint.
  • Beyond their culinary appeal, the pharmacological properties of fungi are driving growth in preventative health supplements and nutraceutical formulation.
  • As consumers embrace experiential dining trends and culinary exploration, smart packaging solutions with features like time-temperature indicators are becoming essential for ensuring product quality and safety from farm to table.

What are the market trends shaping the Edible Fungi Industry?

  • A key market trend involves the integration of robotics and artificial intelligence into harvesting operations. This technological shift addresses labor challenges and enhances operational efficiency.

  • Key trends are reshaping the edible fungi market, driven by technological adoption and diversification into high-value sectors. The mainstream retail expansion of fungi is supported by innovations that ensure quality, such as advanced mycelium spawn inoculation for controlled fruiting body development and robotic harvesting operations that improve picking speeds by 40%.
  • For shelf life extension, modified atmosphere packaging is crucial for respiration rate management, reducing retail spoilage by 25%. Beyond culinary use, there is significant growth in functional food applications and holistic wellness products, driven by the high beta-glucan concentration in certain species.
  • The cosmetics and personal care industry is another growth frontier, utilizing kojic acid formulation from fungal extracts for clean beauty ingredients that meet rising consumer demand for organic cultivation standards.

What challenges does the Edible Fungi Industry face during its growth?

  • A significant market challenge is the inherent susceptibility of cultivation systems to pathogenic contamination and disease outbreaks, which threatens crop yields and operational stability.

  • The market faces significant operational challenges, primarily centered on cultivation and logistics. Pathogenic contamination control is a constant battle, as outbreaks of trichoderma green mold or bacterial blotch agents can lead to crop losses of up to 60% in affected grow rooms.
  • Combating this requires investment in technologies like high-efficiency particulate air filtration and advanced computer vision harvesting to detect issues early. In the supply chain, breaches in cold chain logistics contribute to an estimated 15-20% of post-harvest losses, driving the need for supply chain optimization.
  • Innovations in active packaging components, including moisture absorbing pads and anti-microbial coatings, are critical for food waste reduction, especially as culinary diversification and demand for exotic fungi cultivation in specialty food markets grow. These challenges impact both large-scale producers and those focused on local sourcing initiatives for farm-to-table dining.

Exclusive Technavio Analysis on Customer Landscape

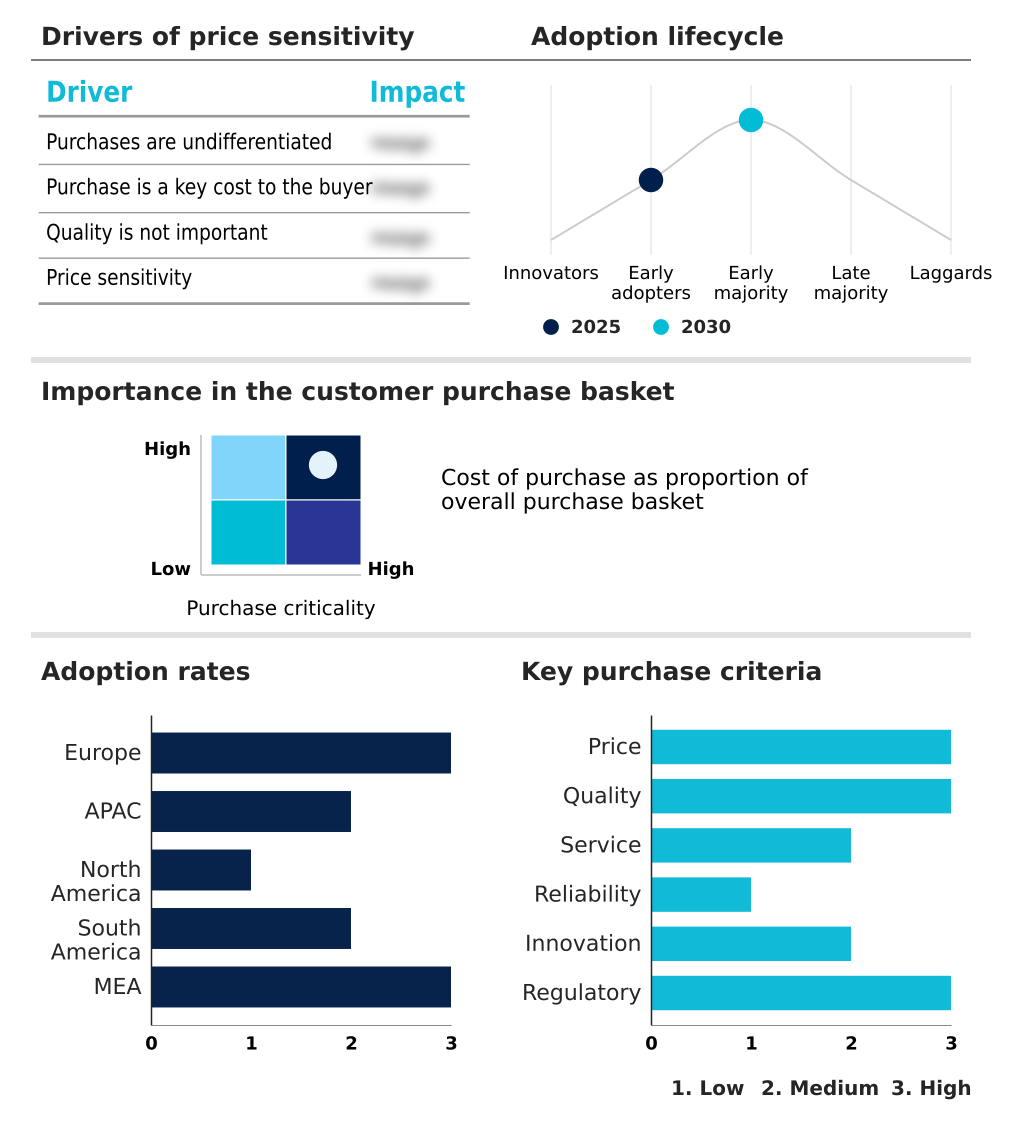
The edible fungi market forecasting report includes the adoption lifecycle of the market, covering from the innovator’s stage to the laggard’s stage. It focuses on adoption rates in different regions based on penetration. Furthermore, the edible fungi market report also includes key purchase criteria and drivers of price sensitivity to help companies evaluate and develop their market growth analysis strategies.

Customer Landscape of Edible Fungi Industry

Competitive Landscape

Companies are implementing various strategies, such as strategic alliances, edible fungi market forecast, partnerships, mergers and acquisitions, geographical expansion, and product/service launches, to enhance their presence in the industry.

Banken Champignons B.V. - Manages a diverse portfolio of fresh and processed mushroom offerings, from cultivation and harvesting to packaging and distribution for various commercial channels.

The industry research and growth report includes detailed analyses of the competitive landscape of the market and information about key companies, including:

  • Banken Champignons B.V.
  • BONDUELLE
  • Borde
  • Costa Group Holdings Ltd.
  • Eurochamp
  • Giorgio Fresh Co.
  • Greenyard
  • Guans Mushroom
  • Hughes Group
  • Monaghan Group
  • Monterey Mushrooms Inc.
  • OKECHAMP S.A.
  • Phillips Mushroom Farms
  • Qihe Biotechnology Co. Ltd
  • Scelta Mushrooms
  • South Mill Champs
  • The Mushroom Co.
  • To-Jo Mushrooms
  • Walsh Mushrooms Group

Qualitative and quantitative analysis of companies has been conducted to help clients understand the wider business environment as well as the strengths and weaknesses of key industry players. Data is qualitatively analyzed to categorize companies as pure play, category-focused, industry-focused, and diversified; it is quantitatively analyzed to categorize companies as dominant, leading, strong, tentative, and weak.

Recent Development and News in Edible fungi market

  • In May 2025, DIRTEA, a leading UK functional mushroom brand, revealed several major retail partnerships, strengthening its role as a key name in premium functional mushroom products.
  • In July 2025, Giorgi Mushroom Co., a subsidiary of The Giorgi Companies, Inc., acquired a majority equity stake in L.F. Lambert Spawn Co., a company recognized for its expertise in spawn production and agricultural innovation.
  • In November 2025, Gachwala, a prominent participant in India's mushroom cultivation industry, introduced its latest innovation Button Mushroom Spawn (Sylvan A15 variety), designed to improve yield and enhance crop quality.
  • In March 2026, Host Defense Mushrooms announced the release of Host Defense Gummies, a new supplement line in gummy form featuring the benefits of mushroom mycelium.

Dive into Technavio’s robust research methodology, blending expert interviews, extensive data synthesis, and validated models for unparalleled Edible Fungi Market insights. See full methodology.

Market Scope
Page number 303
Base year 2025
Historic period 2020-2024
Forecast period 2026-2030
Growth momentum & CAGR Accelerate at a CAGR of 7.5%
Market growth 2026-2030 USD 26038.0 million
Market structure Fragmented
YoY growth 2025-2026(%) 7.0%
Key countries Germany, France, UK, Italy, Spain, The Netherlands, China, Japan, India, South Korea, Indonesia, Australia, US, Canada, Mexico, Brazil, Argentina, Colombia, South Africa, Saudi Arabia, UAE, Turkey and Israel
Competitive landscape Leading Companies, Market Positioning of Companies, Competitive Strategies, and Industry Risks

Request Free Sample

Research Analyst Overview

  • The edible fungi market is defined by a complex interplay of advanced agricultural science and sophisticated supply chain management. Boardroom decisions increasingly focus on capital expenditure for controlled environment agriculture, which necessitates technologies like automated picking systems and high-efficiency particulate air filtration to ensure effective pathogenic contamination control.
  • Implementing a robust substrate sterilization protocol and utilizing sterile tissue culture with liquid spawn production are now standard for competitive operations. The integration of computer vision harvesting and machine learning growth prediction, supported by environmental sensor data analysis, is crucial.
  • In facilities that adopt these measures, losses from issues like trichoderma green mold and bacterial blotch agents have been reduced by up to 40%. The focus extends to post-harvest loss reduction through smart packaging solutions, including modified atmosphere packaging and micro-perforated film technology for respiration rate management.
  • These packages often contain active packaging components like moisture absorbing pads and anti-microbial coatings, monitored by time-temperature indicators. Beyond cultivation, the market is expanding through bioactive compound extraction for nutraceutical formulation and dermatological applications, leveraging the pharmacological properties and high beta-glucan concentration of fungi to create products with kojic acid formulation.
  • This push is driven by consumer demand for the unique umami flavor profile of fungi as a plant-based protein alternative and functional food ingredient, facilitated by robotic harvesting operations and vertical farming methodology using agricultural byproduct substrate.

What are the Key Data Covered in this Edible Fungi Market Research and Growth Report?

  • What is the expected growth of the Edible Fungi Market between 2026 and 2030?

    • USD 26.04 billion, at a CAGR of 7.5%

  • What segmentation does the market report cover?

    • The report is segmented by Product (Button mushroom, Shiitake mushroom, and Oyster mushroom), End-user (Household consumption, Food service, Nutraceutical and pharmaceutical, and Cosmetics and personal care), Type (Fresh mushroom, Dried mushroom, and Canned mushroom) and Geography (Europe, APAC, North America, South America, Middle East and Africa)

  • Which regions are analyzed in the report?

    • Europe, APAC, North America, South America and Middle East and Africa

  • What are the key growth drivers and market challenges?

    • Increasing consumer demand for plant-based and alternative protein sources, Susceptibility to pathogenic contamination and disease outbreaks

  • Who are the major players in the Edible Fungi Market?

    • Banken Champignons B.V., BONDUELLE, Borde, Costa Group Holdings Ltd., Eurochamp, Giorgio Fresh Co., Greenyard, Guans Mushroom, Hughes Group, Monaghan Group, Monterey Mushrooms Inc., OKECHAMP S.A., Phillips Mushroom Farms, Qihe Biotechnology Co. Ltd, Scelta Mushrooms, South Mill Champs, The Mushroom Co., To-Jo Mushrooms and Walsh Mushrooms Group

Market Research Insights

  • Market dynamics are increasingly shaped by consumer interest in gourmet mushroom varieties and sustainable production. The adoption of local sourcing initiatives has enabled some suppliers to reduce transportation-related expenses by up to 20%, enhancing margin stability. Simultaneously, a focus on food waste reduction is driving innovation in packaging and logistics.
  • Advanced packaging solutions, for example, have contributed to a 30% decline in retail spoilage for certain high-value species. This operational efficiency is critical as producers work to meet demand from both retail and foodservice sectors, where the culinary versatility of fungi is a key purchasing driver.
  • The emphasis on both sustainability and quality is reshaping supply chain strategies across the industry.

We can help! Our analysts can customize this edible fungi market research report to meet your requirements.

Get in touch

1. Executive Summary

1.1 Market overview

Executive Summary - Chart on Market Overview
Executive Summary - Data Table on Market Overview
Executive Summary - Chart on Global Market Characteristics
Executive Summary - Chart on Market by Geography
Executive Summary - Chart on Market Segmentation by Product
Executive Summary - Chart on Market Segmentation by End-user
Executive Summary - Chart on Market Segmentation by Type
Executive Summary - Chart on Incremental Growth
Executive Summary - Data Table on Incremental Growth
Executive Summary - Chart on Company Market Positioning

2. Technavio Analysis

2.1 Analysis of price sensitivity, lifecycle, customer purchase basket, adoption rates, and purchase criteria

2.2 Criticality of inputs and Factors of differentiation

Chart on Overview on criticality of inputs and factors of differentiation

2.3 Factors of disruption

Chart on Overview on factors of disruption

2.4 Impact of drivers and challenges

Chart on Impact of drivers and challenges in 2025 and 2030

3. Market Landscape

3.1 Market ecosystem

Chart on Parent Market
Data Table on - Parent Market

3.2 Market characteristics

Chart on Market characteristics analysis

3.3 Value chain analysis

Chart on Value chain analysis

4. Market Sizing

4.1 Market definition

Data Table on Offerings of companies included in the market definition

4.2 Market segment analysis

Market segments

4.3 Market size 2025

4.4 Market outlook: Forecast for 2025-2030

Chart on Global - Market size and forecast 2025-2030 ($ million)
Data Table on Global - Market size and forecast 2025-2030 ($ million)
Chart on Global Market: Year-over-year growth 2025-2030 (%)
Data Table on Global Market: Year-over-year growth 2025-2030 (%)

5. Historic Market Size

5.1 Global Edible Fungi Market 2020 - 2024

Historic Market Size - Data Table on Global Edible Fungi Market 2020 - 2024 ($ million)

5.2 Product segment analysis 2020 - 2024

Historic Market Size - Product Segment 2020 - 2024 ($ million)

5.3 End-user segment analysis 2020 - 2024

Historic Market Size - End-user Segment 2020 - 2024 ($ million)

5.4 Type segment analysis 2020 - 2024

Historic Market Size - Type Segment 2020 - 2024 ($ million)

5.5 Geography segment analysis 2020 - 2024

Historic Market Size - Geography Segment 2020 - 2024 ($ million)

5.6 Country segment analysis 2020 - 2024

Historic Market Size - Country Segment 2020 - 2024 ($ million)

6. Qualitative Analysis

6.1 Impact of AI on Global Edible Fungi Market

6.2 Impact of Geopolitical conflicts on Global Edible Fungi Market

7. Five Forces Analysis

7.1 Five forces summary

Five forces analysis - Comparison between 2025 and 2030

7.2 Bargaining power of buyers

Bargaining power of buyers - Impact of key factors 2025 and 2030

7.3 Bargaining power of suppliers

Bargaining power of suppliers - Impact of key factors in 2025 and 2030

7.4 Threat of new entrants

Threat of new entrants - Impact of key factors in 2025 and 2030

7.5 Threat of substitutes

Threat of substitutes - Impact of key factors in 2025 and 2030

7.6 Threat of rivalry

Threat of rivalry - Impact of key factors in 2025 and 2030

7.7 Market condition

Chart on Market condition - Five forces 2025 and 2030

8. Market Segmentation by Product

8.1 Market segments

Chart on Product - Market share 2025-2030 (%)
Data Table on Product - Market share 2025-2030 (%)

8.2 Comparison by Product

Chart on Comparison by Product
Data Table on Comparison by Product

8.3 Button mushroom - Market size and forecast 2025-2030

Chart on Button mushroom - Market size and forecast 2025-2030 ($ million)
Data Table on Button mushroom - Market size and forecast 2025-2030 ($ million)
Chart on Button mushroom - Year-over-year growth 2025-2030 (%)
Data Table on Button mushroom - Year-over-year growth 2025-2030 (%)

8.4 Shiitake mushroom - Market size and forecast 2025-2030

Chart on Shiitake mushroom - Market size and forecast 2025-2030 ($ million)
Data Table on Shiitake mushroom - Market size and forecast 2025-2030 ($ million)
Chart on Shiitake mushroom - Year-over-year growth 2025-2030 (%)
Data Table on Shiitake mushroom - Year-over-year growth 2025-2030 (%)

8.5 Oyster mushroom - Market size and forecast 2025-2030

Chart on Oyster mushroom - Market size and forecast 2025-2030 ($ million)
Data Table on Oyster mushroom - Market size and forecast 2025-2030 ($ million)
Chart on Oyster mushroom - Year-over-year growth 2025-2030 (%)
Data Table on Oyster mushroom - Year-over-year growth 2025-2030 (%)

8.6 Market opportunity by Product

Market opportunity by Product ($ million)
Data Table on Market opportunity by Product ($ million)

9. Market Segmentation by End-user

9.1 Market segments

Chart on End-user - Market share 2025-2030 (%)
Data Table on End-user - Market share 2025-2030 (%)

9.2 Comparison by End-user

Chart on Comparison by End-user
Data Table on Comparison by End-user

9.3 Household consumption - Market size and forecast 2025-2030

Chart on Household consumption - Market size and forecast 2025-2030 ($ million)
Data Table on Household consumption - Market size and forecast 2025-2030 ($ million)
Chart on Household consumption - Year-over-year growth 2025-2030 (%)
Data Table on Household consumption - Year-over-year growth 2025-2030 (%)

9.4 Food service - Market size and forecast 2025-2030

Chart on Food service - Market size and forecast 2025-2030 ($ million)
Data Table on Food service - Market size and forecast 2025-2030 ($ million)
Chart on Food service - Year-over-year growth 2025-2030 (%)
Data Table on Food service - Year-over-year growth 2025-2030 (%)

9.5 Nutraceutical and pharmaceutical - Market size and forecast 2025-2030

Chart on Nutraceutical and pharmaceutical - Market size and forecast 2025-2030 ($ million)
Data Table on Nutraceutical and pharmaceutical - Market size and forecast 2025-2030 ($ million)
Chart on Nutraceutical and pharmaceutical - Year-over-year growth 2025-2030 (%)
Data Table on Nutraceutical and pharmaceutical - Year-over-year growth 2025-2030 (%)

9.6 Cosmetics and personal care - Market size and forecast 2025-2030

Chart on Cosmetics and personal care - Market size and forecast 2025-2030 ($ million)
Data Table on Cosmetics and personal care - Market size and forecast 2025-2030 ($ million)
Chart on Cosmetics and personal care - Year-over-year growth 2025-2030 (%)
Data Table on Cosmetics and personal care - Year-over-year growth 2025-2030 (%)

9.7 Market opportunity by End-user

Market opportunity by End-user ($ million)
Data Table on Market opportunity by End-user ($ million)

10. Market Segmentation by Type

10.1 Market segments

Chart on Type - Market share 2025-2030 (%)
Data Table on Type - Market share 2025-2030 (%)

10.2 Comparison by Type

Chart on Comparison by Type
Data Table on Comparison by Type

10.3 Fresh mushroom - Market size and forecast 2025-2030

Chart on Fresh mushroom - Market size and forecast 2025-2030 ($ million)
Data Table on Fresh mushroom - Market size and forecast 2025-2030 ($ million)
Chart on Fresh mushroom - Year-over-year growth 2025-2030 (%)
Data Table on Fresh mushroom - Year-over-year growth 2025-2030 (%)

10.4 Dried mushroom - Market size and forecast 2025-2030

Chart on Dried mushroom - Market size and forecast 2025-2030 ($ million)
Data Table on Dried mushroom - Market size and forecast 2025-2030 ($ million)
Chart on Dried mushroom - Year-over-year growth 2025-2030 (%)
Data Table on Dried mushroom - Year-over-year growth 2025-2030 (%)

10.5 Canned mushroom - Market size and forecast 2025-2030

Chart on Canned mushroom - Market size and forecast 2025-2030 ($ million)
Data Table on Canned mushroom - Market size and forecast 2025-2030 ($ million)
Chart on Canned mushroom - Year-over-year growth 2025-2030 (%)
Data Table on Canned mushroom - Year-over-year growth 2025-2030 (%)

10.6 Market opportunity by Type

Market opportunity by Type ($ million)
Data Table on Market opportunity by Type ($ million)

11. Customer Landscape

11.1 Customer landscape overview

Analysis of price sensitivity, lifecycle, customer purchase basket, adoption rates, and purchase criteria

12. Geographic Landscape

12.1 Geographic segmentation

Chart on Market share by geography 2025-2030 (%)
Data Table on Market share by geography 2025-2030 (%)

12.2 Geographic comparison

Chart on Geographic comparison
Data Table on Geographic comparison

12.3 Europe - Market size and forecast 2025-2030

Chart on Europe - Market size and forecast 2025-2030 ($ million)
Data Table on Europe - Market size and forecast 2025-2030 ($ million)
Chart on Europe - Year-over-year growth 2025-2030 (%)
Data Table on Europe - Year-over-year growth 2025-2030 (%)
Chart on Regional Comparison - Europe
Data Table on Regional Comparison - Europe

12.3.1 Germany - Market size and forecast 2025-2030

Chart on Germany - Market size and forecast 2025-2030 ($ million)
Data Table on Germany - Market size and forecast 2025-2030 ($ million)
Chart on Germany - Year-over-year growth 2025-2030 (%)
Data Table on Germany - Year-over-year growth 2025-2030 (%)

12.3.2 France - Market size and forecast 2025-2030

Chart on France - Market size and forecast 2025-2030 ($ million)
Data Table on France - Market size and forecast 2025-2030 ($ million)
Chart on France - Year-over-year growth 2025-2030 (%)
Data Table on France - Year-over-year growth 2025-2030 (%)

12.3.3 UK - Market size and forecast 2025-2030

Chart on UK - Market size and forecast 2025-2030 ($ million)
Data Table on UK - Market size and forecast 2025-2030 ($ million)
Chart on UK - Year-over-year growth 2025-2030 (%)
Data Table on UK - Year-over-year growth 2025-2030 (%)

12.3.4 Italy - Market size and forecast 2025-2030

Chart on Italy - Market size and forecast 2025-2030 ($ million)
Data Table on Italy - Market size and forecast 2025-2030 ($ million)
Chart on Italy - Year-over-year growth 2025-2030 (%)
Data Table on Italy - Year-over-year growth 2025-2030 (%)

12.3.5 Spain - Market size and forecast 2025-2030

Chart on Spain - Market size and forecast 2025-2030 ($ million)
Data Table on Spain - Market size and forecast 2025-2030 ($ million)
Chart on Spain - Year-over-year growth 2025-2030 (%)
Data Table on Spain - Year-over-year growth 2025-2030 (%)

12.3.6 The Netherlands - Market size and forecast 2025-2030

Chart on The Netherlands - Market size and forecast 2025-2030 ($ million)
Data Table on The Netherlands - Market size and forecast 2025-2030 ($ million)
Chart on The Netherlands - Year-over-year growth 2025-2030 (%)
Data Table on The Netherlands - Year-over-year growth 2025-2030 (%)

12.4 APAC - Market size and forecast 2025-2030

Chart on APAC - Market size and forecast 2025-2030 ($ million)
Data Table on APAC - Market size and forecast 2025-2030 ($ million)
Chart on APAC - Year-over-year growth 2025-2030 (%)
Data Table on APAC - Year-over-year growth 2025-2030 (%)
Chart on Regional Comparison - APAC
Data Table on Regional Comparison - APAC

12.4.1 China - Market size and forecast 2025-2030

Chart on China - Market size and forecast 2025-2030 ($ million)
Data Table on China - Market size and forecast 2025-2030 ($ million)
Chart on China - Year-over-year growth 2025-2030 (%)
Data Table on China - Year-over-year growth 2025-2030 (%)

12.4.2 Japan - Market size and forecast 2025-2030

Chart on Japan - Market size and forecast 2025-2030 ($ million)
Data Table on Japan - Market size and forecast 2025-2030 ($ million)
Chart on Japan - Year-over-year growth 2025-2030 (%)
Data Table on Japan - Year-over-year growth 2025-2030 (%)

12.4.3 India - Market size and forecast 2025-2030

Chart on India - Market size and forecast 2025-2030 ($ million)
Data Table on India - Market size and forecast 2025-2030 ($ million)
Chart on India - Year-over-year growth 2025-2030 (%)
Data Table on India - Year-over-year growth 2025-2030 (%)

12.4.4 South Korea - Market size and forecast 2025-2030

Chart on South Korea - Market size and forecast 2025-2030 ($ million)
Data Table on South Korea - Market size and forecast 2025-2030 ($ million)
Chart on South Korea - Year-over-year growth 2025-2030 (%)
Data Table on South Korea - Year-over-year growth 2025-2030 (%)

12.4.5 Indonesia - Market size and forecast 2025-2030

Chart on Indonesia - Market size and forecast 2025-2030 ($ million)
Data Table on Indonesia - Market size and forecast 2025-2030 ($ million)
Chart on Indonesia - Year-over-year growth 2025-2030 (%)
Data Table on Indonesia - Year-over-year growth 2025-2030 (%)

12.4.6 Australia - Market size and forecast 2025-2030

Chart on Australia - Market size and forecast 2025-2030 ($ million)
Data Table on Australia - Market size and forecast 2025-2030 ($ million)
Chart on Australia - Year-over-year growth 2025-2030 (%)
Data Table on Australia - Year-over-year growth 2025-2030 (%)

12.5 North America - Market size and forecast 2025-2030

Chart on North America - Market size and forecast 2025-2030 ($ million)
Data Table on North America - Market size and forecast 2025-2030 ($ million)
Chart on North America - Year-over-year growth 2025-2030 (%)
Data Table on North America - Year-over-year growth 2025-2030 (%)
Chart on Regional Comparison - North America
Data Table on Regional Comparison - North America

12.5.1 US - Market size and forecast 2025-2030

Chart on US - Market size and forecast 2025-2030 ($ million)
Data Table on US - Market size and forecast 2025-2030 ($ million)
Chart on US - Year-over-year growth 2025-2030 (%)
Data Table on US - Year-over-year growth 2025-2030 (%)

12.5.2 Canada - Market size and forecast 2025-2030

Chart on Canada - Market size and forecast 2025-2030 ($ million)
Data Table on Canada - Market size and forecast 2025-2030 ($ million)
Chart on Canada - Year-over-year growth 2025-2030 (%)
Data Table on Canada - Year-over-year growth 2025-2030 (%)

12.5.3 Mexico - Market size and forecast 2025-2030

Chart on Mexico - Market size and forecast 2025-2030 ($ million)
Data Table on Mexico - Market size and forecast 2025-2030 ($ million)
Chart on Mexico - Year-over-year growth 2025-2030 (%)
Data Table on Mexico - Year-over-year growth 2025-2030 (%)

12.6 South America - Market size and forecast 2025-2030

Chart on South America - Market size and forecast 2025-2030 ($ million)
Data Table on South America - Market size and forecast 2025-2030 ($ million)
Chart on South America - Year-over-year growth 2025-2030 (%)
Data Table on South America - Year-over-year growth 2025-2030 (%)
Chart on Regional Comparison - South America
Data Table on Regional Comparison - South America

12.6.1 Brazil - Market size and forecast 2025-2030

Chart on Brazil - Market size and forecast 2025-2030 ($ million)
Data Table on Brazil - Market size and forecast 2025-2030 ($ million)
Chart on Brazil - Year-over-year growth 2025-2030 (%)
Data Table on Brazil - Year-over-year growth 2025-2030 (%)

12.6.2 Argentina - Market size and forecast 2025-2030

Chart on Argentina - Market size and forecast 2025-2030 ($ million)
Data Table on Argentina - Market size and forecast 2025-2030 ($ million)
Chart on Argentina - Year-over-year growth 2025-2030 (%)
Data Table on Argentina - Year-over-year growth 2025-2030 (%)

12.6.3 Colombia - Market size and forecast 2025-2030

Chart on Colombia - Market size and forecast 2025-2030 ($ million)
Data Table on Colombia - Market size and forecast 2025-2030 ($ million)
Chart on Colombia - Year-over-year growth 2025-2030 (%)
Data Table on Colombia - Year-over-year growth 2025-2030 (%)

12.7 Middle East and Africa - Market size and forecast 2025-2030

Chart on Middle East and Africa - Market size and forecast 2025-2030 ($ million)
Data Table on Middle East and Africa - Market size and forecast 2025-2030 ($ million)
Chart on Middle East and Africa - Year-over-year growth 2025-2030 (%)
Data Table on Middle East and Africa - Year-over-year growth 2025-2030 (%)
Chart on Regional Comparison - Middle East and Africa
Data Table on Regional Comparison - Middle East and Africa

12.7.1 South Africa - Market size and forecast 2025-2030

Chart on South Africa - Market size and forecast 2025-2030 ($ million)
Data Table on South Africa - Market size and forecast 2025-2030 ($ million)
Chart on South Africa - Year-over-year growth 2025-2030 (%)
Data Table on South Africa - Year-over-year growth 2025-2030 (%)

12.7.2 Saudi Arabia - Market size and forecast 2025-2030

Chart on Saudi Arabia - Market size and forecast 2025-2030 ($ million)
Data Table on Saudi Arabia - Market size and forecast 2025-2030 ($ million)
Chart on Saudi Arabia - Year-over-year growth 2025-2030 (%)
Data Table on Saudi Arabia - Year-over-year growth 2025-2030 (%)

12.7.3 UAE - Market size and forecast 2025-2030

Chart on UAE - Market size and forecast 2025-2030 ($ million)
Data Table on UAE - Market size and forecast 2025-2030 ($ million)
Chart on UAE - Year-over-year growth 2025-2030 (%)
Data Table on UAE - Year-over-year growth 2025-2030 (%)

12.7.4 Turkey - Market size and forecast 2025-2030

Chart on Turkey - Market size and forecast 2025-2030 ($ million)
Data Table on Turkey - Market size and forecast 2025-2030 ($ million)
Chart on Turkey - Year-over-year growth 2025-2030 (%)
Data Table on Turkey - Year-over-year growth 2025-2030 (%)

12.7.5 Israel - Market size and forecast 2025-2030

Chart on Israel - Market size and forecast 2025-2030 ($ million)
Data Table on Israel - Market size and forecast 2025-2030 ($ million)
Chart on Israel - Year-over-year growth 2025-2030 (%)
Data Table on Israel - Year-over-year growth 2025-2030 (%)

12.8 Market opportunity by geography

Market opportunity by geography ($ million)
Data Tables on Market opportunity by geography ($ million)

13. Drivers, Challenges, and Opportunity

13.1 Market drivers

Increasing consumer demand for plant-based and alternative protein sources
Expanding applications in functional food and nutraceutical sectors
Advancements in controlled environment agriculture and sustainable farming practices

13.2 Market challenges

Susceptibility to pathogenic contamination and disease outbreaks
High initial capital investment and operational costs
Complex supply chain logistics and short shelf life of fresh produce

13.3 Impact of drivers and challenges

Impact of drivers and challenges in 2025 and 2030

13.4 Market opportunities

Integration of robotics and artificial intelligence in harvesting operations
Mainstream expansion of exotic and gourmet mushroom varieties
Development of smart packaging solutions to extend shelf life

14. Competitive Landscape

14.1 Overview

14.2

Overview on criticality of inputs and factors of differentiation

14.3 Landscape disruption

Overview on factors of disruption

14.4 Industry risks

Impact of key risks on business

15. Competitive Analysis

15.1 Companies profiled

Companies covered

15.2 Company ranking index

15.3 Market positioning of companies

Matrix on companies position and classification

15.4 Banken Champignons B.V.

Banken Champignons B.V. - Overview
Banken Champignons B.V. - Product / Service
Banken Champignons B.V. - Key offerings
SWOT

15.5 BONDUELLE

BONDUELLE - Overview
BONDUELLE - Business segments
BONDUELLE - Key offerings
BONDUELLE - Segment focus
SWOT

15.6 Borde

Borde - Overview
Borde - Product / Service
Borde - Key offerings
SWOT

15.7 Costa Group Holdings Ltd.

Costa Group Holdings Ltd. - Overview
Costa Group Holdings Ltd. - Product / Service
Costa Group Holdings Ltd. - Key offerings
SWOT

15.8 Eurochamp

Eurochamp - Overview
Eurochamp - Product / Service
Eurochamp - Key offerings
SWOT

15.9 Giorgio Fresh Co.

Giorgio Fresh Co. - Overview
Giorgio Fresh Co. - Product / Service
Giorgio Fresh Co. - Key offerings
SWOT

15.10 Greenyard

Greenyard - Overview
Greenyard - Product / Service
Greenyard - Key offerings
SWOT

15.11 Monaghan Group

Monaghan Group - Overview
Monaghan Group - Product / Service
Monaghan Group - Key offerings
SWOT

15.12 Monterey Mushrooms Inc.

Monterey Mushrooms Inc. - Overview
Monterey Mushrooms Inc. - Product / Service
Monterey Mushrooms Inc. - Key offerings
SWOT

15.13 OKECHAMP S.A.

OKECHAMP S.A. - Overview
OKECHAMP S.A. - Product / Service
OKECHAMP S.A. - Key offerings
SWOT

15.14 Phillips Mushroom Farms

Phillips Mushroom Farms - Overview
Phillips Mushroom Farms - Product / Service
Phillips Mushroom Farms - Key offerings
SWOT

15.15 Qihe Biotechnology Co. Ltd

Qihe Biotechnology Co. Ltd - Overview
Qihe Biotechnology Co. Ltd - Product / Service
Qihe Biotechnology Co. Ltd - Key offerings
SWOT

15.16 Scelta Mushrooms

Scelta Mushrooms - Overview
Scelta Mushrooms - Product / Service
Scelta Mushrooms - Key offerings
SWOT

15.17 South Mill Champs

South Mill Champs - Overview
South Mill Champs - Product / Service
South Mill Champs - Key offerings
SWOT

15.18 Walsh Mushrooms Group

Walsh Mushrooms Group - Overview
Walsh Mushrooms Group - Product / Service
Walsh Mushrooms Group - Key offerings
SWOT

16. Appendix

16.1 Scope of the report

Market definition
Objectives
Notes and caveats

16.2 Inclusions and exclusions checklist

Inclusions checklist
Exclusions checklist

16.3 Currency conversion rates for US$

16.4 Research methodology

16.5 Data procurement

Information sources

16.6 Data validation

16.7 Validation techniques employed for market sizing

16.8 Data synthesis

16.9 360 degree market analysis

16.10 List of abbreviations

Research Methodology

Technavio presents a detailed picture of the market by way of study, synthesis, and summation of data from multiple sources. The analysts have presented the various facets of the market with a particular focus on identifying the key industry influencers. The data thus presented is comprehensive, reliable, and the result of extensive research, both primary and secondary.

INFORMATION SOURCES

Primary sources

  • Manufacturers and suppliers
  • Channel partners
  • Industry experts
  • Strategic decision makers

Secondary sources

  • Industry journals and periodicals
  • Government data
  • Financial reports of key industry players
  • Historical data
  • Press releases

DATA ANALYSIS

Data Synthesis

  • Collation of data
  • Estimation of key figures
  • Analysis of derived insights

Data Validation

  • Triangulation with data models
  • Reference against proprietary databases
  • Corroboration with industry experts

REPORT WRITING

Qualitative

  • Market drivers
  • Market challenges
  • Market trends
  • Five forces analysis

Quantitative

  • Market size and forecast
  • Market segmentation
  • Geographical insights
  • Competitive landscape

Interested in this report?

Get your sample now to see our research methodology and insights!

Download Now

Frequently Asked Questions

Edible Fungi market growth will increase by USD 26038.0 million during 2026-2030.

The Edible Fungi market is expected to grow at a CAGR of 7.5% during 2026-2030.

Edible Fungi market is segmented by Product (Button mushroom, Shiitake mushroom, Oyster mushroom) End-user (Household consumption, Food service, Nutraceutical and pharmaceutical, Cosmetics and personal care) Type (Fresh mushroom, Dried mushroom, Canned mushroom)

Banken Champignons B.V., BONDUELLE, Borde, Costa Group Holdings Ltd., Eurochamp, Giorgio Fresh Co., Greenyard, Guans Mushroom, Hughes Group, Monaghan Group, Monterey Mushrooms Inc., OKECHAMP S.A., Phillips Mushroom Farms, Qihe Biotechnology Co. Ltd, Scelta Mushrooms, South Mill Champs, The Mushroom Co., To-Jo Mushrooms, Walsh Mushrooms Group are a few of the key vendors in the Edible Fungi market.

APAC will register the highest growth rate of 42.1% among the other regions. Therefore, the Edible Fungi market in APAC is expected to garner significant business opportunities for the vendors during the forecast period.

Germany, France, UK, Italy, Spain, The Netherlands, China, Japan, India, South Korea, Indonesia, Australia, US, Canada, Mexico, Brazil, Argentina, Colombia, South Africa, Saudi Arabia, UAE, Turkey, Israel

  • Increasing consumer demand for plant-based and alternative protein sources is the driving factor this market.

The Edible Fungi market vendors should focus on grabbing business opportunities from the Product segment as it accounted for the largest market share in the base year.
RIA - Research AI Assistant
Ask RIA