Electric Bus Market Size 2025-2029
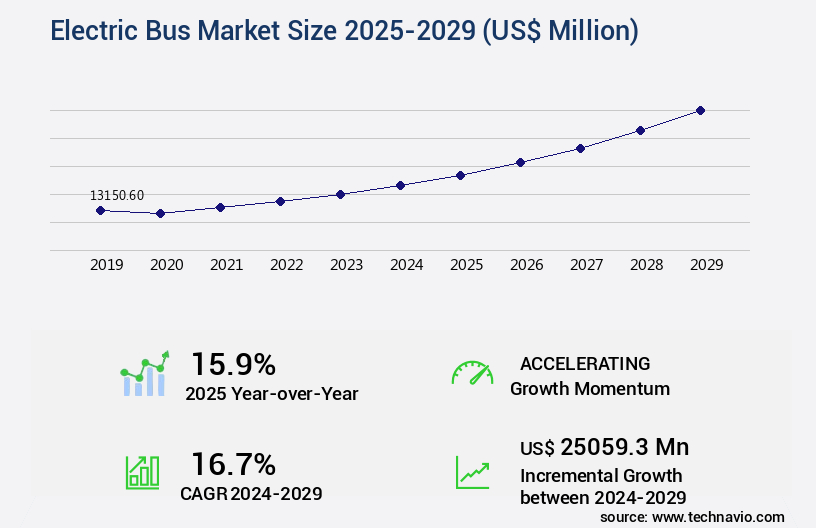
The electric bus market size is valued to increase USD 25.06 billion, at a CAGR of 16.7% from 2024 to 2029. Reduction in battery prices of electric buses will drive the electric bus market.
Major Market Trends & Insights
- APAC dominated the market and accounted for a 87% growth during the forecast period.
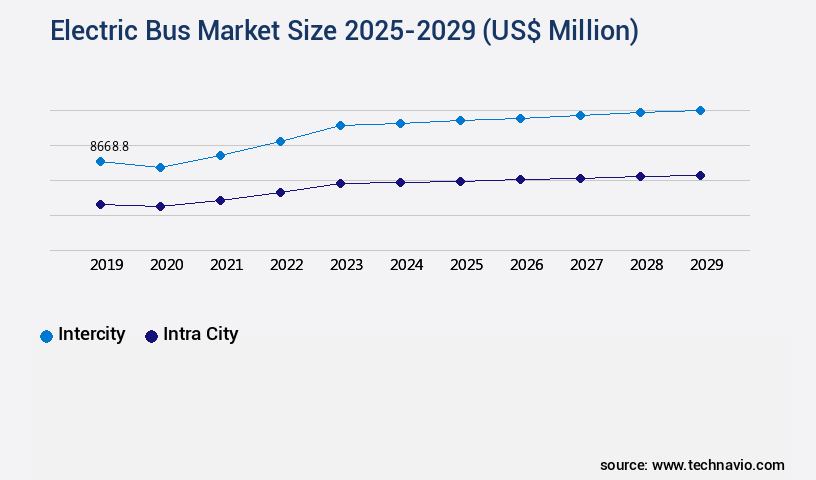
- By Application - Intercity segment was valued at USD 8.67 billion in 2023
- By Type - Pure electric bus segment accounted for the largest market revenue share in 2023
Market Size & Forecast
- Market Opportunities: USD 254.14 million
- Market Future Opportunities: USD 25059.30 million
- CAGR from 2024 to 2029 : 16.7%
Market Summary
- The market has experienced significant growth in recent years, driven by the global push towards sustainable transportation solutions. The market's size is projected to reach USD22.4 billion by 2027, reflecting a steady increase in demand. One of the key factors fueling this growth is the reduction in battery prices, making electric buses increasingly cost-competitive with their diesel counterparts. Another trend transforming the market is the increasing popularity of wireless charging systems. These systems enable buses to recharge while in motion, reducing downtime and improving operational efficiency. However, challenges remain, including the need for extensive infrastructure development and the ongoing debate surrounding battery range and charging infrastructure.
- Despite these challenges, the future of the market looks promising. As public transport users become more environmentally conscious, the demand for cleaner, more sustainable transportation options is expected to continue growing. Moreover, advancements in battery technology and charging infrastructure are poised to address current challenges and pave the way for a fully electrified public transport sector. In summary, the market is undergoing a transformation driven by cost reductions, technological advancements, and changing consumer preferences. With a projected market size of USD22.4 billion by 2027, the sector is poised for continued growth and innovation.
What will be the Size of the Electric Bus Market during the forecast period?

Get Key Insights on Market Forecast (PDF) Request Free Sample
How is the Electric Bus Market Segmented ?
The electric bus industry research report provides comprehensive data (region-wise segment analysis), with forecasts and estimates in "USD million" for the period 2025-2029, as well as historical data from 2019-2023 for the following segments.
- Application
- Type
- Pure electric bus
- Plug-in hybrid bus
- Speed
- Less than 200 Miles
- More than 200 Miles
- Capacity
- Up to 400 kWh
- Above 400 kWh
- Product Type
- Semi-autonomous
- Autonomous
- Propulsion Type
- Battery Electric Bus (BEV)
- Hybrid Electric Bus (HEV)
- Fuel Cell Electric Bus (FCEV)
- Battery Type
- Lithium-Ion
- Nickel-Metal Hydride
- Others
- Geography
- North America
- Europe
- Middle East and Africa
- APAC
- South America
- Rest of World (ROW)
By Application Insights
The intercity segment is estimated to witness significant growth during the forecast period.
Amidst a global push towards electrification and emission reduction, the market is experiencing significant growth. In 2023, China led the APAC region with a substantial market share, as the Chinese government continues its efforts to replace diesel buses with electric ones, reducing vehicular emissions. India is following suit, aiming to have all vehicles electric by 2030. To support this transition, the Indian government is investing in electric bus infrastructure, attracting manufacturers like Volvo and BYD to establish operations. Advanced technologies, such as predictive maintenance, traction motor efficiency, and smart charging, are driving innovation in the sector. For instance, route optimization algorithms and energy consumption modeling help improve operational efficiency, while battery pack design, noise reduction technology, and thermal management systems enhance passenger comfort.
With the integration of advanced power electronics, regenerative braking systems, and onboard energy storage, electric buses are becoming increasingly competitive with their diesel counterparts. The electrification of bus fleets not only reduces emissions but also has a positive impact on the grid. By 2030, electric buses are expected to account for over 40% of the global bus market, making it a promising sector for investment.

Request Free Sample
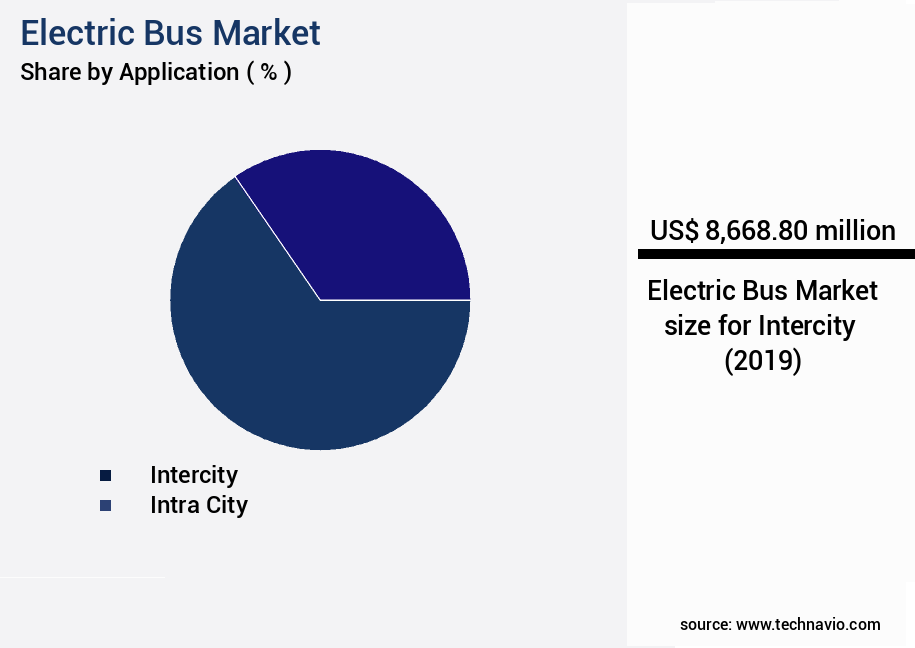
The Intercity segment was valued at USD 8.67 billion in 2019 and showed a gradual increase during the forecast period.

Request Free Sample
Regional Analysis
APAC is estimated to contribute 87% to the growth of the global market during the forecast period.Technavio's analysts have elaborately explained the regional trends and drivers that shape the market during the forecast period.

See How Electric Bus Market Demand is Rising in APAC Request Free Sample
The market in China is experiencing significant growth due to the increasing demand for public transportation solutions, particularly bus rapid transit (BRT), in metro cities. Consumers' heightened awareness of electric vehicles' advantages is propelling the shift from diesel to electric buses, making this a pivotal trend in the market. Buses are a ubiquitous component of transit systems, and their introduction and modification are relatively straightforward.
With a focus on mitigating traffic congestion and reducing vehicle emissions, Chinese authorities are advocating for the expansion of public transportation over private transportation. This preference for public transportation contributes to the market's robust expansion. As a professional, it is essential to acknowledge the importance of this evolving trend in the transportation sector.
Market Dynamics
Our researchers analyzed the data with 2024 as the base year, along with the key drivers, trends, and challenges. A holistic analysis of drivers will help companies refine their marketing strategies to gain a competitive advantage.
The market is experiencing significant growth as transit systems worldwide embrace the shift towards sustainable transportation. The adoption of electric buses is having a profound impact on the industry, with numerous benefits including reduced greenhouse gas emissions, improved passenger comfort, and enhanced safety features. One crucial aspect of electric bus implementation is the optimization of charging strategies. Lifecycle assessment of electric bus technologies reveals that efficient charging infrastructure deployment is essential for minimizing operational costs. Integration of renewable energy sources into electric bus fleets is another key strategy for reducing the carbon footprint and improving overall efficiency. Comparing different battery chemistries in electric buses is a topic of ongoing research, with each technology offering unique advantages.
For instance, lithium-ion batteries provide a high energy density, while sodium-ion batteries offer lower production costs. Optimizing the design of electric bus chassis and implementing efficient thermal management systems are other strategies to improve energy efficiency and reduce operation and maintenance costs. Electric bus motor technologies also warrant evaluation, as advancements in this area can lead to significant improvements in energy efficiency and range. Regenerative braking systems in electric buses are an essential feature that helps mitigate range anxiety by capturing energy during braking and storing it for later use. Smart charging algorithms and the implementation of efficient thermal management systems are essential for optimizing electric bus fleets.
Assessing the environmental impact of electric bus technologies is another critical consideration, as the production and disposal of batteries can pose environmental challenges. Reducing noise pollution is another key benefit of electric bus operations, contributing to improved urban environments and enhancing the overall passenger experience. Strategies for improving electric bus energy efficiency, such as aerodynamic design and lightweight materials, are also essential for reducing operational costs and increasing the competitiveness of electric buses in the market. Cost-benefit analysis is a crucial aspect of deploying electric bus systems, with the initial investment often outweighed by long-term savings on fuel and maintenance costs.
Planning future electric bus infrastructure needs involves careful consideration of charging infrastructure, battery swapping stations, and fleet size requirements. In conclusion, the market is poised for continued growth as transit systems worldwide adopt these sustainable vehicles. The optimization of charging strategies, integration of renewable energy sources, and evaluation of different battery chemistries are just a few of the key areas of focus for stakeholders in this dynamic and evolving industry. Adoption rates in developed regions are nearly double those in developing regions, underscoring the growing global demand for electric buses and the opportunities for innovation and growth in this sector.

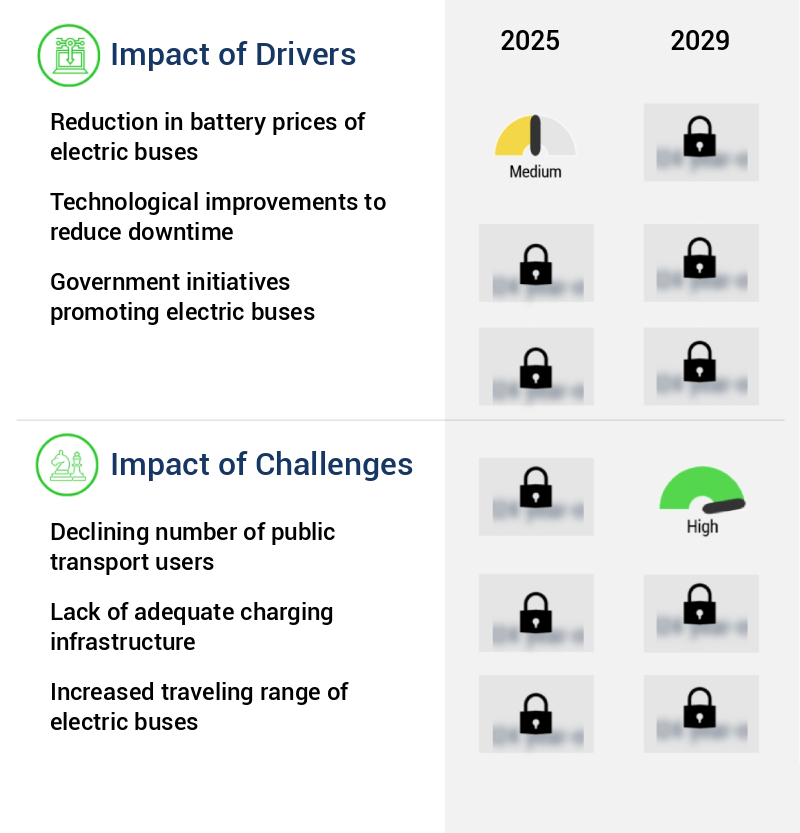
What are the key market drivers leading to the rise in the adoption of Electric Bus Industry?
- The significant decrease in the cost of batteries for electric buses is the primary factor fueling market growth.
- Electric bus production costs are significantly influenced by battery prices. Battery manufacturers continue to innovate in the realm of electric bus batteries, with advancements in lithium-ion (Li-ion) technology leading to weight reduction and extended lifespan compared to conventional lead-acid and valve-regulated lead acid (VRLA) batteries. The initial cost of an electric bus is approximately 30%-35% higher than that of a conventional bus. This price difference underscores the importance of battery price trends in the market.
- As battery technology evolves, the cost differential between electric and conventional buses is expected to narrow, making electric buses increasingly competitive. This ongoing development in battery technology is a crucial factor driving the growth and evolution of the electric bus sector.
What are the market trends shaping the Electric Bus Industry?
- The rising preference for wireless charging systems represents a significant market trend in the present day. This trend is set to continue due to the increasing popularity of these systems.
- Inductive wireless charging technology for high-power electric buses is gaining traction due to its convenience for operators. The US Department of Energy's Oak Ridge National Laboratory (ORNL) has pioneered a 20-kW inductive wireless charging system for electric vehicles, which outperforms conventional plug-in systems. During testing, an electric Toyota RAV4 equipped with an additional 10-kWh battery achieved 90% efficiency using this system. This efficiency level is three times higher than that of plug-in systems, leading to the development of 50-kW wireless chargers.
- These chargers match the power capacity of quick plug-in chargers commercially available in the market. The continuous advancement in wireless charging technology signifies a shift towards more efficient and convenient charging solutions for electric buses, enhancing their overall performance and competitiveness in the transportation sector.
What challenges does the Electric Bus Industry face during its growth?
- The declining number of public transport users poses a significant challenge to the industry's growth trajectory. This trend, which is a major concern for industry professionals, threatens to hinder the expansion and progress of the public transport sector.
- The market faces challenges due to the shifting consumer preference towards personal vehicles, leading to a decline in demand for public transportation. This trend has left transit agencies hesitant to invest in expensive electric buses. The automobile industry's expansion, producing a diverse range of cars catering to various income groups, further hinders the market's growth. The demand for public transportation services is diminishing as personal vehicle ownership increases.
- Despite these challenges, the market continues to evolve, with advancements in battery technology and charging infrastructure potentially driving future adoption. The market's dynamics remain intriguing, with ongoing developments shaping its trajectory across various sectors.
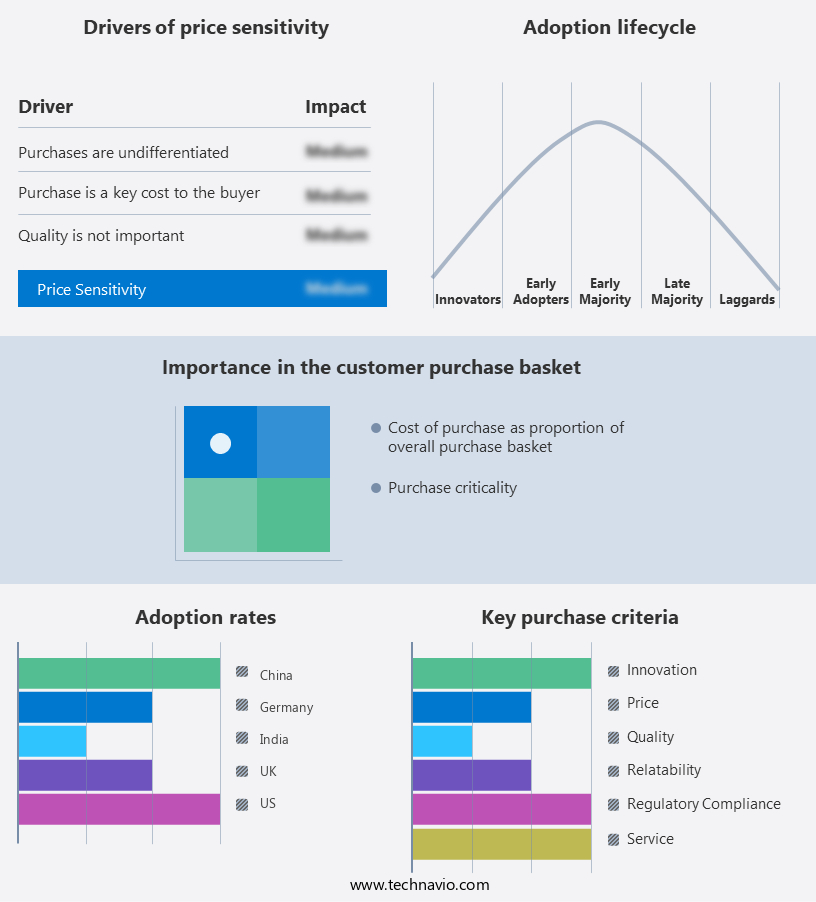
Exclusive Technavio Analysis on Customer Landscape
The electric bus market forecasting report includes the adoption lifecycle of the market, covering from the innovator's stage to the laggard's stage. It focuses on adoption rates in different regions based on penetration. Furthermore, the electric bus market report also includes key purchase criteria and drivers of price sensitivity to help companies evaluate and develop their market growth analysis strategies.

Customer Landscape of Electric Bus Industry
Competitive Landscape
Companies are implementing various strategies, such as strategic alliances, electric bus market forecast, partnerships, mergers and acquisitions, geographical expansion, and product/service launches, to enhance their presence in the industry.
The industry research and growth report includes detailed analyses of the competitive landscape of the market and information about key companies, including:
- Alexander Dennis Limited
- Anhui Ankai Automobile Co. Ltd.
- Blue Bird Corporation
- BYD Company Ltd.
- CAF (Construcciones y Auxiliar de Ferrocarriles)
- CRRC Corporation Limited
- Daimler AG
- EBusco
- Gillig LLC
- GreenPower Motor Company Inc.
- Higer Bus Company Limited
- King Long United Automotive Industry Co. Ltd.
- MAN SE
- New Flyer Industries Inc.
- Proterra Inc.
- Scania AB
- Solaris Bus & Coach S.A.
- VDL Bus & Coach BV
- Volvo Buses
- Zhengzhou Yutong Bus Co. Ltd.
Qualitative and quantitative analysis of companies has been conducted to help clients understand the wider business environment as well as the strengths and weaknesses of key industry players. Data is qualitatively analyzed to categorize companies as pure play, category-focused, industry-focused, and diversified; it is quantitatively analyzed to categorize companies as dominant, leading, strong, tentative, and weak.
Recent Development and News in Electric Bus Market
- In January 2024, Proterra, a leading electric bus manufacturer, announced the launch of its new Catalyst E2 Series buses, featuring an extended range of up to 665 kilometers on a single charge, a significant leap in electric bus technology (Proterra Press Release, 2024).
- In March 2025, BYD Company Limited, the world's largest electric bus manufacturer, formed a strategic partnership with Transdev, a global mobility operator, to deploy 1,000 electric buses in Europe and South America over the next five years (BYD Company Limited Press Release, 2025).
- In April 2025, New Flyer Industries, Inc., a major North American bus manufacturer, raised USD200 million in a senior secured notes offering to accelerate its electric bus production and expand its charging infrastructure (New Flyer Industries, Inc. SEC Filing, 2025).
- In May 2025, the European Union passed the Fit for 55 package, a set of legislative proposals to reduce greenhouse gas emissions by at least 55% by 2030, which includes incentives for the adoption of electric buses and other zero-emission vehicles (European Commission Press Release, 2025).
Dive into Technavio's robust research methodology, blending expert interviews, extensive data synthesis, and validated models for unparalleled Electric Bus Market insights. See full methodology.
Market Scope
|
Report Coverage
|
Details
|
Page number
|
245
|
Base year
|
2024
|
Historic period
|
2019-2023 |
Forecast period
|
2025-2029
|
Growth momentum & CAGR
|
Accelerate at a CAGR of 16.7%
|
Market growth 2025-2029
|
USD 25059.3 million
|
Market structure
|
Fragmented
|
YoY growth 2024-2025(%)
|
15.9
|
Key countries
|
US, Canada, Germany, UK, Italy, France, China, India, Japan, Brazil, Egypt, UAE, Oman, Argentina, KSA, UAE, Brazil, and Rest of World (ROW)
|
Competitive landscape
|
Leading Companies, Market Positioning of Companies, Competitive Strategies, and Industry Risks
|
Request Free Sample
Research Analyst Overview
- Amidst the global shift towards sustainable transportation, the market continues to evolve, driven by advancements in charging infrastructure, motor technology, and energy management systems. Charging station deployment has become a critical focus, with predictive maintenance ensuring optimal performance and minimizing downtime. Traction motor efficiency, a key performance indicator, is continually improving, thanks to motor control algorithms and DC fast charging technology. Energy consumption modeling and route optimization algorithms are essential tools for fleet operators, enabling them to maximize efficiency and reduce operational costs. Auxiliary power systems, battery pack design, and noise reduction technology contribute to enhancing passenger comfort and reducing the environmental impact of electric buses.
- Power electronics efficiency and regenerative braking systems play a significant role in minimizing energy loss and extending range. The electrification of bus infrastructure, including inverter technology and smart charging systems, is crucial for accommodating the increasing adoption of battery electric buses and electrification conversion kits. Emission reduction standards and the integration of onboard energy storage and battery management systems are shaping the future of electric buses. Lightweight bus materials, fleet management software, and thermal management systems further contribute to the growing appeal of these vehicles. Grid impact assessment and wireless charging technology are emerging trends, with the potential to revolutionize the market by addressing range anxiety and reducing the need for traditional charging infrastructure.
- In the realm of electric motor technology, advancements in electrification strategies and power electronics are paving the way for more efficient and cost-effective solutions.
What are the Key Data Covered in this Electric Bus Market Research and Growth Report?
-
What is the expected growth of the Electric Bus Market between 2025 and 2029?
-
What segmentation does the market report cover?
-
The report is segmented by Application (Intercity and Intra city), Type (Pure electric bus and Plug-in hybrid bus), Speed (Less than 200 Miles and More than 200 Miles), Capacity (Up to 400 kWh and Above 400 kWh), Product Type (Semi-autonomous and Autonomous), Geography (APAC, Europe, North America, Middle East and Africa, and South America), Propulsion Type (Battery Electric Bus (BEV), Hybrid Electric Bus (HEV), and Fuel Cell Electric Bus (FCEV)), and Battery Type (Lithium-Ion, Nickel-Metal Hydride, and Others)
-
Which regions are analyzed in the report?
-
APAC, Europe, North America, Middle East and Africa, and South America
-
What are the key growth drivers and market challenges?
-
Who are the major players in the Electric Bus Market?
-
Alexander Dennis Limited, Anhui Ankai Automobile Co. Ltd., Blue Bird Corporation, BYD Company Ltd., CAF (Construcciones y Auxiliar de Ferrocarriles), CRRC Corporation Limited, Daimler AG, EBusco, Gillig LLC, GreenPower Motor Company Inc., Higer Bus Company Limited, King Long United Automotive Industry Co. Ltd., MAN SE, New Flyer Industries Inc., Proterra Inc., Scania AB, Solaris Bus & Coach S.A., VDL Bus & Coach BV, Volvo Buses, and Zhengzhou Yutong Bus Co. Ltd.
Market Research Insights
- The market is a dynamic and evolving sector within the broader transportation industry, characterized by ongoing advancements in technology and infrastructure. Two significant aspects of this market include the cost of charging infrastructure and the integration of passenger information systems. According to industry estimates, charging infrastructure costs have decreased by 30% over the past five years, making electric buses increasingly competitive with their diesel counterparts. Meanwhile, the adoption of advanced passenger information systems has improved operational efficiency and user experience, with over 70% of new electric buses now featuring real-time tracking and communication capabilities. Battery cell chemistry, electrification strategies, bus fleet electrification, and maintenance scheduling are other crucial elements shaping the market.
- Range anxiety mitigation through fast charging networks and powertrain integration are essential for the widespread adoption of electric buses in urban transport solutions. Sustainable transportation initiatives, accessibility features, and the integration of renewable energy sources further underscore the importance of this market. Challenges, such as electrification costs, battery life expectancy, public transit planning, and energy recovery systems, continue to be addressed through innovative solutions like battery recycling processes, smart charging algorithms, and grid stability solutions. The ongoing development of electric bus technology is a testament to the industry's commitment to providing efficient, sustainable, and accessible transportation solutions.
We can help! Our analysts can customize this electric bus market research report to meet your requirements.
Get in touch
1 Executive Summary
- 1.1 Market overview
- Executive Summary - Chart on Market Overview
- Executive Summary - Data Table on Market Overview
- Executive Summary - Chart on Global Market Characteristics
- Executive Summary - Chart on Market by Geography
- Executive Summary - Chart on Market Segmentation by Application
- Executive Summary - Chart on Market Segmentation by Type
- Executive Summary - Chart on Market Segmentation by Speed
- Executive Summary - Chart on Market Segmentation by Capacity
- Executive Summary - Chart on Market Segmentation by Product Type
- Executive Summary - Chart on Incremental Growth
- Executive Summary - Data Table on Incremental Growth
- Executive Summary - Chart on Company Market Positioning
2 Technavio Analysis
- 2.1 Analysis of price sensitivity, lifecycle, customer purchase basket, adoption rates, and purchase criteria
- Analysis of price sensitivity, lifecycle, customer purchase basket, adoption rates, and purchase criteria
- 2.2 Criticality of inputs and Factors of differentiation
- Overview on criticality of inputs and factors of differentiation
- 2.3 Factors of disruption
- Overview on factors of disruption
- 2.4 Impact of drivers and challenges
- Impact of drivers and challenges in 2024 and 2029
3 Market Landscape
- 3.1 Market ecosystem
- Parent Market
- Data Table on - Parent Market
- 3.2 Market characteristics
- Market characteristics analysis
4 Market Sizing
- 4.1 Market definition
- Offerings of companies included in the market definition
- 4.2 Market segment analysis
- 4.4 Market outlook: Forecast for 2024-2029
- Chart on Global - Market size and forecast 2024-2029 ($ million)
- Data Table on Global - Market size and forecast 2024-2029 ($ million)
- Chart on Global Market: Year-over-year growth 2024-2029 (%)
- Data Table on Global Market: Year-over-year growth 2024-2029 (%)
5 Historic Market Size
- 5.1 Global Electric Bus Market 2019 - 2023
- Historic Market Size - Data Table on Global Electric Bus Market 2019 - 2023 ($ million)
- 5.2 Application segment analysis 2019 - 2023
- Historic Market Size - Application Segment 2019 - 2023 ($ million)
- 5.3 Type segment analysis 2019 - 2023
- Historic Market Size - Type Segment 2019 - 2023 ($ million)
- 5.4 Speed segment analysis 2019 - 2023
- Historic Market Size - Speed Segment 2019 - 2023 ($ million)
- 5.5 Capacity segment analysis 2019 - 2023
- Historic Market Size - Capacity Segment 2019 - 2023 ($ million)
- 5.6 Product Type segment analysis 2019 - 2023
- Historic Market Size - Product Type Segment 2019 - 2023 ($ million)
- 5.7 Geography segment analysis 2019 - 2023
- Historic Market Size - Geography Segment 2019 - 2023 ($ million)
- 5.8 Country segment analysis 2019 - 2023
- Historic Market Size - Country Segment 2019 - 2023 ($ million)
6 Qualitative Analysis
- 6.1 Impact of AI in global electric bus market
7 Five Forces Analysis
- 7.1 Five forces summary
- Five forces analysis - Comparison between 2024 and 2029
- 7.2 Bargaining power of buyers
- Bargaining power of buyers - Impact of key factors 2024 and 2029
- 7.3 Bargaining power of suppliers
- Bargaining power of suppliers - Impact of key factors in 2024 and 2029
- 7.4 Threat of new entrants
- Threat of new entrants - Impact of key factors in 2024 and 2029
- 7.5 Threat of substitutes
- Threat of substitutes - Impact of key factors in 2024 and 2029
- 7.6 Threat of rivalry
- Threat of rivalry - Impact of key factors in 2024 and 2029
- 7.7 Market condition
- Chart on Market condition - Five forces 2024 and 2029
8 Market Segmentation by Application
- 8.1 Market segments
- Chart on Application - Market share (2024-2029) (%)
- Data Table on Application - Market share (2024-2029) (%)
- 8.2 Comparison by Application
- Chart on Comparison by Application
- Data Table on Comparison by Application
- 8.3 Intercity - Market size and forecast (2024-2029)
- Chart on Intercity - Market size and forecast (2024-2029) ($ million)
- Data Table on Intercity - Market size and forecast (2024-2029) ($ million)
- Chart on Intercity - Year-over-year growth (2024-2029) (%)
- Data Table on Intercity - Year-over-year growth (2024-2029) (%)
- 8.4 Intra city - Market size and forecast (2024-2029)
- Chart on Intra city - Market size and forecast (2024-2029) ($ million)
- Data Table on Intra city - Market size and forecast (2024-2029) ($ million)
- Chart on Intra city - Year-over-year growth (2024-2029) (%)
- Data Table on Intra city - Year-over-year growth (2024-2029) (%)
- 8.5 Market opportunity by Application
- Market opportunity by Application ($ million)
- Data Table on Market opportunity by Application ($ million)
9 Market Segmentation by Type
- 9.1 Market segments
- Chart on Type - Market share (2024-2029) (%)
- Data Table on Type - Market share (2024-2029) (%)
- 9.2 Comparison by Type
- Chart on Comparison by Type
- Data Table on Comparison by Type
- 9.3 Pure electric bus - Market size and forecast (2024-2029)
- Chart on Pure electric bus - Market size and forecast (2024-2029) ($ million)
- Data Table on Pure electric bus - Market size and forecast (2024-2029) ($ million)
- Chart on Pure electric bus - Year-over-year growth (2024-2029) (%)
- Data Table on Pure electric bus - Year-over-year growth (2024-2029) (%)
- 9.4 Plug-in hybrid bus - Market size and forecast (2024-2029)
- Chart on Plug-in hybrid bus - Market size and forecast (2024-2029) ($ million)
- Data Table on Plug-in hybrid bus - Market size and forecast (2024-2029) ($ million)
- Chart on Plug-in hybrid bus - Year-over-year growth (2024-2029) (%)
- Data Table on Plug-in hybrid bus - Year-over-year growth (2024-2029) (%)
- 9.5 Market opportunity by Type
- Market opportunity by Type ($ million)
- Data Table on Market opportunity by Type ($ million)
10 Market Segmentation by Speed
- 10.1 Market segments
- Chart on Speed - Market share (2024-2029) (%)
- Data Table on Speed - Market share (2024-2029) (%)
- 10.2 Comparison by Speed
- Chart on Comparison by Speed
- Data Table on Comparison by Speed
- 10.3 Less than 200 Miles - Market size and forecast (2024-2029)
- Chart on Less than 200 Miles - Market size and forecast (2024-2029) ($ million)
- Data Table on Less than 200 Miles - Market size and forecast (2024-2029) ($ million)
- Chart on Less than 200 Miles - Year-over-year growth (2024-2029) (%)
- Data Table on Less than 200 Miles - Year-over-year growth (2024-2029) (%)
- 10.4 More than 200 Miles - Market size and forecast (2024-2029)
- Chart on More than 200 Miles - Market size and forecast (2024-2029) ($ million)
- Data Table on More than 200 Miles - Market size and forecast (2024-2029) ($ million)
- Chart on More than 200 Miles - Year-over-year growth (2024-2029) (%)
- Data Table on More than 200 Miles - Year-over-year growth (2024-2029) (%)
- 10.5 Market opportunity by Speed
- Market opportunity by Speed ($ million)
- Data Table on Market opportunity by Speed ($ million)
11 Market Segmentation by Capacity
- 11.1 Market segments
- Chart on Capacity - Market share (2024-2029) (%)
- Data Table on Capacity - Market share (2024-2029) (%)
- 11.2 Comparison by Capacity
- Chart on Comparison by Capacity
- Data Table on Comparison by Capacity
- 11.3 Up to 400 kWh - Market size and forecast (2024-2029)
- Chart on Up to 400 kWh - Market size and forecast (2024-2029) ($ million)
- Data Table on Up to 400 kWh - Market size and forecast (2024-2029) ($ million)
- Chart on Up to 400 kWh - Year-over-year growth (2024-2029) (%)
- Data Table on Up to 400 kWh - Year-over-year growth (2024-2029) (%)
- 11.4 Above 400 kWh - Market size and forecast (2024-2029)
- Chart on Above 400 kWh - Market size and forecast (2024-2029) ($ million)
- Data Table on Above 400 kWh - Market size and forecast (2024-2029) ($ million)
- Chart on Above 400 kWh - Year-over-year growth (2024-2029) (%)
- Data Table on Above 400 kWh - Year-over-year growth (2024-2029) (%)
- 11.5 Market opportunity by Capacity
- Market opportunity by Capacity ($ million)
- Data Table on Market opportunity by Capacity ($ million)
12 Market Segmentation by Product Type
- 12.1 Market segments
- Chart on Product Type - Market share (2024-2029) (%)
- Data Table on Product Type - Market share (2024-2029) (%)
- 12.2 Comparison by Product Type
- Chart on Comparison by Product Type
- Data Table on Comparison by Product Type
- 12.3 Semi-autonomous - Market size and forecast (2024-2029)
- Chart on Semi-autonomous - Market size and forecast (2024-2029) ($ million)
- Data Table on Semi-autonomous - Market size and forecast (2024-2029) ($ million)
- Chart on Semi-autonomous - Year-over-year growth (2024-2029) (%)
- Data Table on Semi-autonomous - Year-over-year growth (2024-2029) (%)
- 12.4 Autonomous - Market size and forecast (2024-2029)
- Chart on Autonomous - Market size and forecast (2024-2029) ($ million)
- Data Table on Autonomous - Market size and forecast (2024-2029) ($ million)
- Chart on Autonomous - Year-over-year growth (2024-2029) (%)
- Data Table on Autonomous - Year-over-year growth (2024-2029) (%)
- 12.5 Market opportunity by Product Type
- Market opportunity by Product Type ($ million)
- Data Table on Market opportunity by Product Type ($ million)
13 Market Segmentation by Propulsion Type
- 13.1 Market segments
- Chart on Propulsion Type - Market share (2024-2029) (%)
- Data Table on Propulsion Type - Market share (2024-2029) (%)
- 13.2 Comparison by Propulsion Type
- Chart on Comparison by Propulsion Type
- Data Table on Comparison by Propulsion Type
- 13.3 Battery Electric Bus (BEV) - Market size and forecast (2024-2029)
- Chart on Battery Electric Bus (BEV) - Market size and forecast (2024-2029) ($ million)
- Data Table on Battery Electric Bus (BEV) - Market size and forecast (2024-2029) ($ million)
- Chart on Battery Electric Bus (BEV) - Year-over-year growth (2024-2029) (%)
- Data Table on Battery Electric Bus (BEV) - Year-over-year growth (2024-2029) (%)
- 13.4 Hybrid Electric Bus (HEV) - Market size and forecast (2024-2029)
- Chart on Hybrid Electric Bus (HEV) - Market size and forecast (2024-2029) ($ million)
- Data Table on Hybrid Electric Bus (HEV) - Market size and forecast (2024-2029) ($ million)
- Chart on Hybrid Electric Bus (HEV) - Year-over-year growth (2024-2029) (%)
- Data Table on Hybrid Electric Bus (HEV) - Year-over-year growth (2024-2029) (%)
- 13.5 Fuel Cell Electric Bus (FCEV) - Market size and forecast (2024-2029)
- Chart on Fuel Cell Electric Bus (FCEV) - Market size and forecast (2024-2029) ($ million)
- Data Table on Fuel Cell Electric Bus (FCEV) - Market size and forecast (2024-2029) ($ million)
- Chart on Fuel Cell Electric Bus (FCEV) - Year-over-year growth (2024-2029) (%)
- Data Table on Fuel Cell Electric Bus (FCEV) - Year-over-year growth (2024-2029) (%)
- 13.6 Market opportunity by Propulsion Type
- Market opportunity by Propulsion Type ($ million)
- Data Table on Market opportunity by Propulsion Type ($ million)
14 Market Segmentation by Battery Type
- 14.1 Market segments
- Chart on Battery Type - Market share (2024-2029) (%)
- Data Table on Battery Type - Market share (2024-2029) (%)
- 14.2 Comparison by Battery Type
- Chart on Comparison by Battery Type
- Data Table on Comparison by Battery Type
- 14.3 Lithium-Ion - Market size and forecast (2024-2029)
- Chart on Lithium-Ion - Market size and forecast (2024-2029) ($ million)
- Data Table on Lithium-Ion - Market size and forecast (2024-2029) ($ million)
- Chart on Lithium-Ion - Year-over-year growth (2024-2029) (%)
- Data Table on Lithium-Ion - Year-over-year growth (2024-2029) (%)
- 14.4 Nickel-Metal Hydride - Market size and forecast (2024-2029)
- Chart on Nickel-Metal Hydride - Market size and forecast (2024-2029) ($ million)
- Data Table on Nickel-Metal Hydride - Market size and forecast (2024-2029) ($ million)
- Chart on Nickel-Metal Hydride - Year-over-year growth (2024-2029) (%)
- Data Table on Nickel-Metal Hydride - Year-over-year growth (2024-2029) (%)
- 14.5 Others - Market size and forecast (2024-2029)
- Chart on Others - Market size and forecast (2024-2029) ($ million)
- Data Table on Others - Market size and forecast (2024-2029) ($ million)
- Chart on Others - Year-over-year growth (2024-2029) (%)
- Data Table on Others - Year-over-year growth (2024-2029) (%)
- 14.6 Market opportunity by Battery Type
- Market opportunity by Battery Type ($ million)
- Data Table on Market opportunity by Battery Type ($ million)
15 Customer Landscape
- 15.1 Customer landscape overview
- Analysis of price sensitivity, lifecycle, customer purchase basket, adoption rates, and purchase criteria
16 Geographic Landscape
- 16.1 Geographic segmentation
- Chart on Market share by geography 2024-2029 (%)
- Data Table on Market share by geography 2024-2029 (%)
- 16.2 Geographic comparison
- Chart on Geographic comparison
- Data Table on Geographic comparison
- 16.3 APAC - Market size and forecast 2024-2029
- Chart on APAC - Market size and forecast 2024-2029 ($ million)
- Data Table on APAC - Market size and forecast 2024-2029 ($ million)
- Chart on APAC - Year-over-year growth 2024-2029 (%)
- Data Table on APAC - Year-over-year growth 2024-2029 (%)
- 16.4 Europe - Market size and forecast 2024-2029
- Chart on Europe - Market size and forecast 2024-2029 ($ million)
- Data Table on Europe - Market size and forecast 2024-2029 ($ million)
- Chart on Europe - Year-over-year growth 2024-2029 (%)
- Data Table on Europe - Year-over-year growth 2024-2029 (%)
- 16.5 North America - Market size and forecast 2024-2029
- Chart on North America - Market size and forecast 2024-2029 ($ million)
- Data Table on North America - Market size and forecast 2024-2029 ($ million)
- Chart on North America - Year-over-year growth 2024-2029 (%)
- Data Table on North America - Year-over-year growth 2024-2029 (%)
- 16.6 Middle East and Africa - Market size and forecast 2024-2029
- Chart on Middle East and Africa - Market size and forecast 2024-2029 ($ million)
- Data Table on Middle East and Africa - Market size and forecast 2024-2029 ($ million)
- Chart on Middle East and Africa - Year-over-year growth 2024-2029 (%)
- Data Table on Middle East and Africa - Year-over-year growth 2024-2029 (%)
- 16.7 South America - Market size and forecast 2024-2029
- Chart on South America - Market size and forecast 2024-2029 ($ million)
- Data Table on South America - Market size and forecast 2024-2029 ($ million)
- Chart on South America - Year-over-year growth 2024-2029 (%)
- Data Table on South America - Year-over-year growth 2024-2029 (%)
- 16.8 China - Market size and forecast 2024-2029
- Chart on China - Market size and forecast 2024-2029 ($ million)
- Data Table on China - Market size and forecast 2024-2029 ($ million)
- Chart on China - Year-over-year growth 2024-2029 (%)
- Data Table on China - Year-over-year growth 2024-2029 (%)
- 16.9 Japan - Market size and forecast 2024-2029
- Chart on Japan - Market size and forecast 2024-2029 ($ million)
- Data Table on Japan - Market size and forecast 2024-2029 ($ million)
- Chart on Japan - Year-over-year growth 2024-2029 (%)
- Data Table on Japan - Year-over-year growth 2024-2029 (%)
- 16.10 India - Market size and forecast 2024-2029
- Chart on India - Market size and forecast 2024-2029 ($ million)
- Data Table on India - Market size and forecast 2024-2029 ($ million)
- Chart on India - Year-over-year growth 2024-2029 (%)
- Data Table on India - Year-over-year growth 2024-2029 (%)
- 16.11 South Korea - Market size and forecast 2024-2029
- Chart on South Korea - Market size and forecast 2024-2029 ($ million)
- Data Table on South Korea - Market size and forecast 2024-2029 ($ million)
- Chart on South Korea - Year-over-year growth 2024-2029 (%)
- Data Table on South Korea - Year-over-year growth 2024-2029 (%)
- 16.12 Australia - Market size and forecast 2024-2029
- Chart on Australia - Market size and forecast 2024-2029 ($ million)
- Data Table on Australia - Market size and forecast 2024-2029 ($ million)
- Chart on Australia - Year-over-year growth 2024-2029 (%)
- Data Table on Australia - Year-over-year growth 2024-2029 (%)
- 16.13 US - Market size and forecast 2024-2029
- Chart on US - Market size and forecast 2024-2029 ($ million)
- Data Table on US - Market size and forecast 2024-2029 ($ million)
- Chart on US - Year-over-year growth 2024-2029 (%)
- Data Table on US - Year-over-year growth 2024-2029 (%)
- 16.14 Germany - Market size and forecast 2024-2029
- Chart on Germany - Market size and forecast 2024-2029 ($ million)
- Data Table on Germany - Market size and forecast 2024-2029 ($ million)
- Chart on Germany - Year-over-year growth 2024-2029 (%)
- Data Table on Germany - Year-over-year growth 2024-2029 (%)
- 16.15 UK - Market size and forecast 2024-2029
- Chart on UK - Market size and forecast 2024-2029 ($ million)
- Data Table on UK - Market size and forecast 2024-2029 ($ million)
- Chart on UK - Year-over-year growth 2024-2029 (%)
- Data Table on UK - Year-over-year growth 2024-2029 (%)
- 16.16 Brazil - Market size and forecast 2024-2029
- Chart on Brazil - Market size and forecast 2024-2029 ($ million)
- Data Table on Brazil - Market size and forecast 2024-2029 ($ million)
- Chart on Brazil - Year-over-year growth 2024-2029 (%)
- Data Table on Brazil - Year-over-year growth 2024-2029 (%)
- 16.17 Canada - Market size and forecast 2024-2029
- Chart on Canada - Market size and forecast 2024-2029 ($ million)
- Data Table on Canada - Market size and forecast 2024-2029 ($ million)
- Chart on Canada - Year-over-year growth 2024-2029 (%)
- Data Table on Canada - Year-over-year growth 2024-2029 (%)
- 16.18 Market opportunity by geography
- Market opportunity by geography ($ million)
- Data Tables on Market opportunity by geography ($ million)
- 16.19 Italy - Market size and forecast (2024-2029)
- Chart on Italy - Market size and forecast (2024-2029) ($ million)
- Data Table on Italy - Market size and forecast (2024-2029) ($ million)
- Chart on Italy - Year-over-year growth (2024-2029) (%)
- Data Table on Italy - Year-over-year growth (2024-2029) (%)
- 16.20 France - Market size and forecast (2024-2029)
- Chart on France - Market size and forecast (2024-2029) ($ million)
- Data Table on France - Market size and forecast (2024-2029) ($ million)
- Chart on France - Year-over-year growth (2024-2029) (%)
- Data Table on France - Year-over-year growth (2024-2029) (%)
- 16.21 Egypt - Market size and forecast (2024-2029)
- Chart on Egypt - Market size and forecast (2024-2029) ($ million)
- Data Table on Egypt - Market size and forecast (2024-2029) ($ million)
- Chart on Egypt - Year-over-year growth (2024-2029) (%)
- Data Table on Egypt - Year-over-year growth (2024-2029) (%)
- 16.22 UAE - Market size and forecast (2024-2029)
- Chart on UAE - Market size and forecast (2024-2029) ($ million)
- Data Table on UAE - Market size and forecast (2024-2029) ($ million)
- Chart on UAE - Year-over-year growth (2024-2029) (%)
- Data Table on UAE - Year-over-year growth (2024-2029) (%)
- 16.23 Oman - Market size and forecast (2024-2029)
- Chart on Oman - Market size and forecast (2024-2029) ($ million)
- Data Table on Oman - Market size and forecast (2024-2029) ($ million)
- Chart on Oman - Year-over-year growth (2024-2029) (%)
- Data Table on Oman - Year-over-year growth (2024-2029) (%)
- 16.24 Argentina - Market size and forecast (2024-2029)
- Chart on Argentina - Market size and forecast (2024-2029) ($ million)
- Data Table on Argentina - Market size and forecast (2024-2029) ($ million)
- Chart on Argentina - Year-over-year growth (2024-2029) (%)
- Data Table on Argentina - Year-over-year growth (2024-2029) (%)
- 16.25 KSA - Market size and forecast (2024-2029)
- Chart on KSA - Market size and forecast (2024-2029) ($ million)
- Data Table on KSA - Market size and forecast (2024-2029) ($ million)
- Chart on KSA - Year-over-year growth (2024-2029) (%)
- Data Table on KSA - Year-over-year growth (2024-2029) (%)
- 16.26 Rest of World (ROW) - Market size and forecast (2024-2029)
- Chart on Rest of World (ROW) - Market size and forecast (2024-2029) ($ million)
- Data Table on Rest of World (ROW) - Market size and forecast (2024-2029) ($ million)
- Chart on Rest of World (ROW) - Year-over-year growth (2024-2029) (%)
- Data Table on Rest of World (ROW) - Year-over-year growth (2024-2029) (%)
17 Drivers, Challenges, and Opportunity/Restraints
- 17.3 Impact of drivers and challenges
- Impact of drivers and challenges in 2024 and 2029
- 17.4 Market opportunities/restraints
18 Competitive Landscape
- 18.2 Competitive Landscape
- Overview on criticality of inputs and factors of differentiation
- 18.3 Landscape disruption
- Overview on factors of disruption
- 18.4 Industry risks
- Impact of key risks on business
19 Competitive Analysis
- 19.2 Market positioning of companies
- Matrix on companies position and classification
- 19.3 Alexander Dennis Limited
- Alexander Dennis Limited - Overview
- Alexander Dennis Limited - Product / Service
- Alexander Dennis Limited - Key offerings
- 19.4 Anhui Ankai Automobile Co. Ltd.
- Anhui Ankai Automobile Co. Ltd. - Overview
- Anhui Ankai Automobile Co. Ltd. - Product / Service
- Anhui Ankai Automobile Co. Ltd. - Key offerings
- 19.5 Blue Bird Corporation
- Blue Bird Corporation - Overview
- Blue Bird Corporation - Product / Service
- Blue Bird Corporation - Key offerings
- 19.6 BYD Company Ltd.
- BYD Company Ltd. - Overview
- BYD Company Ltd. - Product / Service
- BYD Company Ltd. - Key offerings
- 19.7 CAF (Construcciones y Auxiliar de Ferrocarriles)
- CAF (Construcciones y Auxiliar de Ferrocarriles) - Overview
- CAF (Construcciones y Auxiliar de Ferrocarriles) - Product / Service
- CAF (Construcciones y Auxiliar de Ferrocarriles) - Key offerings
- 19.8 CRRC Corporation Limited
- CRRC Corporation Limited - Overview
- CRRC Corporation Limited - Product / Service
- CRRC Corporation Limited - Key offerings
- 19.9 Daimler AG
- Daimler AG - Overview
- Daimler AG - Product / Service
- Daimler AG - Key offerings
- 19.10 EBusco
- EBusco - Overview
- EBusco - Product / Service
- EBusco - Key offerings
- 19.11 Gillig LLC
- Gillig LLC - Overview
- Gillig LLC - Product / Service
- Gillig LLC - Key offerings
- 19.12 GreenPower Motor Company Inc.
- GreenPower Motor Company Inc. - Overview
- GreenPower Motor Company Inc. - Product / Service
- GreenPower Motor Company Inc. - Key offerings
- 19.13 Higer Bus Company Limited
- Higer Bus Company Limited - Overview
- Higer Bus Company Limited - Product / Service
- Higer Bus Company Limited - Key offerings
- 19.14 King Long United Automotive Industry Co. Ltd.
- King Long United Automotive Industry Co. Ltd. - Overview
- King Long United Automotive Industry Co. Ltd. - Product / Service
- King Long United Automotive Industry Co. Ltd. - Key offerings
- 19.15 MAN SE
- MAN SE - Overview
- MAN SE - Product / Service
- MAN SE - Key offerings
- 19.16 New Flyer Industries Inc.
- New Flyer Industries Inc. - Overview
- New Flyer Industries Inc. - Product / Service
- New Flyer Industries Inc. - Key offerings
- 19.17 Proterra Inc.
- Proterra Inc. - Overview
- Proterra Inc. - Product / Service
- Proterra Inc. - Key offerings
- 19.18 Scania AB
- Scania AB - Overview
- Scania AB - Product / Service
- Scania AB - Key offerings
- 19.19 Solaris Bus & Coach S.A.
- Solaris Bus & Coach S.A. - Overview
- Solaris Bus & Coach S.A. - Product / Service
- Solaris Bus & Coach S.A. - Key offerings
- 19.20 VDL Bus & Coach BV
- VDL Bus & Coach BV - Overview
- VDL Bus & Coach BV - Product / Service
- VDL Bus & Coach BV - Key offerings
- 19.21 Volvo Buses
- Volvo Buses - Overview
- Volvo Buses - Product / Service
- Volvo Buses - Key offerings
- 19.22 Zhengzhou Yutong Bus Co. Ltd.
- Zhengzhou Yutong Bus Co. Ltd. - Overview
- Zhengzhou Yutong Bus Co. Ltd. - Product / Service
- Zhengzhou Yutong Bus Co. Ltd. - Key offerings
- 19.23 AB Volvo
- AB Volvo - Overview
- AB Volvo - Product / Service
- AB Volvo - Key offerings
- 19.24 BKM.BY
- BKM.BY - Overview
- BKM.BY - Product / Service
- BKM.BY - Key offerings
- 19.25 Bollore SE
- Bollore SE - Overview
- Bollore SE - Product / Service
- Bollore SE - Key offerings
- 19.26 BYD Co. Ltd.
- BYD Co. Ltd. - Overview
- BYD Co. Ltd. - Product / Service
- BYD Co. Ltd. - Key offerings
- 19.27 CNH Industrial NV
- CNH Industrial NV - Overview
- CNH Industrial NV - Product / Service
- CNH Industrial NV - Key offerings
- 19.28 Complete Coach Works
- Complete Coach Works - Overview
- Complete Coach Works - Product / Service
- Complete Coach Works - Key offerings
- 19.29 Eletra
- Eletra - Overview
- Eletra - Product / Service
- Eletra - Key offerings
- 19.30 GreenPower Motor Co. Inc.
- GreenPower Motor Co. Inc. - Overview
- GreenPower Motor Co. Inc. - Product / Service
- GreenPower Motor Co. Inc. - Key offerings
- 19.31 Hyundai Motor Co.
- Hyundai Motor Co. - Overview
- Hyundai Motor Co. - Product / Service
- Hyundai Motor Co. - Key offerings
- 19.32 Jiangsu Alfa Bus Co. Ltd.
- Jiangsu Alfa Bus Co. Ltd. - Overview
- Jiangsu Alfa Bus Co. Ltd. - Product / Service
- Jiangsu Alfa Bus Co. Ltd. - Key offerings
- 19.33 Mercedes Benz Group AG
- Mercedes Benz Group AG - Overview
- Mercedes Benz Group AG - Product / Service
- Mercedes Benz Group AG - Key offerings
- 19.34 NFI Group Inc.
- NFI Group Inc. - Overview
- NFI Group Inc. - Product / Service
- NFI Group Inc. - Key offerings
- 19.35 Proterra Inc.
- Proterra Inc. - Overview
- Proterra Inc. - Product / Service
- Proterra Inc. - Key offerings
- 19.36 Tata Motors Ltd.
- Tata Motors Ltd. - Overview
- Tata Motors Ltd. - Product / Service
- Tata Motors Ltd. - Key offerings
- 19.37 TECNOBUS Spa
- TECNOBUS Spa - Overview
- TECNOBUS Spa - Product / Service
- TECNOBUS Spa - Key offerings
20 Appendix
- 20.2 Inclusions and exclusions checklist
- Inclusions checklist
- Exclusions checklist
- 20.3 Currency conversion rates for US$
- Currency conversion rates for US$
- 20.4 Research methodology
- 20.7 Validation techniques employed for market sizing
- Validation techniques employed for market sizing
- 20.9 360 degree market analysis
- 360 degree market analysis
- 20.10 List of abbreviations