Electrostatic Precipitator System Market Size 2024-2028
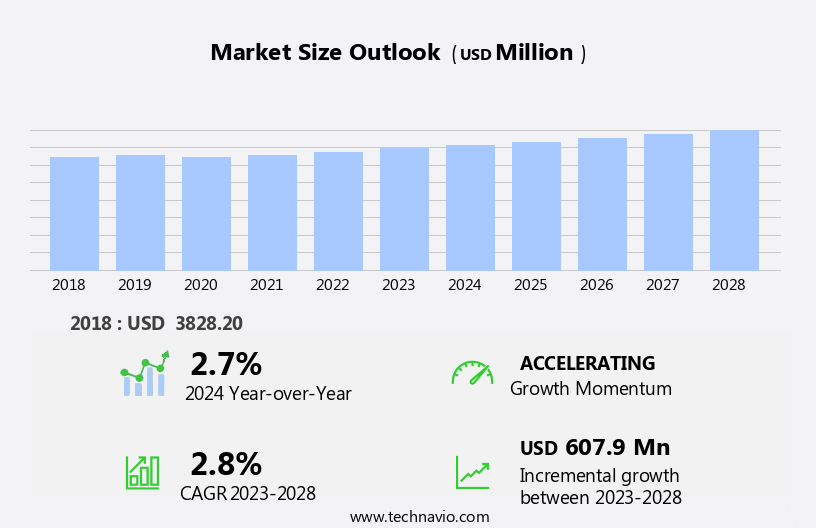
The electrostatic precipitator system market size is forecast to increase by USD 607.9 billion at a CAGR of 2.8% between 2023 and 2028.
- The market is witnessing significant growth due to its application in the removal of pollutants from various industries, particularly in the cement and steel sectors. This system utilizes high-voltage electrostatic charges to attract and precipitate particles from exhaust gases, making it an essential component in the adoption of clean energy sources. The market is driven by the increasing demand for dry systems as an alternative to wet scrubbing methods, which offer advantages such as lower water consumption and reduced sulfur dioxide emissions. However, the high cost of electrostatic precipitator systems remains a challenge for market growth. The introduction of smart electrostatic precipitator systems, which offer improved efficiency and reduced maintenance costs, presents an opportunity for market expansion.
What will be the Size of the Market During the Forecast Period?
- The Electrostatic Precipitator (ESP) system market is witnessing significant growth due to the increasing demand for advanced technologies in air quality management. These systems play a crucial role in controlling toxic pollutants and particulate matter, contributing to improved air quality and adherence to regulatory standards. ESP systems are integral to various industries, including power generation, cement, steel, chemicals, healthcare, petroleum, metallurgical industries, thermal power plants, and more. In these sectors, ESPs are employed to manage industrial emissions and ensure compliance with emission control regulations. The integration of digital technologies in ESP systems has led to the development of smart electrostatic precipitators and hybrid ESPs.
- These advanced technologies enable real-time monitoring, predictive maintenance, and optimization of ESP performance. The use of high-voltage electrostatic charges effectively captures and separates particulate emissions from exhaust gases, making ESP systems a vital component in sustainable development and the adoption of clean energy sources. The market for ESP systems is driven by the growing focus on renewable energy sources and the need for cleaner energy production. The increasing awareness of the health risks associated with air pollution and the desire to minimize the environmental impact of industrial processes are further fueling the demand for efficient and effective ESP systems.
- Moreover, the integration of digital controls in ESP systems allows for improved operational efficiency, reduced downtime, and enhanced system performance. This digital transformation is expected to continue shaping the ESP market, as industries strive for more sustainable and cost-effective solutions for air pollution control. In conclusion, the Electrostatic Precipitator Systems market is poised for continued growth as industries increasingly prioritize air quality management and the adoption of advanced technologies to address the challenges of industrial emissions and air pollution control. The integration of digital technologies and the focus on clean energy sources are key trends shaping the future of this market.
How is this market segmented and which is the largest segment?
The market research report provides comprehensive data (region-wise segment analysis), with forecasts and estimates in "USD million" for the period 2024-2028, as well as historical data from 2018-2022 for the following segments.
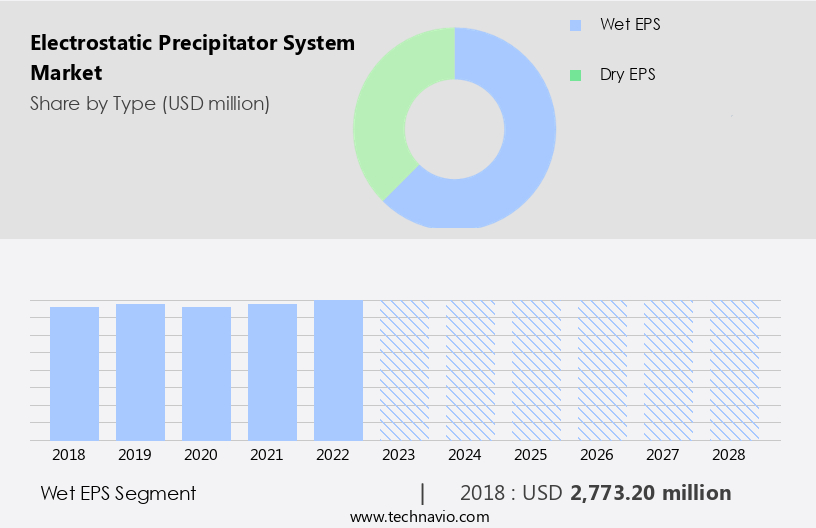
- Type
- Wet EPS
- Dry EPS
- Geography
- APAC
- China
- India
- Japan
- South Korea
- North America
- Canada
- US
- Europe
- Germany
- UK
- France
- Italy
- Middle East and Africa
- South America
- APAC
By Type Insights
- The wet EPS segment is estimated to witness significant growth during the forecast period.
Electrostatic Precipitator Systems (EPS), specifically smart electrostatic precipitators, play a crucial role in reducing emissions from clean energy sources, such as those used in the cement and steel industries. These systems effectively remove sulfur dioxide and other pollutants from exhaust gases through the application of high-voltage electrostatic charges. Dry EPS systems are commonly used for larger particles in flue gas streams, while wet EPS systems are more efficient for removing resin, oil, tar, and paint that are present in wet gas streams. Wet EPS systems, which consist of collectors continuously sprayed with water, are particularly effective for smaller particles that cannot be captured by dry precipitators.
Get a glance at the market report of share of various segments Request Free Sample
The Wet EPS segment was valued at USD 2.77 billion in 2018 and showed a gradual increase during the forecast period.
Regional Analysis
- APAC is estimated to contribute 33% to the growth of the global market during the forecast period.
Technavio's analysts have elaborately explained the regional trends and drivers that shape the market during the forecast period.

For more insights on the market share of various regions Request Free Sample
The market in North America is projected to expand due to the rising concern for respiratory and cardiovascular diseases caused by air pollution. With stringent emission standards in place, industries are increasingly retrofitting their systems with eco-friendly, energy-efficient solutions, such as dry electrostatic precipitators. These systems effectively reduce particulate matter emissions, contributing to improved air quality. Tubular and compact designs of electrostatic precipitators are gaining popularity due to their space-saving features and high efficiency rates. As industries in sectors like transportation, energy, and manufacturing continue to expand in the region, the demand for these systems is expected to increase significantly. Consequently, the electrostatic precipitator market in North America is poised for substantial growth during the forecast period.
Market Dynamics
Our researchers analyzed the data with 2023 as the base year, along with the key drivers, trends, and challenges. A holistic analysis of drivers will help companies refine their marketing strategies to gain a competitive advantage.
What are the key market drivers leading to the rise in adoption of Electrostatic Precipitator System Market?
Used in the removal of pollutants is the key driver of the market.
- Electrostatic precipitator systems play a crucial role in various industries, including metal processing, mining, manufacturing, marine, and healthcare, by eliminating airborne pollutants. These systems effectively remove particulate matter from contaminated air, achieving a control efficiency of up to 99% for particles larger than or equal to 1.0 microns in diameter. They can handle vast gas volumes at varying temperatures and flow rates, making them suitable for removing solid particles and liquid droplets.
- Dry electrostatic precipitators operate above the gas stream's dew point to purify smoke and dust. The systems ionize the air using high-voltage electrodes, causing dust particles to get charged by the ionized air and subsequently collect on oppositely charged collecting plates.In industries reliant on fossil fuels and petroleum, electrostatic precipitator systems help mitigate air pollution and reduce carbon emissions, contributing to improved environmental and public health. Such factors will increase the market growth during the forecast period.
What are the market trends shaping the Electrostatic Precipitator System Market?
Introduction of smart electrostatic precipitator system is the upcoming trend in the market.
- In response to the escalating need for effective air quality management and the reduction of toxic pollutants, the market for advanced electrostatic precipitator systems is experiencing significant growth. These systems, which are instrumental in air pollution control, employ sophisticated technologies to capture and eliminate particulate matter. As the emphasis on sustainable development and renewable energy sources continues to increase, hybrid electrostatic precipitators are gaining popularity. Smart electrostatic precipitator systems are the latest innovation in this field. Designed with the end-user in mind, these systems offer a range of features that enhance user experience. Energy Star certification ensures energy efficiency, while automated maintenance and alert systems minimize hassle and manual intervention.
- These features not only improve the comfort of users but also contribute to the overall sustainability of the system. In conclusion, the market for electrostatic precipitator systems presents a lucrative opportunity for companies to introduce innovative, user-friendly, and aesthetically pleasing solutions. Smart electrostatic precipitator systems, in particular, are poised to revolutionize the industry with their advanced features and commitment to energy savings and hassle-free maintenance. By focusing on these aspects, companies can cater to the evolving needs of consumers and contribute to the ongoing efforts to improve air quality and promote sustainable development. Such
What challenges does the Electrostatic Precipitator System Market face during its growth?
The high cost of electrostatic precipitator systems is a key challenge affecting the market growth.
- Electrostatic precipitator systems play a crucial role in emission control across numerous industries, including metallurgical industries and thermal power plants. The installation of these systems incurs significant expenses, with testing costs being one component. Testing involves determining the optimal electrostatic precipitator system for a specific application. Moreover, the high initial capital investment required for electrostatic precipitator systems poses a challenge for small and medium-sized enterprises. The cost of equipment, which includes installation and maintenance, is another considerable expense. Operation and maintenance costs are also substantial, with an average annual expense of USD 12,000 to USD 21,000 per cubic meter per second.
- In the context of industrial emissions, electrostatic precipitator systems are essential for meeting regulatory requirements. Two-stage precipitators, a type of electrostatic precipitator, offer enhanced performance and efficiency. As the demand for emission control solutions continues to grow, the market for electrostatic precipitator systems is expected to expand. For businesses considering implementing an electrostatic precipitator system, it is essential to factor in these costs and assess their return on investment. Professional assistance from industry experts can help in making informed decisions and optimizing the system's performance. Such factors will hinder the market growth during the forecast period.
Exclusive Customer Landscape
The market forecasting report includes the adoption lifecycle of the market, covering from the innovator's stage to the laggard's stage. It focuses on adoption rates in different regions based on penetration. Furthermore, the market report also includes key purchase criteria and drivers of price sensitivity to help companies evaluate and develop their market growth analysis strategies.

Customer Landscape
Key Companies & Market Insights
Companies are implementing various strategies, such as strategic alliances, market forecast, partnerships, mergers and acquisitions, geographical expansion, and product/service launches, to enhance their presence in the market.
The market research and growth report includes detailed analyses of the competitive landscape of the market and information about key companies, including:
- Babcock and Wilcox Enterprises Inc.
- Beltran Technologies Inc.
- Clean Tunnel Air International AS
- Ducon
- Durr AG
- Envitech Inc.
- FLSmidth and Co. AS
- GEECO Enercon Pvt. Ltd.
- General Electric Co.
- Hamon S.A.
- John Wood Group PLC
- Johnson Controls International Plc
- Mitsubishi Heavy Industries Ltd.
- Siemens AG
- Sumitomo Heavy Industries Ltd.
- Thermax Ltd.
Qualitative and quantitative analysis of companies has been conducted to help clients understand the wider business environment as well as the strengths and weaknesses of key market players. Data is qualitatively analyzed to categorize companies as pure play, category-focused, industry-focused, and diversified; it is quantitatively analyzed to categorize companies as dominant, leading, strong, tentative, and weak.
Research Analyst Overview
The electrostatic precipitator (ESP) system market is witnessing significant growth due to the increasing focus on air quality management in various industries. Toxic pollutants, such as particulate matter, are major contributors to air pollution, leading to respiratory diseases and cardiovascular diseases. To mitigate these health concerns, advanced technologies like ESPs are being adopted for air pollution control in power generation, cement, steel, chemicals, and other industries. ESP systems utilize high-voltage electrostatic charges to remove particulate emissions from flue gas streams. These systems are essential for industries that produce sulfur dioxide emissions and exhaust gases from fossil fuels, such as thermal power plants and cement and steel manufacturing. The market is witnessing several ESP technology advancements, including the development of hybrid and smart electrostatic precipitators.
Moreover, these advanced ESPs offer compact designs, eco-friendly solutions, and energy-efficient operations. The integration of digital controls and digital technologies is also driving the market's growth, enabling real-time monitoring and optimization of ESP performance. The market is expanding in various sectors, including metal processing, mining, manufacturing, marine, and healthcare. The adoption of clean energy sources and renewable energy sources is also expected to boost the market's growth. Retrofitting existing systems with ESP technology is another trend gaining traction, as emission standards become increasingly stringent. ESP systems are essential for industries that prioritize sustainable development and emission control. The market is expected to continue growing as industries seek efficient and effective solutions for managing industrial emissions.
|
Market Scope |
|
|
Report Coverage |
Details |
|
Page number |
165 |
|
Base year |
2023 |
|
Historic period |
2018-2022 |
|
Forecast period |
2024-2028 |
|
Growth momentum & CAGR |
Accelerate at a CAGR of 2.8% |
|
Market growth 2024-2028 |
USD 607.9 million |
|
Market structure |
Fragmented |
|
YoY growth 2023-2024(%) |
2.7 |
|
Key countries |
US, Canada, China, Japan, India, Germany, South Korea, UK, Italy, and France |
|
Competitive landscape |
Leading Companies, Market Positioning of Companies, Competitive Strategies, and Industry Risks |
What are the Key Data Covered in this Market Research and Growth Report?
- CAGR of the market during the forecast period
- Detailed information on factors that will drive the market growth and forecasting between 2024 and 2028
- Precise estimation of the size of the market and its contribution of the market in focus to the parent market
- Accurate predictions about upcoming market growth and trends and changes in consumer behaviour
- Growth of the market across APAC, North America, Europe, Middle East and Africa, and South America
- Thorough analysis of the market's competitive landscape and detailed information about companies
- Comprehensive analysis of factors that will challenge the growth of market companies
We can help! Our analysts can customize this market research report to meet your requirements. Get in touch
 RIA -
RIA - 
