Emotion Analytics Market Analysis North America, Europe, APAC, Middle East and Africa, South America - US, Germany, UK, China, Canada, Japan, France, UAE, India, Saudi Arabia - Size and Forecast 2024-2028

Emotion Analytics Market Analysis North America, Europe, APAC, Middle East and Africa, South America - US, Germany, UK, China, Canada, Japan, France, UAE, India, Saudi Arabia - Size and Forecast 2024-2028

Published: Nov 2024 181 Pages SKU: IRTNTR72737

Market Overview at a Glance

$4.44 B
Market Opportunity
18.2%
CAGR
15.4
YoY growth 2023-2024(%)

Emotion Analytics Market Size 2024-2028 

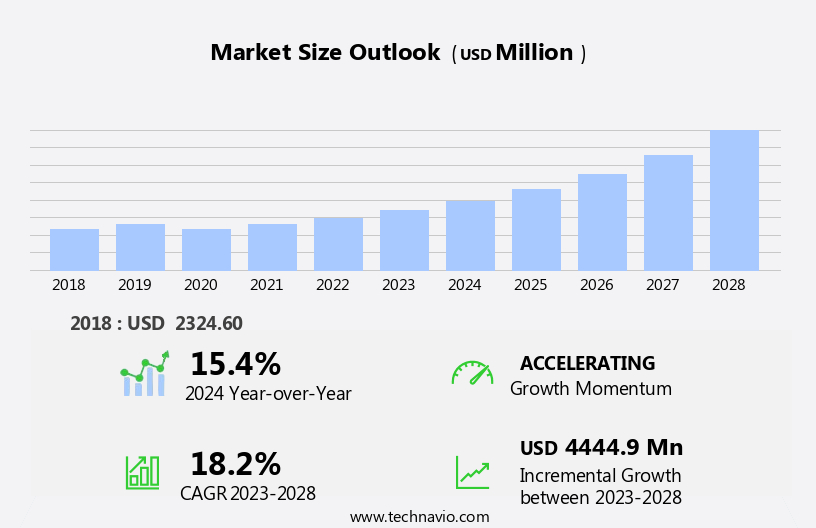
The emotion analytics market size is forecast to increase by USD 4.44 billion, at a CAGR of 18.2% between 2023 and 2028.

  • The market is experiencing significant growth due to the increasing demand for data-driven customer behavior management in various sectors, including IT and telecommunications. Emotion recognition technology, which includes tone of voice analysis and correlation engines, is increasingly being used in public safety and contact centers to enhance situational awareness and improve response times. In the automotive industry, emotion analytics is being utilized to provide personalized user experiences and optimize sales performance. Advanced audio mining algorithms and artificial intelligence are being employed to extract insights from labeled emotion data obtained from various sources, including wearable gadgets and audio recordings. The accuracy and reliability of emotion analytics solutions are key drivers of market growth, making them valuable tools for businesses seeking to improve customer engagement and satisfaction.

What will be the Size of the Market During the Forecast Period?

Emotion Analytics Market Size

 Request Free Sample

  • The market is witnessing significant growth as businesses increasingly recognize the value of understanding and responding to human emotions. Emotion analytics is a branch of artificial intelligence that focuses on the identification, analysis, and interpretation of emotions from various data sources. This market is poised to revolutionize industries by providing valuable insights into customer and employee behavior, public safety, and fraud detection. Behavioral analytics is a crucial application of emotion analytics. By analyzing voice tone, facial expressions, and text data, businesses can gain a deeper understanding of their customers' emotions and intentions. This information can be used to optimize sales performance, improve customer experience, and enhance brand reputation management.  Another key application of emotion analytics is in risk management. By analyzing emotions in real-time, businesses can identify potential threats and take preventative measures. For instance, in public safety analytics, emotion analytics can be used to detect anomalous behavior and alert authorities.
  • In fraud detection, it can help identify suspicious transactions based on the emotional tone of the communication. Emotion analytics also plays a vital role in human-computer interaction. Conversational AI, a subset of emotion analytics, enables machines to understand and respond to human emotions. This technology can be used to improve customer service, automate contact centers, and enhance the overall customer experience. predictive analytics is another area where emotion analytics is making a significant impact. By analyzing historical data and identifying patterns, emotion analytics can predict customer churn, agent performance, and product perception. This information can help businesses take proactive measures to retain customers and improve employee performance. Cloud-based technology is driving the adoption of emotion analytics in various industries. Emotion analytics software, which can be integrated with existing systems, offers real-time insights and easy scalability. Sentiment analysis tools, a popular application of emotion analytics, help businesses measure customer satisfaction and monitor brand reputation.

How is this market segmented and which is the largest segment?

The market research report provides comprehensive data (region-wise segment analysis), with forecasts and estimates in "USD million" for the period 2024-2028, as well as historical data from 2018-2022 for the following segments.
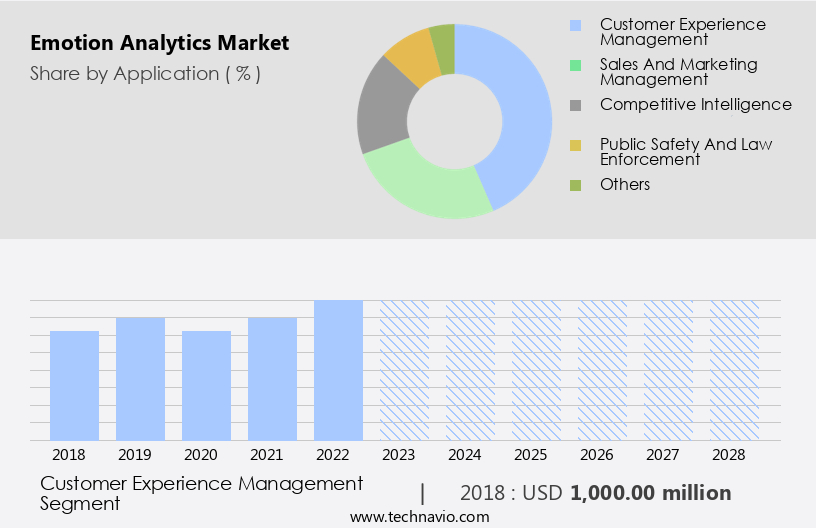
  • Application
    • Customer experience management
    • Sales and marketing management
    • Competitive intelligence
    • Public safety and law enforcement
    • Others
  • Geography
    • North America
      • Canada
      • US
    • Europe
      • Germany
      • UK
      • France
    • APAC
      • China
      • India
      • Japan
    • Middle East and Africa
    • South America

By Application Insights

  • The customer experience management segment is estimated to witness significant growth during the forecast period.

In today's business landscape, understanding user experience and emotions plays a pivotal role in gaining customer satisfaction and loyalty. Emotion analytics, a growing field, enables companies to diagnose and respond to customers' emotions using advanced machine learning algorithms. This data is collected through various sources such as virtual reality (VR), wearables, and user feedback. Emotion recognition technology, which includes facial recognition and haptic touch, is a significant component of emotion analytics. By analyzing customers' emotional responses, businesses can tailor their interactions, creating a more engaging experience. For instance, this technology can be used to gauge viewers' reactions to movie trailers or customers' feelings toward in-store displays.

Moreover, emotion analytics can be applied to various industries, including travel and healthcare, to improve treatment plans and customer service. In the travel industry, for example, this technology can help airlines understand passengers' emotional states during their journey and adjust their services accordingly. In the healthcare sector, emotion analytics can be used to monitor patients' emotional wellbeing and provide personalized care. In conclusion, emotion analytics offers valuable insights into customers' emotions, allowing businesses to create a more personalized and engaging user experience. By understanding customers' attitudes and emotions, companies can foster loyalty, improve customer satisfaction, and stay competitive in the market.

Emotion Analytics Market Size

Get a glance at the market report of share of various segments Request Free Sample

The customer experience management segment was valued at USD 1 billion in 2018 and showed a gradual increase during the forecast period.

Regional Analysis

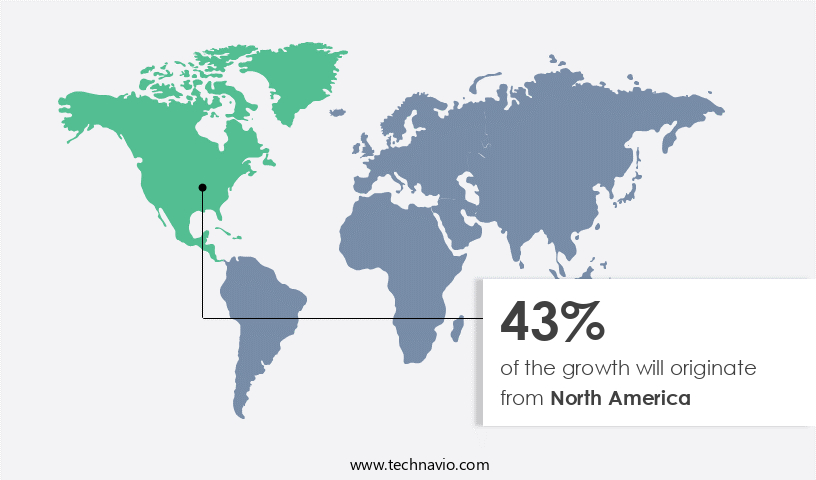
  • North America is estimated to contribute 43% to the growth of the global market during the forecast period.

Technavio's analysts have elaborately explained the regional trends and drivers that shape the market during the forecast period.

Emotion Analytics Market Share by Geography

For more insights on the market share of various regions Request Free Sample

In North America, the market is experiencing significant growth due to the region's high adoption of advanced technologies and analytics solutions. The US, in particular, is a major contributor to this market's expansion. The healthcare, retail, media and entertainment, and public safety and law enforcement industries in North America have some of the highest adoption rates of emotion analytics. This is because these sectors rely heavily on data-driven insights to optimize operations and improve customer experiences. Additionally, the widespread use of big data in the region facilitates the implementation and operation of emotion analytics solutions. With the increasing dependency on the internet and wearable devices, North Americans are increasingly relying on analytical tools to make informed business decisions.

Market Dynamics

Our researchers analyzed the data with 2023 as the base year, along with the key drivers, trends, and challenges. A holistic analysis of drivers will help companies refine their marketing strategies to gain a competitive advantage.

What are the key market drivers leading to the rise in adoption of Emotion Analytics Market?

Growing demand for data-based customer behavior management is the key driver of the market.

  • Emotion analytics is gaining traction in the business world as a valuable tool for enhancing customer experience management and workforce optimization. By employing emotion recognition technology, companies can gain insights into human emotions, enabling them to connect with customers on a deeper level. With the widespread use of digital platforms for customer engagement, there is a growing need for businesses to understand their customers' emotions and respond appropriately. Emotion analytics goes beyond traditional customer support by providing real-time emotional intelligence. This intelligence can help businesses identify customer moods and respond accordingly, ensuring a positive customer experience.
  • Additionally, emotion analytics can be utilized for workforce management, allowing companies to monitor and improve agent performance based on emotional engagement with customers. Emotion analytics solutions can be deployed on-premise or in the cloud, providing flexibility for businesses with varying IT infrastructure needs. By leveraging emotion analytics, companies can gain a competitive edge by providing personalized experiences, enhancing customer satisfaction, and improving overall brand perception.

What are the market trends shaping the Emotion Analytics Market?

Increasing the use of emotion recognition in automotive sector is the upcoming trend in the market.

  • Emotion analytics is experiencing significant investment in the IT and telecommunications sector, particularly within the automotive industry. As competition intensifies, companies aim to build stronger emotional connections with consumers to attract new business and retain existing customers. Additionally, manufacturers and original equipment manufacturers are prioritizing the analysis of drivers' emotions to improve vehicle safety.
  • This technology will soon be integrated into high-end cars, enabling the detection of driver attention levels and drowsiness, thereby enhancing overall safety. Furthermore, emotion data will provide car manufacturers with valuable insights into the driving experience of both the driver and passengers, allowing them to better understand consumer behavior and make informed business decisions.

What challenges does Emotion Analytics Market face during the growth?

Accuracy of emotion analytics is a key challenge affecting the market growth.

  • Emotion analytics refers to the use of technology to identify and interpret human emotions through various channels, including speech and nonverbal cues. This field is gaining significance in various sectors, such as government and law enforcement, to better understand customer views and preferences. Emotion analytics solutions employ advanced technologies like AI and video analytics to analyze facial expressions, voice patterns, written words, body postures, and gestures.
  • However, deciphering emotions accurately through these channels remains a challenge due to their complex and situational nature. Emotion analytics can provide insights with up to 75%-85% accuracy through voice, body language, and other cues. These insights can be valuable for businesses to tailor their offerings to customer attitudes and improve overall customer experience.

Exclusive Customer Landscape

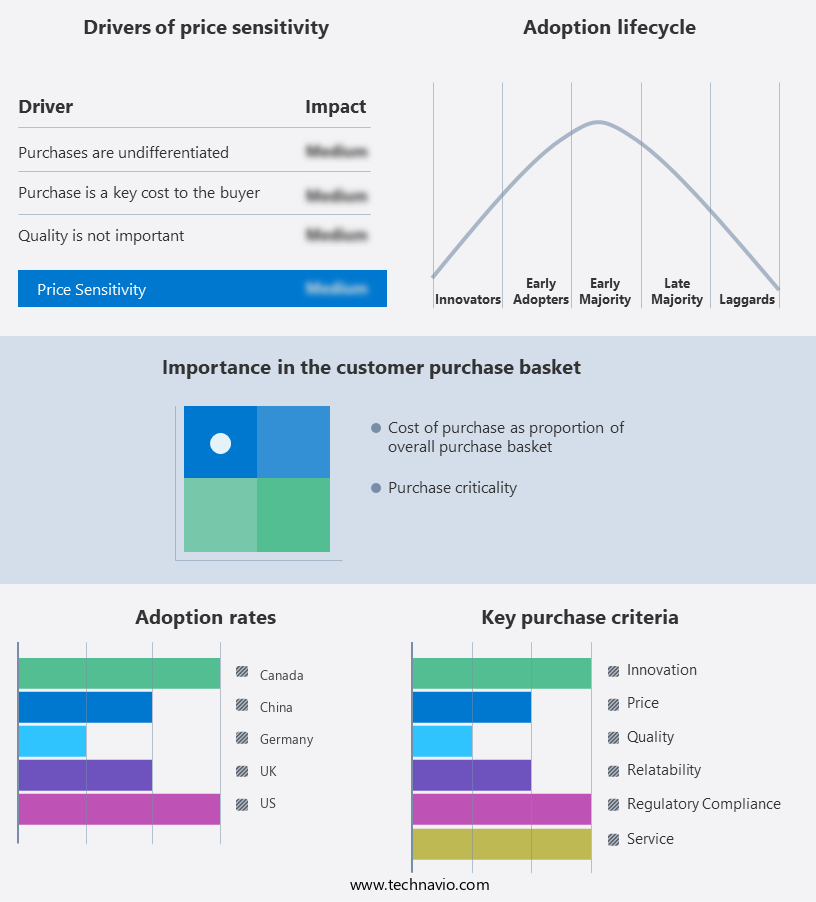
The market forecasting report includes the adoption lifecycle of the market, covering from the innovator's stage to the laggard's stage. It focuses on adoption rates in different regions based on penetration. Furthermore, the market report also includes key purchase criteria and drivers of price sensitivity to help companies evaluate and develop their market growth analysis strategies.

Emotion Analytics Market Share by Geography

 Customer Landscape

Key Companies & Market Insights

Companies are implementing various strategies, such as strategic alliances, market forecast, partnerships, mergers and acquisitions, geographical expansion, and product/service launches, to enhance their presence in the market.

The market research and growth report includes detailed analyses of the competitive landscape of the market and information about key companies, including:

  • Adoreboard
  • Affectiva Inc.
  • Alphabet Inc.
  • apple Inc.
  • Clarifai Inc.
  • Cogito Corp.
  • Deloitte Touche Tohmatsu Ltd.
  • Highstreet
  • iMotions AS
  • InMoment Inc.
  • International Business Machines Corp.
  • Kairos AR Inc.
  • Microsoft Corp.
  • neuromore
  • Noldus Information Technology bv
  • NVISO SA
  • Realeyes OU
  • SAS Institute Inc.
  • Sentiance NV
  • Tobii AB

Qualitative and quantitative analysis of companies has been conducted to help clients understand the wider business environment as well as the strengths and weaknesses of key market players. Data is qualitatively analyzed to categorize companies as pure play, category-focused, industry-focused, and diversified; it is quantitatively analyzed to categorize companies as dominant, leading, strong, tentative, and weak.

Research Analyst Overview

Emotion analytics is an emerging field that focuses on the identification and analysis of human emotions through various means, including facial expressions, tone of voice, and speech content. This technology has gained significant traction in various industries, including customer experience management and workforce management, due to its ability to provide valuable insights into customer views and preferences. Emotion analytics goes beyond traditional methods of customer feedback and sentiment analysis by utilizing advanced technologies like artificial intelligence, machine learning algorithms, and biometric technology to accurately identify emotional states and nonverbal cues. The market is witnessing technological progress with the adoption of cloud and on-premise solutions, as well as the integration of wearable gadgets and IoT devices.

This market caters to various sectors, including government, IT and telecom, and customer support agents, among others. Emotion analytics software is used to analyze emotional data from various sources, including video analytics, facial analytics, speech analytics, and audio mining, to provide personalized user experiences and improve sales performance. Privacy and security are crucial considerations in the market, with the need for language-agnostic and secure solutions to protect sensitive emotional data. The market also caters to various applications, including mental health diagnosis, student engagement, and public safety, among others. The use of emotion analytics has been shown to improve customer satisfaction, loyalty, and treatment outcomes, making it a valuable tool for businesses and organizations.

Market Scope

Report Coverage

Details

Page number

181

Base year

2023

Historic period

2018-2022

Forecast period

2024-2028

Growth momentum & CAGR

Accelerate at a CAGR of 18.2%

Market Growth 2024-2028

USD 4.44 billion

Market structure

Fragmented

YoY growth 2023-2024(%)

15.4

Key countries

US, Germany, UK, China, Canada, Japan, France, UAE, India, and Saudi Arabia

Competitive landscape

Leading Companies, Market Positioning of Companies, Competitive Strategies, and Industry Risks

Request Free Sample

What are the Key Data Covered in this Market Research and Growth Report?

  • CAGR of the market during the forecast period
  • Detailed information on factors that will drive the market growth and forecasting between 2024 and 2028
  • Precise estimation of the size of the market  and its contribution of the market in focus to the parent market
  • Accurate predictions about upcoming market growth and trends and changes in consumer behaviour
  • Growth of the market across North America, Europe, APAC, Middle East and Africa, and South America
  • Thorough analysis of the market's competitive landscape and detailed information about companies
  • Comprehensive analysis of factors that will challenge the growth of market companies

We can help! Our analysts can customize this market research report to meet your requirements.

Get in touch

1 Executive Summary

  • 1.1 Market overview
    • Executive Summary - Chart on Market Overview
    • Executive Summary - Data Table on Market Overview
    • Executive Summary - Chart on Global Market Characteristics
    • Executive Summary - Chart on Market by Geography
    • Executive Summary - Chart on Market Segmentation by Application
    • Executive Summary - Chart on Incremental Growth
    • Executive Summary - Data Table on Incremental Growth
    • Executive Summary - Chart on Company Market Positioning

2 Technavio Analysis

  • 2.1 Analysis of price sensitivity, lifecycle, customer purchase basket, adoption rates, and purchase criteria
    • Analysis of price sensitivity, lifecycle, customer purchase basket, adoption rates, and purchase criteria
  • 2.2 Criticality of inputs and Factors of differentiation
    • Overview on criticality of inputs and factors of differentiation
  • 2.3 Factors of disruption
    • Overview on factors of disruption
  • 2.4 Impact of drivers and challenges
    • Impact of drivers and challenges in 2023 and 2028

3 Market Landscape

  • 3.1 Market ecosystem
    • Parent Market
    • Data Table on - Parent Market
  • 3.2 Market characteristics
    • Market characteristics analysis
  • 3.3 Value chain analysis
    • Value Chain Analysis

4 Market Sizing

  • 4.1 Market definition
    • Offerings of companies included in the market definition
  • 4.2 Market segment analysis
    • Market segments
  • 4.3 Market size 2023
    • 4.4 Market outlook: Forecast for 2023-2028
      • Chart on Global - Market size and forecast 2023-2028 ($ million)
      • Data Table on Global - Market size and forecast 2023-2028 ($ million)
      • Chart on Global Market: Year-over-year growth 2023-2028 (%)
      • Data Table on Global Market: Year-over-year growth 2023-2028 (%)

    5 Historic Market Size

    • 5.1 Global Emotion Analytics Market 2018 - 2022
      • Historic Market Size - Data Table on Global Emotion Analytics Market 2018 - 2022 ($ million)
    • 5.2 Application segment analysis 2018 - 2022
      • Historic Market Size - Application Segment 2018 - 2022 ($ million)
    • 5.3 Geography segment analysis 2018 - 2022
      • Historic Market Size - Geography Segment 2018 - 2022 ($ million)
    • 5.4 Country segment analysis 2018 - 2022
      • Historic Market Size - Country Segment 2018 - 2022 ($ million)

    6 Qualitative Analysis

    • 6.1 The AI impact on Global Emotion Analytics Market

      7 Five Forces Analysis

      • 7.1 Five forces summary
        • Five forces analysis - Comparison between 2023 and 2028
      • 7.2 Bargaining power of buyers
        • Bargaining power of buyers - Impact of key factors 2023 and 2028
      • 7.3 Bargaining power of suppliers
        • Bargaining power of suppliers - Impact of key factors in 2023 and 2028
      • 7.4 Threat of new entrants
        • Threat of new entrants - Impact of key factors in 2023 and 2028
      • 7.5 Threat of substitutes
        • Threat of substitutes - Impact of key factors in 2023 and 2028
      • 7.6 Threat of rivalry
        • Threat of rivalry - Impact of key factors in 2023 and 2028
      • 7.7 Market condition
        • Chart on Market condition - Five forces 2023 and 2028

      8 Market Segmentation by Application

      • 8.1 Market segments
        • Chart on Application - Market share 2023-2028 (%)
        • Data Table on Application - Market share 2023-2028 (%)
      • 8.2 Comparison by Application
        • Chart on Comparison by Application
        • Data Table on Comparison by Application
      • 8.3 Customer experience management - Market size and forecast 2023-2028
        • Chart on Customer experience management - Market size and forecast 2023-2028 ($ million)
        • Data Table on Customer experience management - Market size and forecast 2023-2028 ($ million)
        • Chart on Customer experience management - Year-over-year growth 2023-2028 (%)
        • Data Table on Customer experience management - Year-over-year growth 2023-2028 (%)
      • 8.4 Sales and marketing management - Market size and forecast 2023-2028
        • Chart on Sales and marketing management - Market size and forecast 2023-2028 ($ million)
        • Data Table on Sales and marketing management - Market size and forecast 2023-2028 ($ million)
        • Chart on Sales and marketing management - Year-over-year growth 2023-2028 (%)
        • Data Table on Sales and marketing management - Year-over-year growth 2023-2028 (%)
      • 8.5 Competitive intelligence - Market size and forecast 2023-2028
        • Chart on Competitive intelligence - Market size and forecast 2023-2028 ($ million)
        • Data Table on Competitive intelligence - Market size and forecast 2023-2028 ($ million)
        • Chart on Competitive intelligence - Year-over-year growth 2023-2028 (%)
        • Data Table on Competitive intelligence - Year-over-year growth 2023-2028 (%)
      • 8.6 Public safety and law enforcement - Market size and forecast 2023-2028
        • Chart on Public safety and law enforcement - Market size and forecast 2023-2028 ($ million)
        • Data Table on Public safety and law enforcement - Market size and forecast 2023-2028 ($ million)
        • Chart on Public safety and law enforcement - Year-over-year growth 2023-2028 (%)
        • Data Table on Public safety and law enforcement - Year-over-year growth 2023-2028 (%)
      • 8.7 Others - Market size and forecast 2023-2028
        • Chart on Others - Market size and forecast 2023-2028 ($ million)
        • Data Table on Others - Market size and forecast 2023-2028 ($ million)
        • Chart on Others - Year-over-year growth 2023-2028 (%)
        • Data Table on Others - Year-over-year growth 2023-2028 (%)
      • 8.8 Market opportunity by Application
        • Market opportunity by Application ($ million)
        • Data Table on Market opportunity by Application ($ million)

      9 Customer Landscape

      • 9.1 Customer landscape overview
        • Analysis of price sensitivity, lifecycle, customer purchase basket, adoption rates, and purchase criteria

      10 Geographic Landscape

      • 10.1 Geographic segmentation
        • Chart on Market share by geography 2023-2028 (%)
        • Data Table on Market share by geography 2023-2028 (%)
      • 10.2 Geographic comparison
        • Chart on Geographic comparison
        • Data Table on Geographic comparison
      • 10.3 North America - Market size and forecast 2023-2028
        • Chart on North America - Market size and forecast 2023-2028 ($ million)
        • Data Table on North America - Market size and forecast 2023-2028 ($ million)
        • Chart on North America - Year-over-year growth 2023-2028 (%)
        • Data Table on North America - Year-over-year growth 2023-2028 (%)
      • 10.4 Europe - Market size and forecast 2023-2028
        • Chart on Europe - Market size and forecast 2023-2028 ($ million)
        • Data Table on Europe - Market size and forecast 2023-2028 ($ million)
        • Chart on Europe - Year-over-year growth 2023-2028 (%)
        • Data Table on Europe - Year-over-year growth 2023-2028 (%)
      • 10.5 APAC - Market size and forecast 2023-2028
        • Chart on APAC - Market size and forecast 2023-2028 ($ million)
        • Data Table on APAC - Market size and forecast 2023-2028 ($ million)
        • Chart on APAC - Year-over-year growth 2023-2028 (%)
        • Data Table on APAC - Year-over-year growth 2023-2028 (%)
      • 10.6 Middle East and Africa - Market size and forecast 2023-2028
        • Chart on Middle East and Africa - Market size and forecast 2023-2028 ($ million)
        • Data Table on Middle East and Africa - Market size and forecast 2023-2028 ($ million)
        • Chart on Middle East and Africa - Year-over-year growth 2023-2028 (%)
        • Data Table on Middle East and Africa - Year-over-year growth 2023-2028 (%)
      • 10.7 South America - Market size and forecast 2023-2028
        • Chart on South America - Market size and forecast 2023-2028 ($ million)
        • Data Table on South America - Market size and forecast 2023-2028 ($ million)
        • Chart on South America - Year-over-year growth 2023-2028 (%)
        • Data Table on South America - Year-over-year growth 2023-2028 (%)
      • 10.8 US - Market size and forecast 2023-2028
        • Chart on US - Market size and forecast 2023-2028 ($ million)
        • Data Table on US - Market size and forecast 2023-2028 ($ million)
        • Chart on US - Year-over-year growth 2023-2028 (%)
        • Data Table on US - Year-over-year growth 2023-2028 (%)
      • 10.9 Germany - Market size and forecast 2023-2028
        • Chart on Germany - Market size and forecast 2023-2028 ($ million)
        • Data Table on Germany - Market size and forecast 2023-2028 ($ million)
        • Chart on Germany - Year-over-year growth 2023-2028 (%)
        • Data Table on Germany - Year-over-year growth 2023-2028 (%)
      • 10.10 UK - Market size and forecast 2023-2028
        • Chart on UK - Market size and forecast 2023-2028 ($ million)
        • Data Table on UK - Market size and forecast 2023-2028 ($ million)
        • Chart on UK - Year-over-year growth 2023-2028 (%)
        • Data Table on UK - Year-over-year growth 2023-2028 (%)
      • 10.11 China - Market size and forecast 2023-2028
        • Chart on China - Market size and forecast 2023-2028 ($ million)
        • Data Table on China - Market size and forecast 2023-2028 ($ million)
        • Chart on China - Year-over-year growth 2023-2028 (%)
        • Data Table on China - Year-over-year growth 2023-2028 (%)
      • 10.12 Canada - Market size and forecast 2023-2028
        • Chart on Canada - Market size and forecast 2023-2028 ($ million)
        • Data Table on Canada - Market size and forecast 2023-2028 ($ million)
        • Chart on Canada - Year-over-year growth 2023-2028 (%)
        • Data Table on Canada - Year-over-year growth 2023-2028 (%)
      • 10.13 Japan - Market size and forecast 2023-2028
        • Chart on Japan - Market size and forecast 2023-2028 ($ million)
        • Data Table on Japan - Market size and forecast 2023-2028 ($ million)
        • Chart on Japan - Year-over-year growth 2023-2028 (%)
        • Data Table on Japan - Year-over-year growth 2023-2028 (%)
      • 10.14 France - Market size and forecast 2023-2028
        • Chart on France - Market size and forecast 2023-2028 ($ million)
        • Data Table on France - Market size and forecast 2023-2028 ($ million)
        • Chart on France - Year-over-year growth 2023-2028 (%)
        • Data Table on France - Year-over-year growth 2023-2028 (%)
      • 10.15 UAE - Market size and forecast 2023-2028
        • Chart on UAE - Market size and forecast 2023-2028 ($ million)
        • Data Table on UAE - Market size and forecast 2023-2028 ($ million)
        • Chart on UAE - Year-over-year growth 2023-2028 (%)
        • Data Table on UAE - Year-over-year growth 2023-2028 (%)
      • 10.16 Saudi Arabia - Market size and forecast 2023-2028
        • Chart on Saudi Arabia - Market size and forecast 2023-2028 ($ million)
        • Data Table on Saudi Arabia - Market size and forecast 2023-2028 ($ million)
        • Chart on Saudi Arabia - Year-over-year growth 2023-2028 (%)
        • Data Table on Saudi Arabia - Year-over-year growth 2023-2028 (%)
      • 10.17 India - Market size and forecast 2023-2028
        • Chart on India - Market size and forecast 2023-2028 ($ million)
        • Data Table on India - Market size and forecast 2023-2028 ($ million)
        • Chart on India - Year-over-year growth 2023-2028 (%)
        • Data Table on India - Year-over-year growth 2023-2028 (%)
      • 10.18 Market opportunity by geography
        • Market opportunity by geography ($ million)
        • Data Tables on Market opportunity by geography ($ million)

      11 Drivers, Challenges, and Opportunity/Restraints

      • 11.1 Market drivers
        • 11.2 Market challenges
          • 11.3 Impact of drivers and challenges
            • Impact of drivers and challenges in 2023 and 2028
          • 11.4 Market opportunities/restraints

            12 Competitive Landscape

            • 12.1 Overview
              • 12.2 Competitive Landscape
                • Overview on criticality of inputs and factors of differentiation
              • 12.3 Landscape disruption
                • Overview on factors of disruption
              • 12.4 Industry risks
                • Impact of key risks on business

              13 Competitive Analysis

              • 13.1 Companies profiled
                • Companies covered
              • 13.2 Company ranking index
                • Company ranking index
              • 13.3 Market positioning of companies
                • Matrix on companies position and classification
              • 13.4 Adoreboard
                • Adoreboard - Overview
                • Adoreboard - Product / Service
                • Adoreboard - Key offerings
                • SWOT
              • 13.5 Alphabet Inc.
                • Alphabet Inc. - Overview
                • Alphabet Inc. - Business segments
                • Alphabet Inc. - Key offerings
                • Alphabet Inc. - Segment focus
                • SWOT
              • 13.6 Deloitte Touche Tohmatsu Ltd.
                • Deloitte Touche Tohmatsu Ltd. - Overview
                • Deloitte Touche Tohmatsu Ltd. - Product / Service
                • Deloitte Touche Tohmatsu Ltd. - Key news
                • Deloitte Touche Tohmatsu Ltd. - Key offerings
                • SWOT
              • 13.7 InMoment Inc.
                • InMoment Inc. - Overview
                • InMoment Inc. - Product / Service
                • InMoment Inc. - Key offerings
                • SWOT
              • 13.8 International Business Machines Corp.
                • International Business Machines Corp. - Overview
                • International Business Machines Corp. - Business segments
                • International Business Machines Corp. - Key news
                • International Business Machines Corp. - Key offerings
                • International Business Machines Corp. - Segment focus
                • SWOT
              • 13.9 Microsoft Corp.
                • Microsoft Corp. - Overview
                • Microsoft Corp. - Business segments
                • Microsoft Corp. - Key news
                • Microsoft Corp. - Key offerings
                • Microsoft Corp. - Segment focus
                • SWOT
              • 13.10 NVISO SA
                • NVISO SA - Overview
                • NVISO SA - Product / Service
                • NVISO SA - Key offerings
                • SWOT
              • 13.11 SAS Institute Inc.
                • SAS Institute Inc. - Overview
                • SAS Institute Inc. - Product / Service
                • SAS Institute Inc. - Key news
                • SAS Institute Inc. - Key offerings
                • SWOT
              • 13.12 Sentiance NV
                • Sentiance NV - Overview
                • Sentiance NV - Product / Service
                • Sentiance NV - Key offerings
                • SWOT
              • 13.13 Tobii AB
                • Tobii AB - Overview
                • Tobii AB - Business segments
                • Tobii AB - Key offerings
                • Tobii AB - Segment focus
                • SWOT

              14 Appendix

              • 14.1 Scope of the report
                • 14.2 Inclusions and exclusions checklist
                  • Inclusions checklist
                  • Exclusions checklist
                • 14.3 Currency conversion rates for US$
                  • Currency conversion rates for US$
                • 14.4 Research methodology
                  • Research methodology
                • 14.5 Data procurement
                  • Information sources
                • 14.6 Data validation
                  • Data validation
                • 14.7 Validation techniques employed for market sizing
                  • Validation techniques employed for market sizing
                • 14.8 Data synthesis
                  • Data synthesis
                • 14.9 360 degree market analysis
                  • 360 degree market analysis
                • 14.10 List of abbreviations
                  • List of abbreviations

                Research Methodology

                Technavio presents a detailed picture of the market by way of study, synthesis, and summation of data from multiple sources. The analysts have presented the various facets of the market with a particular focus on identifying the key industry influencers. The data thus presented is comprehensive, reliable, and the result of extensive research, both primary and secondary.

                INFORMATION SOURCES

                Primary sources

                • Manufacturers and suppliers
                • Channel partners
                • Industry experts
                • Strategic decision makers

                Secondary sources

                • Industry journals and periodicals
                • Government data
                • Financial reports of key industry players
                • Historical data
                • Press releases

                DATA ANALYSIS

                Data Synthesis

                • Collation of data
                • Estimation of key figures
                • Analysis of derived insights

                Data Validation

                • Triangulation with data models
                • Reference against proprietary databases
                • Corroboration with industry experts

                REPORT WRITING

                Qualitative

                • Market drivers
                • Market challenges
                • Market trends
                • Five forces analysis

                Quantitative

                • Market size and forecast
                • Market segmentation
                • Geographical insights
                • Competitive landscape

                Interested in this report?

                Get your sample now to see our research methodology and insights!

                Download Now

                Frequently Asked Questions

                Emotion Analytics market growth will increase by $ 4444.9 mn during 2024-2028 .

                The Emotion Analytics market is expected to grow at a CAGR of 18.2% during 2024-2028 .

                Emotion Analytics market is segmented by Application( Customer experience management, Sales and marketing management, Competitive intelligence, Public safety and law enforcement, Others)

                Adoreboard, Affectiva Inc., Alphabet Inc., Apple Inc., Clarifai Inc., Cogito Corp., Deloitte Touche Tohmatsu Ltd., Highstreet, iMotions AS, InMoment Inc., International Business Machines Corp., Kairos AR Inc., Microsoft Corp., neuromore, Noldus Information Technology bv, NVISO SA, Realeyes OU, SAS Institute Inc., Sentiance NV, Tobii AB are a few of the key vendors in the Emotion Analytics market.

                North America will register the highest growth rate of 43% among the other regions. Therefore, the Emotion Analytics market in North America is expected to garner significant business opportunities for the vendors during the forecast period.

                US, Germany, UK, China, Canada, Japan, France, UAE, India, Saudi Arabia

                • Growing demand for data-based customer behavior managementThe need for enhanced customer management across industries and verticals is driving the demand for emotion analytics. Through emotion analytics is the driving factor this market.
                • brands can connect to customers on a personal and emotional level.With the increasing penetration of social media and other digital platforms that help connect and interact with customers is the driving factor this market.
                • businesses and brands intend to know more about their customers to provide them with personalized experiences and products.Using emotion analytics enables such businesses and brands to analyze any disconnect or disruption between the expected and the real experience of customers. Emotion analytics enables companies to know about customers opinions on a particular brand.Without deeper knowledge of customers feelings about brands is the driving factor this market.
                • businesses cannot make strategic decisions to acquire as well as retain customers. For instance is the driving factor this market.
                • in cases where a company wants to promote its brand by inspiring younger and digital audiences is the driving factor this market.
                • emotion analytics analyzes these audiences through data from various digital platforms. The analysis of facial recognition is the driving factor this market.
                • social listening is the driving factor this market.
                • audio analytics is the driving factor this market.
                • and biometrics scanning helps companies understand customers opinions and views on their brands. Such insights help companies improve their strategies and increase peoples preference for their brand.Globally is the driving factor this market.
                • many big brands use emotion analytics to gain insights about their customers. For instance is the driving factor this market.
                • British Broadcasting Corp. (BBC) uses emotion analytics solutions to analyze customers opinions on new shows aired by them. With customers posting their opinion on Snapchat is the driving factor this market.
                • Facebook is the driving factor this market.
                • Twitter is the driving factor this market.
                • and Instagram is the driving factor this market.
                • as well as on websites and in videos is the driving factor this market.
                • there is a huge data set of emotion-related data for vendors. Emotion analytics helps companies identify and analyze the complete spectrum of human emotions such as mood is the driving factor this market.
                • attitude is the driving factor this market.
                • and emotional personality.Therefore is the driving factor this market.
                • the increased demand for emotion analytics among businesses and brands to better understand customer behavior will drive the global emotion analytics market during the forecast period. is the driving factor this market.

                The Emotion Analytics market vendors should focus on grabbing business opportunities from the Customer experience management segment as it accounted for the largest market share in the base year.