France Energy Bar Market Size 2025-2029
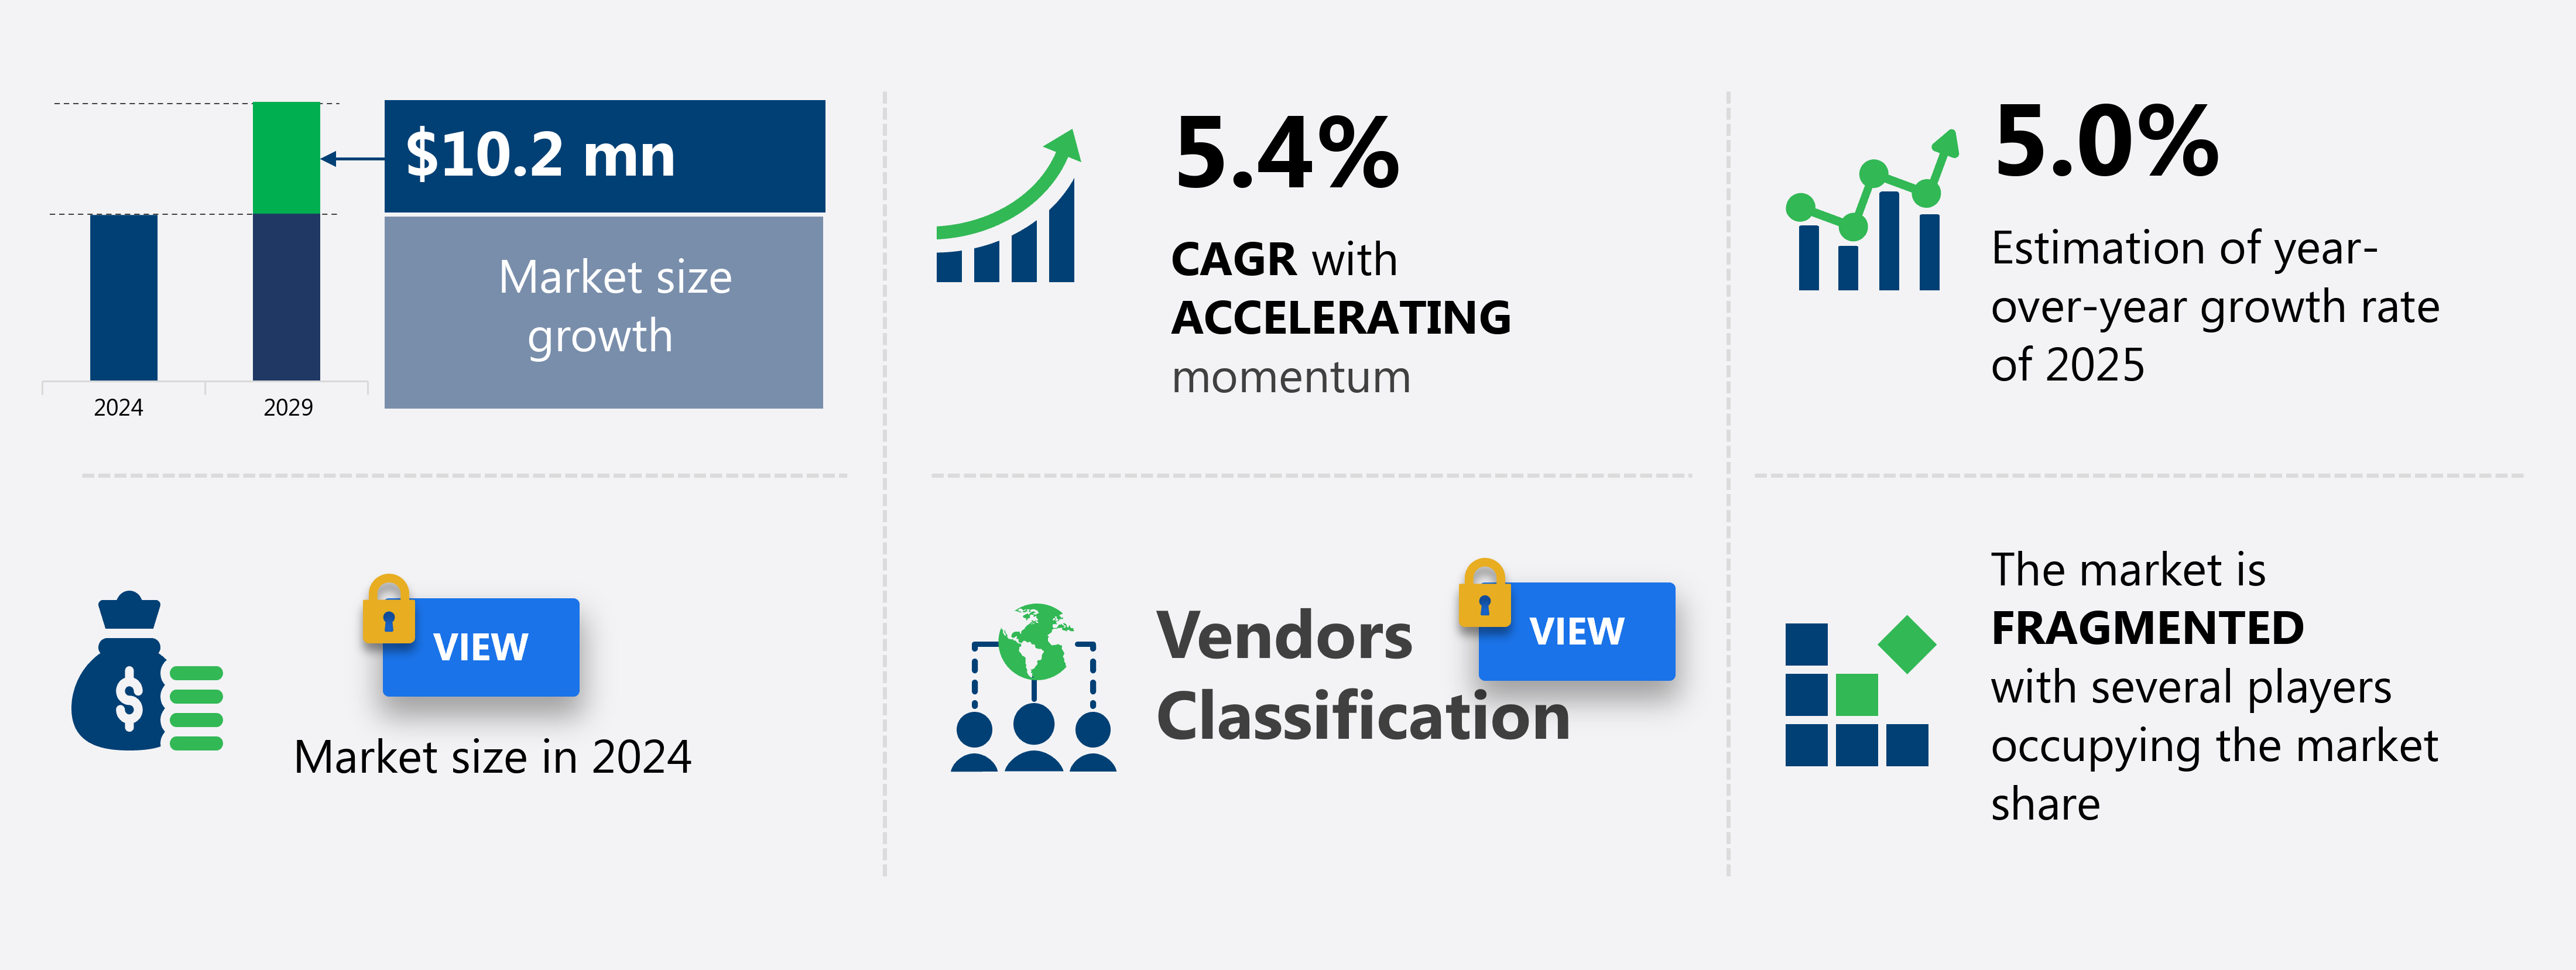
The energy bar market size in France is forecast to increase by USD 10.2 million at a CAGR of 5.4% between 2024 and 2029.
-
The energy bar market is experiencing significant growth, driven by the increasing demand for convenient and nutritious snacking options, particularly in the sports nutrition sector. This trend is fueled by consumers' active lifestyles and the need for quick, on-the-go energy sources. Moreover, the packaging trend in energy bars, with innovative designs and eco-friendly materials, is attracting a wider consumer base. However, the market faces challenges from the easy availability of substitutes, such as fresh fruits and nuts, and the perception that energy bars are high in added sugars.
-
To stay competitive, market players are focusing on product innovation, sustainable sourcing, and targeted marketing strategies. This market trends and analysis report delves deeper into the dynamics of the energy bar market, providing insights into key drivers, trends, and challenges. Market penetration is driven by the use of food additives like flavoring agents and coloring agents, as well as marketing strategies that highlight brand positioning and ingredient traceability.
What will be the Size of the market During the Forecast Period?
The energy bar market is characterized by a growing focus on sustainability and transparency, with key trends including export regulations, fiber content, recyclable packaging, and sales promotion. Consumers increasingly demand bars with accurate calorie and sugar counts, as well as sustainability certifications and compostable packaging. Product lifecycle management is crucial for minimizing the carbon footprint and ensuring shelf stability. International markets present both opportunities and challenges, with import regulations requiring careful consideration. Customer loyalty programs and retailer relationships are essential for sales growth, while ingredient traceability and brand positioning are critical for maintaining trust.
Manufacturers focus on new product development, introducing peanut butter bars, keto bars, and paleo bars to meet diverse consumer needs. Competitor analysis and marketing strategy are key components of a successful business model, with a target audience that values energy efficiency and health benefits. The supply chain must be transparent, with a focus on water usage and online reviews to maintain consumer trust. Sales promotion and fiber content are effective tools for differentiating products in a crowded market, while protein content and sales growth are key performance indicators.
How is this market segmented and which is the largest segment?
The market research report provides comprehensive data (region-wise segment analysis), with forecasts and estimates in "USD million" for the period 2025-2029, as well as historical data from 2019-2023 for the following segments.
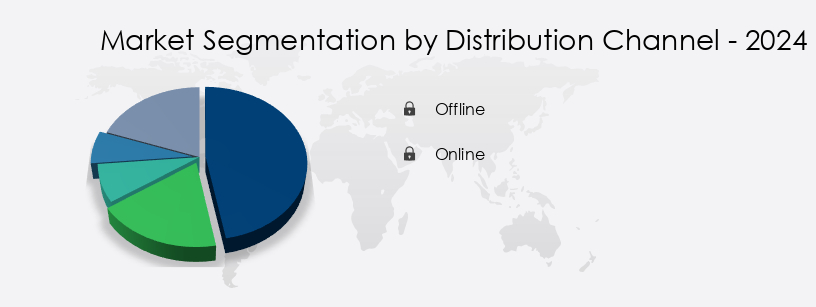
- Distribution Channel
- Offline
- Online
- Type
- Inorganic
- Organic
- Product
- Protein bars
- Nutrition bars
- Cereal bars
- Fiber bars
- Geography
- Europe
- France
- Europe
By Distribution Channel Insights
The Offline segment is estimated to witness significant growth during the forecast period. The market exhibits significant growth, driven by consumer preferences for convenient and nutritious snacking options. High-fiber and low-sugar bars are popular choices for those following active lifestyles or weight management plans. Ingredient sourcing plays a crucial role, with pea protein and casein protein gaining traction for their nutritional benefits. Cocoa powder, dried fruits, and natural flavors add taste and appeal to energy bars. Retail sales dominate, with supermarkets and hypermarkets leading as preferred distribution channels due to their wide product range and discounts.
E-commerce sales also contribute to the market's growth. Nutritional labeling and food safety regulations are essential considerations for manufacturers. Product innovation continues, with energy-boosting ingredients like soy lecithin and whey protein concentrate. Influencer marketing and social media campaigns increase brand awareness. Consumer preferences for sustainable packaging and ethical sourcing influence manufacturing processes. Shelf life and quality control are essential factors for maintaining consumer trust. Chocolate chips, chocolate bars, maple syrup, and other sweeteners add to the bars' appeal. High-protein bars, meal replacement bars, and sports bars cater to various consumer needs.
Overall, the market is dynamic, with a focus on meeting diverse consumer needs and preferences.
Get a glance at the market report of share of various segments Request Free Sample
Market Dynamics
Our France Energy Bar Market researchers analyzed the data with 2024 as the base year, along with the key drivers, trends, and challenges. A holistic analysis of drivers will help companies refine their marketing strategies to gain a competitive advantage.
What are the key market drivers leading to the rise in adoption of France Energy Bar Market?
-
Increasing demand for sports nutrition is the key driver of the market. The market is experiencing notable growth due to the increasing number of athletes and fitness enthusiasts seeking convenient and nutritious food options. Energy bars, which provide essential nutrients such as carbohydrates, protein, fat, vitamins, and minerals, are a popular choice for athletes to supplement their diet. The market is witnessing a shift in consumer demographics from core and casual users to lifestyle users. Professional athletes are considered core users, while recreational athletes and individuals adopting an active lifestyle are considered casual and lifestyle users, respectively. The increasing awareness of health and wellness, coupled with the convenience and portability of energy bars, is driving the market's growth.
-
New product development is a key strategy for companies to cater to this expanding consumer base. Product innovation includes the introduction of peanut butter bars, meal replacement bars, and keto bars, among others. Nutritional labeling and energy boosting ingredients like soy lecithin are essential for brand loyalty. Pricing strategies also play a crucial role in market competitiveness. Influencer marketing is another effective strategy to promote brand awareness and consumer engagement. The manufacturing process must adhere to stringent quality standards to ensure product safety and efficacy.
What are the market trends shaping the France Energy Bar Market?
-
Packaging trend in energy bars is the upcoming trend in the market. The energy bar market is witnessing significant innovation in packaging to cater to consumer preferences. Transparent packaging is a notable trend, allowing consumers to examine the texture and appearance of energy bars. Kind bar is an example of a company implementing this approach, showcasing the recognizable and nutrient-rich ingredients in some of its collections through front-side transparent packaging. Quality control is crucial in energy bar production, with companies using ingredients like coconut oil, maple syrup, and vegan options such as oatmeal bars to cater to various dietary needs.
-
Low-carb and protein bars, often sweetened with natural sweeteners, also remain popular. Ethical sourcing and organic certification are essential for many consumers, driving demand for bars made with sustainable and ethically-sourced ingredients. E-commerce sales continue to grow, requiring bars with extended shelf life and efficient shipping logistics. Companies prioritize quality control to meet these demands and maintain customer trust. Product differentiation is key, with private label offerings and meal replacement bars catering to various dietary restrictions.
What challenges doesFrance Energy Bar Market face during the growth?
-
Easy availability of substitutes is a key challenge affecting the market growth. Energy bars, a popular choice for quick energy boosts, face competition from various snack bars such as protein bars, cereal bars, and granola bars. Younger demographics, who engage in physical and outdoor activities, are the primary consumers of energy bars. These consumers prioritize functional and convenient foods, particularly during travel, outdoor activities, and sports. Taste, wholesome ingredients, and organic materials are essential considerations for this consumer segment. However, energy bars may face challenges due to their higher sugar content compared to other snack bars.
-
Transparency regarding ingredient composition is crucial for consumers, who often lack sufficient product information about different energy bar brands. High-protein bars, made with ingredients like brown rice protein and soy protein isolate, cater to consumers seeking enhanced nutrition. Marketing campaigns and social media strategies are essential for direct-to-consumer sales. Natural flavors and sustainable packaging are other trends that resonate with health-conscious consumers. While artificial sweeteners are an option, agave nectar and chocolate chips add natural sweetness to energy bars. Distribution channels, including both traditional and e-commerce, impact the accessibility and reach of energy bars.
Exclusive Customer Landscape
The market forecasting report includes the adoption lifecycle of the market, covering from the innovator's stage to the laggard's stage. It focuses on adoption rates in different regions based on penetration. Furthermore, the market report also includes key purchase criteria and drivers of price sensitivity to help companies evaluate and develop their market growth analysis strategies.
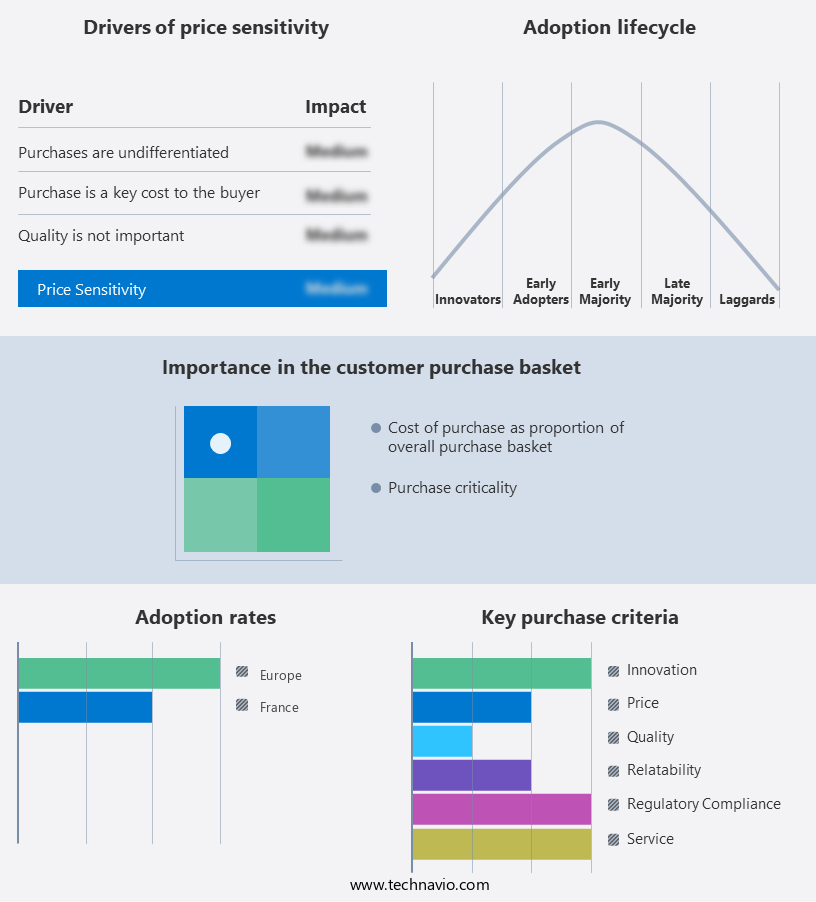
Customer Landscape
Key Companies & Market Insights
Companies are implementing various strategies, such as strategic alliances, market forecast, partnerships, mergers and acquisitions, geographical expansion, and product/service launches, to enhance their presence in the market.
Barebells Functional Foods - The company specializes in high-protein energy bars, branded as Barebells, which are free of added sugar.
The market research and growth report includes detailed analyses of the competitive landscape of the market and information about key companies, including:
- Barebells Functional Foods
- BellRing Brands Inc.
- Clif Bar and Co.
- Eat Natural Ltd.
- Eclipse Organics
- FULFIL Nutrition Ltd.
- General Mills Inc.
- GoMacro LLC
- Groupe GNG
- Kellogg Co.
- Mars Inc.
- Nestle SA
- Oatein Ltd.
- OTE Sports Ltd.
- Pulsin Ltd.
- Quest Nutrition LLC
- Silvain
- Smart Organic AD
- The Quaker Oats Co.
Qualitative and quantitative analysis of companies has been conducted to help clients understand the wider business environment as well as the strengths and weaknesses of key market players. Data is qualitatively analyzed to categorize companies as pure play, category-focused, industry-focused, and diversified; it is quantitatively analyzed to categorize companies as dominant, leading, strong, tentative, and weak.
Recent Development and News in Energy Bar Market In France
- In January 2024, Quaker Oats, a leading food manufacturing company, introduced a new line of energy bars infused with plant-based protein and functional superfoods, targeting health-conscious consumers (Quaker Oats Press Release).
- In March 2024, General Mills, another major player in the energy bar market, announced a strategic partnership with a leading sports nutrition company to expand its product offerings and reach a broader customer base (General Mills Press Release).
- In May 2024, Kind LLC, a well-known energy bar brand, secured a significant investment of USD 100 million in a funding round led by a leading private equity firm, enabling the company to expand its production capacity and global market presence (Kind LLC Press Release).
- In April 2025, the European Commission approved new regulations mandating the inclusion of specific nutritional information on energy bar packaging, aiming to promote healthier choices and increased consumer transparency (European Commission Press Release).
Research Analyst Overview
The energy bar market continues to evolve, with new product offerings and trends shaping the landscape. High-fiber and low-sugar bars are gaining popularity among consumers seeking healthier options, while ingredient sourcing and dietary restrictions are driving innovation. Pea protein and casein protein are increasingly used for their nutritional benefits, and product differentiation is achieved through the inclusion of unique ingredients such as cocoa powder, dried fruits, and nut butters. Manufacturers are focusing on energy boosting ingredients like soy lecithin, and marketing strategies are evolving to include influencer marketing and social media campaigns. Keto bars and vegan bars cater to specific consumer preferences, and brand loyalty is being fostered through sustainable packaging and ethical sourcing.
Product innovation is a key driver in the market, with new product development in meal replacement bars, muscle recovery bars, and active lifestyle bars. Pricing strategies vary, with private label offerings and direct-to-consumer sales gaining traction. Food safety regulations and quality control are essential considerations in the manufacturing process. The energy bar market is diverse, encompassing a range of product types from high-protein bars to meal replacement bars, and from chocolate bars to paleo bars. Consumer preferences are continually shifting, and manufacturers must stay agile to meet evolving demands. The market is dynamic, with new trends and product offerings emerging regularly.
The Energy Bar Market in France is witnessing robust growth driven by evolving consumer preferences toward healthier snacking options. Products like gluten-free bars, organic bars, highfiber bars, and lowcarb bars are gaining traction among health-conscious consumers. French brands are emphasizing the use of whole grains to appeal to clean-label enthusiasts. However, scrutiny over ingredients such as palm oil is prompting a shift toward more sustainable formulations. Strategic use of health claimsâlike improved digestion or energy boostâis key to attracting informed buyers. Meanwhile, social media marketing plays a pivotal role in brand visibility and consumer engagement, particularly among younger demographics.
The Energy Bar Market in France is evolving with growing consumer demand for transparency and health-conscious snacking. Shoppers are paying close attention to fat content and calorie count, prioritizing options that align with their dietary goals. Brands are responding by refining recipes and offering clearer labeling to support informed choices. Supply chain transparency has become a key differentiator, with companies emphasizing ethical sourcing and production practices. Positive consumer reviews are also shaping market trends, influencing purchasing decisions and boosting brand credibility. To meet rising demand efficiently, many producers are expanding their reach through wholesale distribution, ensuring widespread availability in health stores, gyms, and supermarkets.
Dive into Technavio's strong research methodology, blending expert interviews, extensive data synthesis, and validated models for unparalleled Energy Bar Market in France insights. See full methodology.
|
Market Scope |
|
|
Report Coverage |
Details |
|
Page number |
161 |
|
Base year |
2024 |
|
Historic period |
2019-2023 |
|
Forecast period |
2025-2029 |
|
Growth momentum & CAGR |
Accelerate at a CAGR of 5.4% |
|
Market growth 2025-2029 |
USD 10.2 million |
|
Market structure |
Fragmented |
|
YoY growth 2024-2025(%) |
5.0 |
|
Key countries |
France |
|
Competitive landscape |
Leading Companies, Market Positioning of Companies, Competitive Strategies, and Industry Risks |
What are the Key Data Covered in this Market Research and Growth Report?
- CAGR of the market during the forecast period
- Detailed information on factors that will drive the market growth and forecasting between 2025 and 2029
- Precise estimation of the size of the market and its contribution of the market in focus to the parent market
- Accurate predictions about upcoming market growth and trends and changes in consumer behaviour
- Growth of the market across France
- Thorough analysis of the market's competitive landscape and detailed information about companies
- Comprehensive analysis of factors that will challenge the growth of market companies
We can help! Our analysts can customize this market research report to meet your requirements. Get in touch
 RIA -
RIA - 
