Peanut Butter Market Analysis, Size, and Forecast 2026-2030: North America (US, Canada, and Mexico), South America (Brazil and Argentina), Europe (Germany, UK, and The Netherlands), APAC (China, India, and Japan), Middle East and Africa (Saudi Arabia, South Africa, and UAE), and Rest of World (ROW)

Peanut Butter Market Analysis, Size, and Forecast 2026-2030:
North America (US, Canada, and Mexico), South America (Brazil and Argentina), Europe (Germany, UK, and The Netherlands), APAC (China, India, and Japan), Middle East and Africa (Saudi Arabia, South Africa, and UAE), and Rest of World (ROW)

Published: Apr 2026 292 Pages SKU: IRTNTR45588

Market Overview at a Glance

$1.55 B
Market Opportunity
6.3%
CAGR 2025 - 2030
55.7%
North America Growth
$3.63 B
Offline segment 2024

Peanut Butter Market Size 2026-2030

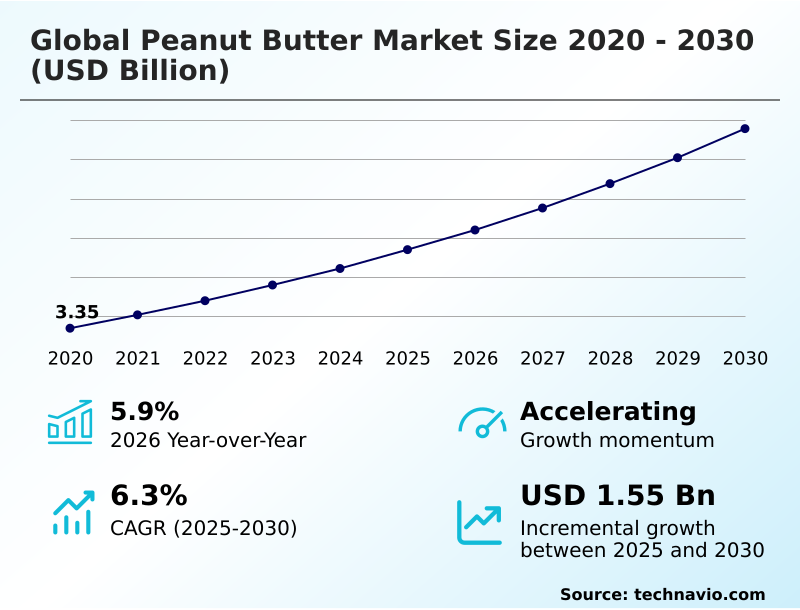
The peanut butter market size is valued to increase by USD 1.55 billion, at a CAGR of 6.3% from 2025 to 2030. Heightened consumer emphasis on health, wellness, and plant-based nutrition will drive the peanut butter market.

Major Market Trends & Insights

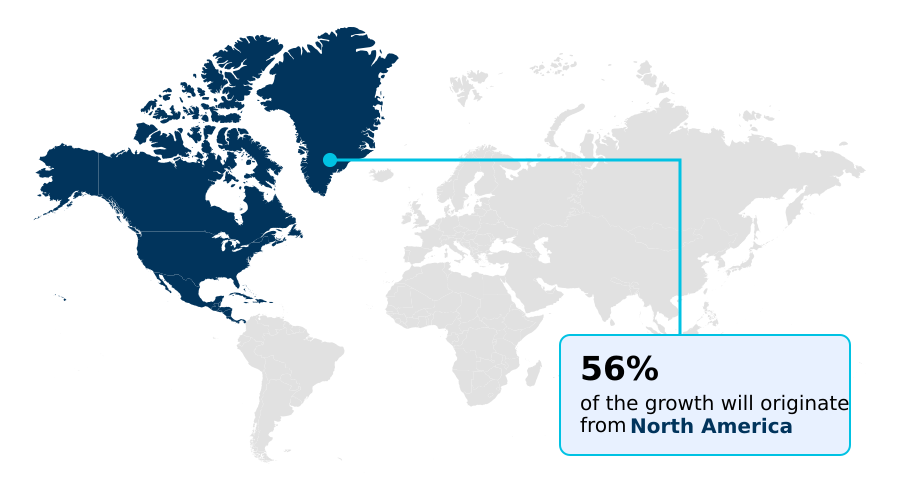
  • North America dominated the market and accounted for a 55.7% growth during the forecast period.
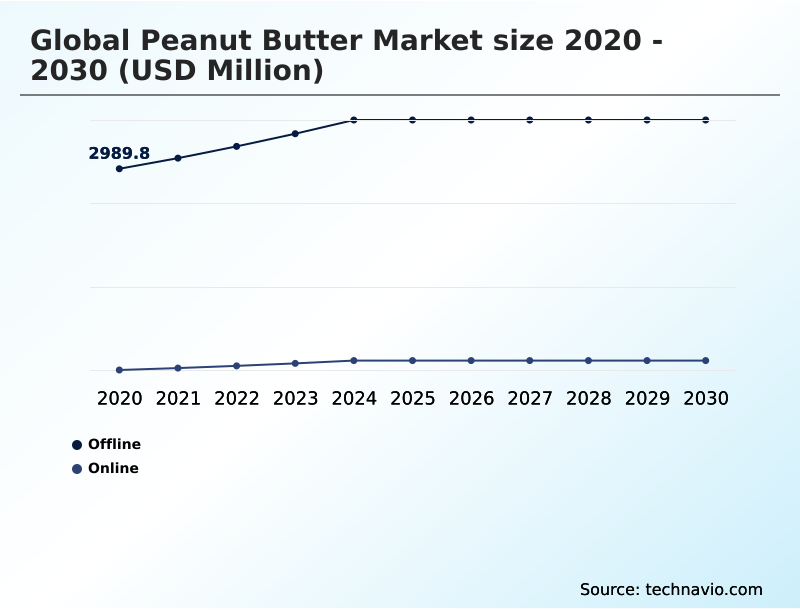
  • By Distribution Channel - Offline segment was valued at USD 3.63 billion in 2024
  • By Type - Crunchy segment accounted for the largest market revenue share in 2024

Market Size & Forecast

  • Market Opportunities: USD 2.54 billion
  • Market Future Opportunities: USD 1.55 billion
  • CAGR from 2025 to 2030 : 6.3%

Market Summary

  • The peanut butter market is undergoing a significant transformation driven by evolving consumer health consciousness and demand for convenient, nutrient-dense foods. The shift towards plant-based diets has elevated the status of peanut butter as a primary source of protein and monounsaturated fats, moving it from a simple spread to a functional health food.
  • This is fueling innovation, leading to a proliferation of clean label products, including organic formulations and no-sugar-added varieties, alongside a growing interest in gourmet flavors. Concurrently, the industry is adapting to modern lifestyles with formats like single-serving packs and squeeze pouches for on-the-go consumption. However, manufacturers must navigate significant operational hurdles.
  • For instance, a company aiming to launch a new all-natural version must implement stringent allergen control programs to prevent cross-contamination, a costly but non-negotiable process. They must also develop a resilient supply chain strategy to buffer against the volatility of raw material pricing, which can directly impact profitability.
  • Balancing these innovative opportunities with operational and safety challenges is the central dynamic defining the market today.

What will be the Size of the Peanut Butter Market during the forecast period?

Get Key Insights on Market Forecast (PDF) Request Free Sample

How is the Peanut Butter Market Segmented?

The peanut butter industry research report provides comprehensive data (region-wise segment analysis), with forecasts and estimates in "USD million" for the period 2026-2030, as well as historical data from 2020-2024 for the following segments.

  • Distribution channel
    • Offline
    • Online
  • Type
    • Crunchy
    • Creamy
    • Others
  • Product type
    • Plain
    • Flavored
  • Geography
    • North America
      • US
      • Canada
      • Mexico
    • South America
      • Brazil
      • Argentina
    • Europe
      • Germany
      • UK
      • The Netherlands
    • APAC
      • China
      • India
      • Japan
    • Middle East and Africa
      • Saudi Arabia
      • South Africa
      • UAE
    • Rest of World (ROW)

By Distribution Channel Insights

The offline segment is estimated to witness significant growth during the forecast period.

The offline channel, encompassing hypermarkets and convenience stores, remains the dominant sales pathway, where securing premium shelf placement is critical to influence consumer preferences and mitigate product commoditization.

While traditional offerings with creamy texture and crunchy texture are staples, retailers are expanding assortments to include natural peanut butter to meet health-driven demand. This channel is also vital for foodservice applications.

The competition between national brands and private label peanut butter intensifies the need for product differentiation through clear allergen declarations and innovative formats like single-serving packs.

Efficient management of shelf-stable spreads is crucial, as supply chain instability can disrupt availability and impact brand loyalty, with North America alone representing an opportunity of over 55%.

Request Free Sample

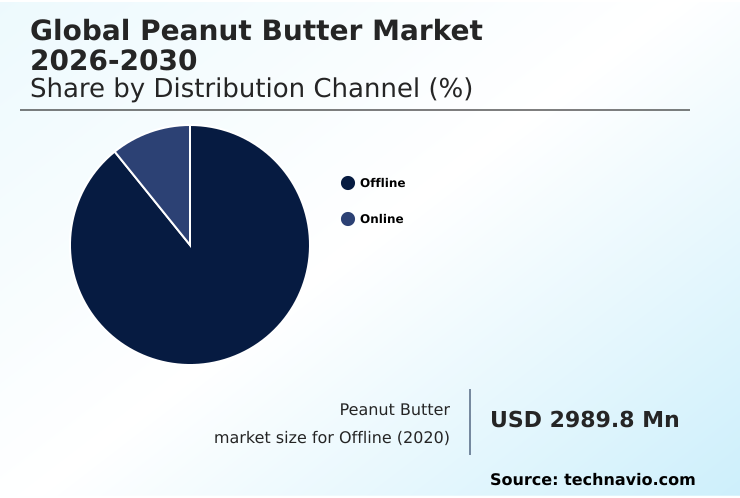
The Offline segment was valued at USD 3.63 billion in 2024 and showed a gradual increase during the forecast period.

Request Free Sample

Regional Analysis

North America is estimated to contribute 55.7% to the growth of the global market during the forecast period.Technavio’s analysts have elaborately explained the regional trends and drivers that shape the market during the forecast period.

See How Peanut Butter Market Demand is Rising in North America Request Free Sample

The global geographic landscape is characterized by varied maturity levels and growth drivers. North America, while a mature market, continues to present over 55% of the incremental growth opportunity, driven by premiumization and demand for healthy peanut butter.

In contrast, APAC is an emerging region where rising incomes and Western dietary influences are boosting interest in peanut butter nutrition and plant-based protein, with e-commerce platforms being a key enabler of this growth.

Optimized regional supply chains in North America reduce logistics costs by over 20% compared to fragmented distribution in developing markets. Across regions, a universal trend is the push for organic formulations and gourmet flavors.

This requires adapting to local tastes while managing raw material pricing and implementing strict allergen control programs.

Market Dynamics

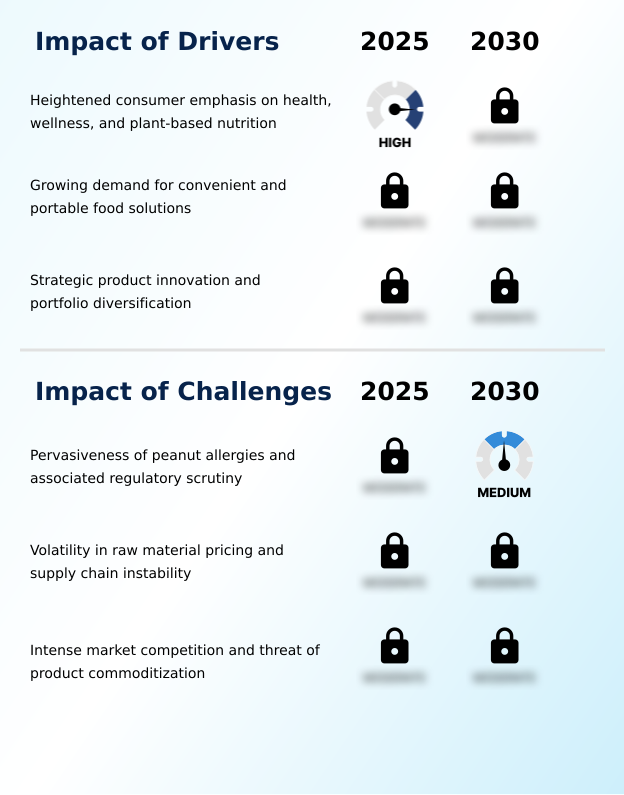
Our researchers analyzed the data with 2025 as the base year, along with the key drivers, trends, and challenges. A holistic analysis of drivers will help companies refine their marketing strategies to gain a competitive advantage.

  • Understanding the nuances of the global peanut butter market requires looking beyond broad trends to specific consumer behaviors and product attributes. The classic creamy vs crunchy peanut butter preference remains a key segmentation, but decisions are increasingly influenced by specific health goals.
  • Consumers actively research the benefits of natural peanut butter and seek out the best peanut butter for keto diet plans or products specifically designed for peanut butter for muscle building. This has led to the popularity of low calorie powdered peanut butter uses in smoothies and baking.
  • A significant driver of premiumization is ingredient scrutiny, with a growing demand for peanut butter without hydrogenated oils and a desire to understand how is organic peanut butter made. These consumer trends in nut butter market are forcing brands to innovate continuously, leading to new flavored peanut butter market trends and advancements in peanut butter packaging innovations.
  • Operationally, the challenges in peanut butter supply chain, such as the impact of peanut prices on market, remain a primary concern. Simultaneously, the growth of private label peanut butter adds competitive pressure. Public health issues, such as the dangers of peanut allergies in schools, necessitate clear marketing and create a market for substitutes for peanut butter allergies.
  • Brands that clearly communicate their value proposition, such as being one of the leading clean label peanut butter brands, report customer retention rates that are twice as high as competitors with less transparent marketing strategies for peanut butter.

What are the key market drivers leading to the rise in the adoption of Peanut Butter Industry?

  • The market's growth is primarily driven by a heightened consumer emphasis on health, wellness, and plant-based nutrition.

  • The market's momentum is heavily fueled by the global health and wellness movement, with consumers actively seeking out products with a strong nutritional profile.
  • The demand for clean label products and all-natural versions rich in monounsaturated fats has become a primary driver.
  • As a source of vegan protein sources, peanut butter's appeal has broadened considerably, with products marketed as protein-rich spreads seeing a search volume increase of over 50% year-over-year.
  • Convenience is another critical factor, addressed through innovative formats like squeeze pouches, which are ideal for on-the-go peanut butter snacks.
  • The peanut butter manufacturing process is also evolving to create low-sugar peanut butter and low-sodium varieties for sports nutrition spreads, often enhanced with whey protein, catering to an audience that scrutinizes every ingredient.

What are the market trends shaping the Peanut Butter Industry?

  • The market is increasingly shaped by the ascent of clean label and minimally processed formulations. This trend reflects a significant consumer shift toward products with simple, transparent ingredients.

  • A significant trend is the market's expansion into premium and functional categories, driven by consumer demand for products aligning with specific health objectives. The rise of alternative nut butters and seed butters, often marketed as peanut allergy alternatives, has compelled innovation. This has led to a surge in fortified peanut butters containing functional ingredients like probiotics and omega-3 fatty acids.
  • These premium nut butters, including artisanal peanut butter variants with non-gmo verification, often command a 40% higher price point. This trend toward ingredient transparency and products with no palm oil spreads is particularly appealing to consumers following specific lifestyles, such as those seeking ketogenic diet snacks.
  • Brands that successfully innovate in this space report a 25% higher repeat purchase rate, underscoring the value of catering to these sophisticated preferences.

What challenges does the Peanut Butter Industry face during its growth?

  • A key challenge affecting industry growth is the pervasiveness of peanut allergies and the associated regulatory scrutiny.

  • The market faces significant operational and competitive challenges, primarily stemming from agricultural dependencies and consumer health concerns. Volatility in the price of dry-roasted peanuts can cause raw material pricing fluctuations of up to 35% annually, impacting everything from bulk peanut butter supply to consumer-facing dietary spreads. This necessitates sophisticated food ingredient solutions to maintain stable costs.
  • Formulating a shelf-stable food paste without traditional stabilizers or hydrogenated oils, which prevents natural peanut oil separation, is a technical hurdle for natural food spreads. Furthermore, the market is highly competitive, with private label offerings capturing over 30% of the share in some regions.
  • This pressures brands to innovate beyond simple peanut butter recipes into areas like savory spices to differentiate their culinary applications.

Exclusive Technavio Analysis on Customer Landscape

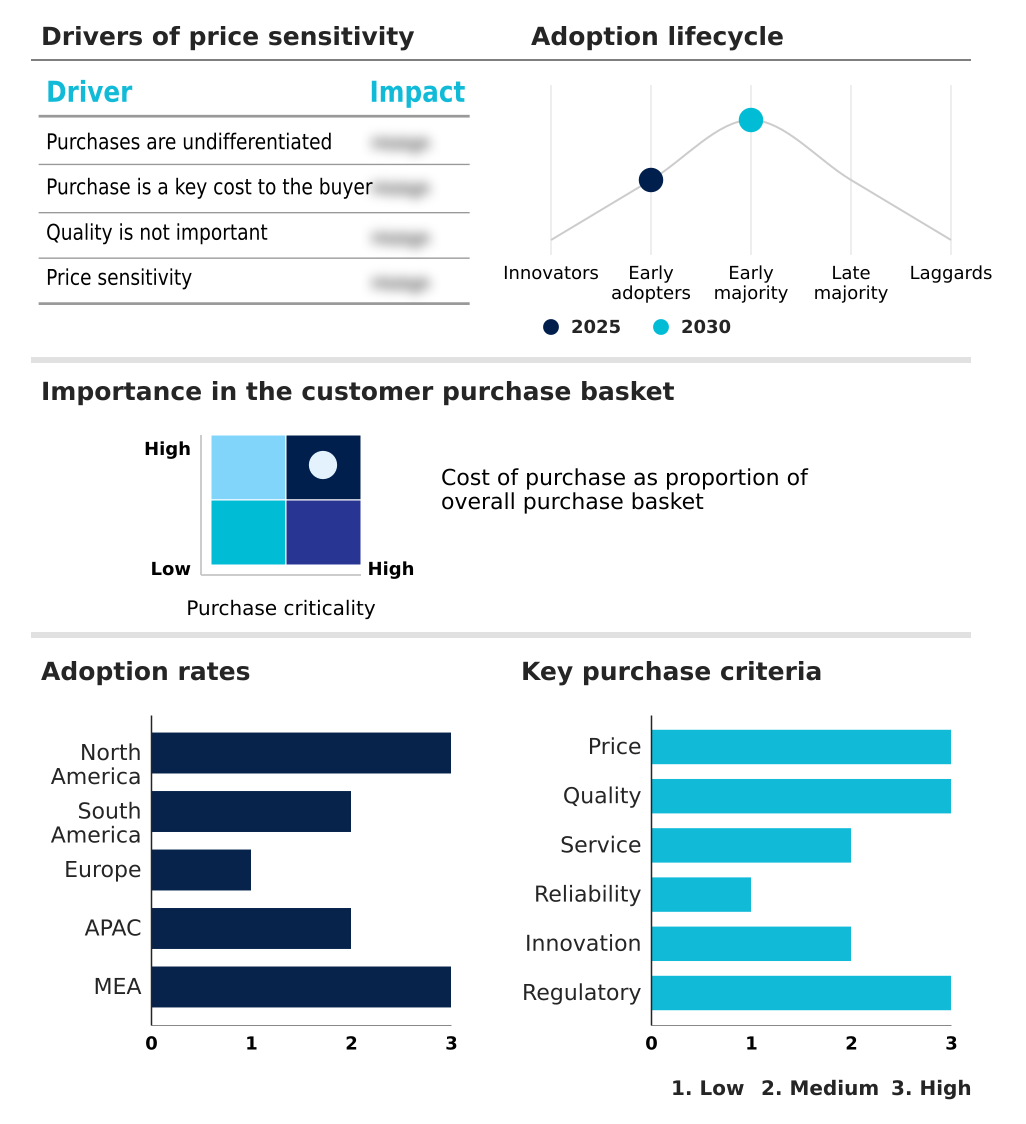
The peanut butter market forecasting report includes the adoption lifecycle of the market, covering from the innovator’s stage to the laggard’s stage. It focuses on adoption rates in different regions based on penetration. Furthermore, the peanut butter market report also includes key purchase criteria and drivers of price sensitivity to help companies evaluate and develop their market growth analysis strategies.

Customer Landscape of Peanut Butter Industry

Competitive Landscape

Companies are implementing various strategies, such as strategic alliances, peanut butter market forecast, partnerships, mergers and acquisitions, geographical expansion, and product/service launches, to enhance their presence in the industry.

Algood Food Co. - Delivers a comprehensive portfolio of branded food products, specializing in protein-rich spreads for global retail, foodservice, and international consumer markets.

The industry research and growth report includes detailed analyses of the competitive landscape of the market and information about key companies, including:

  • Algood Food Co.
  • China Kunyu Industrial
  • Galdisa USA Inc.
  • Hormel Foods Corp.
  • ManiLife
  • Nuflower
  • Nuts N More
  • NuttZo LLC
  • Oetker Group
  • Peanut Butter and Co.
  • Pip and Nut Ltd.
  • Post Holdings Inc.
  • Sonya Foods Pvt. Ltd.
  • Swartberg B.V.
  • Teddie Natural Peanut Butter
  • The Hain Celestial Group
  • The J.M. Smucker Co.
  • The Kraft Heinz Co.
  • The Kroger Co.
  • Unilever PLC

Qualitative and quantitative analysis of companies has been conducted to help clients understand the wider business environment as well as the strengths and weaknesses of key industry players. Data is qualitatively analyzed to categorize companies as pure play, category-focused, industry-focused, and diversified; it is quantitatively analyzed to categorize companies as dominant, leading, strong, tentative, and weak.

Recent Development and News in Peanut butter market

  • In April 2025, Hormel Foods Corp. launched a limited-edition honey-cinnamon flavored variant of its Skippy brand, leveraging a collaboration with a wellness influencer to drive social media engagement and appeal to consumers seeking novel taste experiences.
  • In January 2025, The J.M. Smucker Co. announced a significant investment in a new peanut roasting facility in Georgia to enhance supply chain efficiency and support the growth of its natural product lines.
  • In October 2024, The Kroger Co. expanded its Simple Truth organic private label to include a fortified peanut butter with added plant-based protein and omega-3s, directly targeting health-conscious shoppers.
  • In September 2024, Pip and Nut Ltd. partnered with a sustainable packaging provider to convert its entire product range to jars made from 100% recycled materials, addressing consumer demand for environmental responsibility.

Dive into Technavio’s robust research methodology, blending expert interviews, extensive data synthesis, and validated models for unparalleled Peanut Butter Market insights. See full methodology.

Market Scope
Page number 292
Base year 2025
Historic period 2020-2024
Forecast period 2026-2030
Growth momentum & CAGR Accelerate at a CAGR of 6.3%
Market growth 2026-2030 USD 1545.5 million
Market structure Fragmented
YoY growth 2025-2026(%) 5.9%
Key countries US, Canada, Mexico, Brazil, Argentina, Chile, Germany, UK, The Netherlands, France, Italy, Spain, China, India, Japan, Australia, South Korea, Indonesia, Saudi Arabia, South Africa, UAE, Turkey and Israel
Competitive landscape Leading Companies, Market Positioning of Companies, Competitive Strategies, and Industry Risks

Request Free Sample

Research Analyst Overview

  • The peanut butter market's evolution is defined by a strategic pivot toward health-centric and transparent manufacturing. The industry is moving beyond its traditional food paste form, focusing on an enhanced nutritional profile rich in plant-based protein and monounsaturated fats.
  • Key to this transition is the development of clean label products, including all-natural versions and organic formulations that avoid hydrogenated oils and stabilizers, addressing the issue of peanut oil separation naturally. Formats are diversifying from bulk jars to convenient single-serving packs and squeeze pouches.
  • Product innovation is rampant, with the introduction of powdered peanut butter, fortified peanut butters with functional ingredients like whey protein, omega-3 fatty acids, and probiotics, and a wide array of gourmet flavors with savory spices. This shift places immense pressure on operations, where stringent allergen control programs are now standard, improving line changeover efficiency by over 30%.
  • Boardroom decisions are increasingly focused on navigating supply chain instability and volatile raw material pricing. This involves a delicate balance between achieving premiumization with no-sugar-added and low-sodium varieties and avoiding product commoditization, all while ensuring strict compliance with allergen declarations.

What are the Key Data Covered in this Peanut Butter Market Research and Growth Report?

  • What is the expected growth of the Peanut Butter Market between 2026 and 2030?

    • USD 1.55 billion, at a CAGR of 6.3%

  • What segmentation does the market report cover?

    • The report is segmented by Distribution Channel (Offline, and Online), Type (Crunchy, Creamy, and Others), Product Type (Plain, and Flavored) and Geography (North America, South America, Europe, APAC, Middle East and Africa)

  • Which regions are analyzed in the report?

    • North America, South America, Europe, APAC and Middle East and Africa

  • What are the key growth drivers and market challenges?

    • Heightened consumer emphasis on health, wellness, and plant-based nutrition, Pervasiveness of peanut allergies and associated regulatory scrutiny

  • Who are the major players in the Peanut Butter Market?

    • Algood Food Co., China Kunyu Industrial, Galdisa USA Inc., Hormel Foods Corp., ManiLife, Nuflower, Nuts N More, NuttZo LLC, Oetker Group, Peanut Butter and Co., Pip and Nut Ltd., Post Holdings Inc., Sonya Foods Pvt. Ltd., Swartberg B.V., Teddie Natural Peanut Butter, The Hain Celestial Group, The J.M. Smucker Co., The Kraft Heinz Co., The Kroger Co. and Unilever PLC

Market Research Insights

  • Market dynamics are increasingly shaped by sophisticated consumer preferences and a focus on measurable health outcomes, driving product differentiation. For example, brands that emphasize ingredient transparency and ethical sourcing are seeing a 15% higher consumer loyalty rate than their conventional counterparts.
  • On the operational side, the adoption of advanced food ingredient solutions allows for greater flexibility in creating specialized dietary spreads for sports nutrition or ketogenic diet snacks. Furthermore, the strategic use of e-commerce platforms has proven to increase market reach to niche consumer segments by over 40%.
  • The focus on sustainable packaging is not just an ethical consideration; it directly impacts brand perception and repeat purchases. This complex interplay of consumer demands and operational efficiencies defines the competitive landscape.

We can help! Our analysts can customize this peanut butter market research report to meet your requirements.

Get in touch

1. Executive Summary

1.1 Market overview

Executive Summary - Chart on Market Overview
Executive Summary - Data Table on Market Overview
Executive Summary - Chart on Global Market Characteristics
Executive Summary - Chart on Market by Geography
Executive Summary - Chart on Market Segmentation by Distribution Channel
Executive Summary - Chart on Market Segmentation by Type
Executive Summary - Chart on Market Segmentation by Product Type
Executive Summary - Chart on Incremental Growth
Executive Summary - Data Table on Incremental Growth
Executive Summary - Chart on Company Market Positioning

2. Technavio Analysis

2.1 Analysis of price sensitivity, lifecycle, customer purchase basket, adoption rates, and purchase criteria

2.2 Criticality of inputs and Factors of differentiation

Chart on Overview on criticality of inputs and factors of differentiation

2.3 Factors of disruption

Chart on Overview on factors of disruption

2.4 Impact of drivers and challenges

Chart on Impact of drivers and challenges in 2025 and 2030

3. Market Landscape

3.1 Market ecosystem

Chart on Parent Market
Data Table on - Parent Market

3.2 Market characteristics

Chart on Market characteristics analysis

3.3 Value chain analysis

Chart on Value chain analysis

4. Market Sizing

4.1 Market definition

Data Table on Offerings of companies included in the market definition

4.2 Market segment analysis

Market segments

4.3 Market size 2025

4.4 Market outlook: Forecast for 2025-2030

Chart on Global - Market size and forecast 2025-2030 ($ million)
Data Table on Global - Market size and forecast 2025-2030 ($ million)
Chart on Global Market: Year-over-year growth 2025-2030 (%)
Data Table on Global Market: Year-over-year growth 2025-2030 (%)

5. Historic Market Size

5.1 Global Peanut Butter Market 2020 - 2024

Historic Market Size - Data Table on Global Peanut Butter Market 2020 - 2024 ($ million)

5.2 Distribution Channel segment analysis 2020 - 2024

Historic Market Size - Distribution Channel Segment 2020 - 2024 ($ million)

5.3 Type segment analysis 2020 - 2024

Historic Market Size - Type Segment 2020 - 2024 ($ million)

5.4 Product Type segment analysis 2020 - 2024

Historic Market Size - Product Type Segment 2020 - 2024 ($ million)

5.5 Geography segment analysis 2020 - 2024

Historic Market Size - Geography Segment 2020 - 2024 ($ million)

5.6 Country segment analysis 2020 - 2024

Historic Market Size - Country Segment 2020 - 2024 ($ million)

6. Qualitative Analysis

6.1 Impact of AI on global peanut butter market

6.2 Impact of geopolitical conflicts on global peanut butter market

7. Five Forces Analysis

7.1 Five forces summary

Five forces analysis - Comparison between 2025 and 2030

7.2 Bargaining power of buyers

Bargaining power of buyers - Impact of key factors 2025 and 2030

7.3 Bargaining power of suppliers

Bargaining power of suppliers - Impact of key factors in 2025 and 2030

7.4 Threat of new entrants

Threat of new entrants - Impact of key factors in 2025 and 2030

7.5 Threat of substitutes

Threat of substitutes - Impact of key factors in 2025 and 2030

7.6 Threat of rivalry

Threat of rivalry - Impact of key factors in 2025 and 2030

7.7 Market condition

Chart on Market condition - Five forces 2025 and 2030

8. Market Segmentation by Distribution Channel

8.1 Market segments

Chart on Distribution Channel - Market share 2025-2030 (%)
Data Table on Distribution Channel - Market share 2025-2030 (%)

8.2 Comparison by Distribution Channel

Chart on Comparison by Distribution Channel
Data Table on Comparison by Distribution Channel

8.3 Offline - Market size and forecast 2025-2030

Chart on Offline - Market size and forecast 2025-2030 ($ million)
Data Table on Offline - Market size and forecast 2025-2030 ($ million)
Chart on Offline - Year-over-year growth 2025-2030 (%)
Data Table on Offline - Year-over-year growth 2025-2030 (%)

8.4 Online - Market size and forecast 2025-2030

Chart on Online - Market size and forecast 2025-2030 ($ million)
Data Table on Online - Market size and forecast 2025-2030 ($ million)
Chart on Online - Year-over-year growth 2025-2030 (%)
Data Table on Online - Year-over-year growth 2025-2030 (%)

8.5 Market opportunity by Distribution Channel

Market opportunity by Distribution Channel ($ million)
Data Table on Market opportunity by Distribution Channel ($ million)

9. Market Segmentation by Type

9.1 Market segments

Chart on Type - Market share 2025-2030 (%)
Data Table on Type - Market share 2025-2030 (%)

9.2 Comparison by Type

Chart on Comparison by Type
Data Table on Comparison by Type

9.3 Crunchy - Market size and forecast 2025-2030

Chart on Crunchy - Market size and forecast 2025-2030 ($ million)
Data Table on Crunchy - Market size and forecast 2025-2030 ($ million)
Chart on Crunchy - Year-over-year growth 2025-2030 (%)
Data Table on Crunchy - Year-over-year growth 2025-2030 (%)

9.4 Creamy - Market size and forecast 2025-2030

Chart on Creamy - Market size and forecast 2025-2030 ($ million)
Data Table on Creamy - Market size and forecast 2025-2030 ($ million)
Chart on Creamy - Year-over-year growth 2025-2030 (%)
Data Table on Creamy - Year-over-year growth 2025-2030 (%)

9.5 Others - Market size and forecast 2025-2030

Chart on Others - Market size and forecast 2025-2030 ($ million)
Data Table on Others - Market size and forecast 2025-2030 ($ million)
Chart on Others - Year-over-year growth 2025-2030 (%)
Data Table on Others - Year-over-year growth 2025-2030 (%)

9.6 Market opportunity by Type

Market opportunity by Type ($ million)
Data Table on Market opportunity by Type ($ million)

10. Market Segmentation by Product Type

10.1 Market segments

Chart on Product Type - Market share 2025-2030 (%)
Data Table on Product Type - Market share 2025-2030 (%)

10.2 Comparison by Product Type

Chart on Comparison by Product Type
Data Table on Comparison by Product Type

10.3 Plain - Market size and forecast 2025-2030

Chart on Plain - Market size and forecast 2025-2030 ($ million)
Data Table on Plain - Market size and forecast 2025-2030 ($ million)
Chart on Plain - Year-over-year growth 2025-2030 (%)
Data Table on Plain - Year-over-year growth 2025-2030 (%)

10.4 Flavored - Market size and forecast 2025-2030

Chart on Flavored - Market size and forecast 2025-2030 ($ million)
Data Table on Flavored - Market size and forecast 2025-2030 ($ million)
Chart on Flavored - Year-over-year growth 2025-2030 (%)
Data Table on Flavored - Year-over-year growth 2025-2030 (%)

10.5 Market opportunity by Product Type

Market opportunity by Product Type ($ million)
Data Table on Market opportunity by Product Type ($ million)

11. Customer Landscape

11.1 Customer landscape overview

Analysis of price sensitivity, lifecycle, customer purchase basket, adoption rates, and purchase criteria

12. Geographic Landscape

12.1 Geographic segmentation

Chart on Market share by geography 2025-2030 (%)
Data Table on Market share by geography 2025-2030 (%)

12.2 Geographic comparison

Chart on Geographic comparison
Data Table on Geographic comparison

12.3 North America - Market size and forecast 2025-2030

Chart on North America - Market size and forecast 2025-2030 ($ million)
Data Table on North America - Market size and forecast 2025-2030 ($ million)
Chart on North America - Year-over-year growth 2025-2030 (%)
Data Table on North America - Year-over-year growth 2025-2030 (%)
Chart on Regional Comparison - North America
Data Table on Regional Comparison - North America

12.3.1 US - Market size and forecast 2025-2030

Chart on US - Market size and forecast 2025-2030 ($ million)
Data Table on US - Market size and forecast 2025-2030 ($ million)
Chart on US - Year-over-year growth 2025-2030 (%)
Data Table on US - Year-over-year growth 2025-2030 (%)

12.3.2 Canada - Market size and forecast 2025-2030

Chart on Canada - Market size and forecast 2025-2030 ($ million)
Data Table on Canada - Market size and forecast 2025-2030 ($ million)
Chart on Canada - Year-over-year growth 2025-2030 (%)
Data Table on Canada - Year-over-year growth 2025-2030 (%)

12.3.3 Mexico - Market size and forecast 2025-2030

Chart on Mexico - Market size and forecast 2025-2030 ($ million)
Data Table on Mexico - Market size and forecast 2025-2030 ($ million)
Chart on Mexico - Year-over-year growth 2025-2030 (%)
Data Table on Mexico - Year-over-year growth 2025-2030 (%)

12.4 South America - Market size and forecast 2025-2030

Chart on South America - Market size and forecast 2025-2030 ($ million)
Data Table on South America - Market size and forecast 2025-2030 ($ million)
Chart on South America - Year-over-year growth 2025-2030 (%)
Data Table on South America - Year-over-year growth 2025-2030 (%)
Chart on Regional Comparison - South America
Data Table on Regional Comparison - South America

12.4.1 Brazil - Market size and forecast 2025-2030

Chart on Brazil - Market size and forecast 2025-2030 ($ million)
Data Table on Brazil - Market size and forecast 2025-2030 ($ million)
Chart on Brazil - Year-over-year growth 2025-2030 (%)
Data Table on Brazil - Year-over-year growth 2025-2030 (%)

12.4.2 Argentina - Market size and forecast 2025-2030

Chart on Argentina - Market size and forecast 2025-2030 ($ million)
Data Table on Argentina - Market size and forecast 2025-2030 ($ million)
Chart on Argentina - Year-over-year growth 2025-2030 (%)
Data Table on Argentina - Year-over-year growth 2025-2030 (%)

12.4.3 Chile - Market size and forecast 2025-2030

Chart on Chile - Market size and forecast 2025-2030 ($ million)
Data Table on Chile - Market size and forecast 2025-2030 ($ million)
Chart on Chile - Year-over-year growth 2025-2030 (%)
Data Table on Chile - Year-over-year growth 2025-2030 (%)

12.5 Europe - Market size and forecast 2025-2030

Chart on Europe - Market size and forecast 2025-2030 ($ million)
Data Table on Europe - Market size and forecast 2025-2030 ($ million)
Chart on Europe - Year-over-year growth 2025-2030 (%)
Data Table on Europe - Year-over-year growth 2025-2030 (%)
Chart on Regional Comparison - Europe
Data Table on Regional Comparison - Europe

12.5.1 Germany - Market size and forecast 2025-2030

Chart on Germany - Market size and forecast 2025-2030 ($ million)
Data Table on Germany - Market size and forecast 2025-2030 ($ million)
Chart on Germany - Year-over-year growth 2025-2030 (%)
Data Table on Germany - Year-over-year growth 2025-2030 (%)

12.5.2 UK - Market size and forecast 2025-2030

Chart on UK - Market size and forecast 2025-2030 ($ million)
Data Table on UK - Market size and forecast 2025-2030 ($ million)
Chart on UK - Year-over-year growth 2025-2030 (%)
Data Table on UK - Year-over-year growth 2025-2030 (%)

12.5.3 The Netherlands - Market size and forecast 2025-2030

Chart on The Netherlands - Market size and forecast 2025-2030 ($ million)
Data Table on The Netherlands - Market size and forecast 2025-2030 ($ million)
Chart on The Netherlands - Year-over-year growth 2025-2030 (%)
Data Table on The Netherlands - Year-over-year growth 2025-2030 (%)

12.5.4 France - Market size and forecast 2025-2030

Chart on France - Market size and forecast 2025-2030 ($ million)
Data Table on France - Market size and forecast 2025-2030 ($ million)
Chart on France - Year-over-year growth 2025-2030 (%)
Data Table on France - Year-over-year growth 2025-2030 (%)

12.5.5 Italy - Market size and forecast 2025-2030

Chart on Italy - Market size and forecast 2025-2030 ($ million)
Data Table on Italy - Market size and forecast 2025-2030 ($ million)
Chart on Italy - Year-over-year growth 2025-2030 (%)
Data Table on Italy - Year-over-year growth 2025-2030 (%)

12.5.6 Spain - Market size and forecast 2025-2030

Chart on Spain - Market size and forecast 2025-2030 ($ million)
Data Table on Spain - Market size and forecast 2025-2030 ($ million)
Chart on Spain - Year-over-year growth 2025-2030 (%)
Data Table on Spain - Year-over-year growth 2025-2030 (%)

12.6 APAC - Market size and forecast 2025-2030

Chart on APAC - Market size and forecast 2025-2030 ($ million)
Data Table on APAC - Market size and forecast 2025-2030 ($ million)
Chart on APAC - Year-over-year growth 2025-2030 (%)
Data Table on APAC - Year-over-year growth 2025-2030 (%)
Chart on Regional Comparison - APAC
Data Table on Regional Comparison - APAC

12.6.1 China - Market size and forecast 2025-2030

Chart on China - Market size and forecast 2025-2030 ($ million)
Data Table on China - Market size and forecast 2025-2030 ($ million)
Chart on China - Year-over-year growth 2025-2030 (%)
Data Table on China - Year-over-year growth 2025-2030 (%)

12.6.2 India - Market size and forecast 2025-2030

Chart on India - Market size and forecast 2025-2030 ($ million)
Data Table on India - Market size and forecast 2025-2030 ($ million)
Chart on India - Year-over-year growth 2025-2030 (%)
Data Table on India - Year-over-year growth 2025-2030 (%)

12.6.3 Japan - Market size and forecast 2025-2030

Chart on Japan - Market size and forecast 2025-2030 ($ million)
Data Table on Japan - Market size and forecast 2025-2030 ($ million)
Chart on Japan - Year-over-year growth 2025-2030 (%)
Data Table on Japan - Year-over-year growth 2025-2030 (%)

12.6.4 Australia - Market size and forecast 2025-2030

Chart on Australia - Market size and forecast 2025-2030 ($ million)
Data Table on Australia - Market size and forecast 2025-2030 ($ million)
Chart on Australia - Year-over-year growth 2025-2030 (%)
Data Table on Australia - Year-over-year growth 2025-2030 (%)

12.6.5 South Korea - Market size and forecast 2025-2030

Chart on South Korea - Market size and forecast 2025-2030 ($ million)
Data Table on South Korea - Market size and forecast 2025-2030 ($ million)
Chart on South Korea - Year-over-year growth 2025-2030 (%)
Data Table on South Korea - Year-over-year growth 2025-2030 (%)

12.6.6 Indonesia - Market size and forecast 2025-2030

Chart on Indonesia - Market size and forecast 2025-2030 ($ million)
Data Table on Indonesia - Market size and forecast 2025-2030 ($ million)
Chart on Indonesia - Year-over-year growth 2025-2030 (%)
Data Table on Indonesia - Year-over-year growth 2025-2030 (%)

12.7 Middle East and Africa - Market size and forecast 2025-2030

Chart on Middle East and Africa - Market size and forecast 2025-2030 ($ million)
Data Table on Middle East and Africa - Market size and forecast 2025-2030 ($ million)
Chart on Middle East and Africa - Year-over-year growth 2025-2030 (%)
Data Table on Middle East and Africa - Year-over-year growth 2025-2030 (%)
Chart on Regional Comparison - Middle East and Africa
Data Table on Regional Comparison - Middle East and Africa

12.7.1 Saudi Arabia - Market size and forecast 2025-2030

Chart on Saudi Arabia - Market size and forecast 2025-2030 ($ million)
Data Table on Saudi Arabia - Market size and forecast 2025-2030 ($ million)
Chart on Saudi Arabia - Year-over-year growth 2025-2030 (%)
Data Table on Saudi Arabia - Year-over-year growth 2025-2030 (%)

12.7.2 South Africa - Market size and forecast 2025-2030

Chart on South Africa - Market size and forecast 2025-2030 ($ million)
Data Table on South Africa - Market size and forecast 2025-2030 ($ million)
Chart on South Africa - Year-over-year growth 2025-2030 (%)
Data Table on South Africa - Year-over-year growth 2025-2030 (%)

12.7.3 UAE - Market size and forecast 2025-2030

Chart on UAE - Market size and forecast 2025-2030 ($ million)
Data Table on UAE - Market size and forecast 2025-2030 ($ million)
Chart on UAE - Year-over-year growth 2025-2030 (%)
Data Table on UAE - Year-over-year growth 2025-2030 (%)

12.7.4 Turkey - Market size and forecast 2025-2030

Chart on Turkey - Market size and forecast 2025-2030 ($ million)
Data Table on Turkey - Market size and forecast 2025-2030 ($ million)
Chart on Turkey - Year-over-year growth 2025-2030 (%)
Data Table on Turkey - Year-over-year growth 2025-2030 (%)

12.7.5 Israel - Market size and forecast 2025-2030

Chart on Israel - Market size and forecast 2025-2030 ($ million)
Data Table on Israel - Market size and forecast 2025-2030 ($ million)
Chart on Israel - Year-over-year growth 2025-2030 (%)
Data Table on Israel - Year-over-year growth 2025-2030 (%)

12.8 Market opportunity by geography

Market opportunity by geography ($ million)
Data Tables on Market opportunity by geography ($ million)

13. Drivers, Challenges, and Opportunity

13.1 Market drivers

Heightened consumer emphasis on health, wellness, and plant-based nutrition
Growing demand for convenient and portable food solutions
Strategic product innovation and portfolio diversification

13.2 Market challenges

Pervasiveness of peanut allergies and associated regulatory scrutiny
Volatility in raw material pricing and supply chain instability
Intense market competition and threat of product commoditization

13.3 Impact of drivers and challenges

Impact of drivers and challenges in 2025 and 2030

13.4 Market opportunities

Ascent of clean label and minimally processed formulations
Proliferation of gourmet flavors and functional ingredients
Growing influence and integration of alternative nut and seed butters

14. Competitive Landscape

14.1 Overview

14.2

Overview on criticality of inputs and factors of differentiation

14.3 Landscape disruption

Overview on factors of disruption

14.4 Industry risks

Impact of key risks on business

15. Competitive Analysis

15.1 Companies profiled

Companies covered

15.2 Company ranking index

15.3 Market positioning of companies

Matrix on companies position and classification

15.4 Algood Food Co.

Algood Food Co. - Overview
Algood Food Co. - Product / Service
Algood Food Co. - Key offerings
SWOT

15.5 China Kunyu Industrial

China Kunyu Industrial - Overview
China Kunyu Industrial - Product / Service
China Kunyu Industrial - Key offerings
SWOT

15.6 Hormel Foods Corp.

Hormel Foods Corp. - Overview
Hormel Foods Corp. - Business segments
Hormel Foods Corp. - Key offerings
Hormel Foods Corp. - Segment focus
SWOT

15.7 Nuflower

Nuflower - Overview
Nuflower - Product / Service
Nuflower - Key offerings
SWOT

15.8 Nuts N More

Nuts N More - Overview
Nuts N More - Product / Service
Nuts N More - Key offerings
SWOT

15.9 NuttZo LLC

NuttZo LLC - Overview
NuttZo LLC - Product / Service
NuttZo LLC - Key offerings
SWOT

15.10 Oetker Group

Oetker Group - Overview
Oetker Group - Product / Service
Oetker Group - Key offerings
SWOT

15.11 Post Holdings Inc.

Post Holdings Inc. - Overview
Post Holdings Inc. - Business segments
Post Holdings Inc. - Key offerings
Post Holdings Inc. - Segment focus
SWOT

15.12 Sonya Foods Pvt. Ltd.

Sonya Foods Pvt. Ltd. - Overview
Sonya Foods Pvt. Ltd. - Product / Service
Sonya Foods Pvt. Ltd. - Key offerings
SWOT

15.13 Swartberg B.V.

Swartberg B.V. - Overview
Swartberg B.V. - Product / Service
Swartberg B.V. - Key offerings
SWOT

15.14 The Hain Celestial Group

The Hain Celestial Group - Overview
The Hain Celestial Group - Business segments
The Hain Celestial Group - Key offerings
The Hain Celestial Group - Segment focus
SWOT

15.15 The J.M. Smucker Co.

The J.M. Smucker Co. - Overview
The J.M. Smucker Co. - Business segments
The J.M. Smucker Co. - Key news
The J.M. Smucker Co. - Key offerings
The J.M. Smucker Co. - Segment focus
SWOT

15.16 The Kraft Heinz Co.

The Kraft Heinz Co. - Overview
The Kraft Heinz Co. - Business segments
The Kraft Heinz Co. - Key news
The Kraft Heinz Co. - Key offerings
The Kraft Heinz Co. - Segment focus
SWOT

15.17 The Kroger Co.

The Kroger Co. - Overview
The Kroger Co. - Product / Service
The Kroger Co. - Key offerings
SWOT

15.18 Unilever PLC

Unilever PLC - Overview
Unilever PLC - Business segments
Unilever PLC - Key news
Unilever PLC - Key offerings
Unilever PLC - Segment focus
SWOT

16. Appendix

16.1 Scope of the report

Market definition
Objectives
Notes and caveats

16.2 Inclusions and exclusions checklist

Inclusions checklist
Exclusions checklist

16.3 Currency conversion rates for US$

16.4 Research methodology

16.5 Data procurement

Information sources

16.6 Data validation

16.7 Validation techniques employed for market sizing

16.8 Data synthesis

16.9 360 degree market analysis

16.10 List of abbreviations

Research Methodology

Technavio presents a detailed picture of the market by way of study, synthesis, and summation of data from multiple sources. The analysts have presented the various facets of the market with a particular focus on identifying the key industry influencers. The data thus presented is comprehensive, reliable, and the result of extensive research, both primary and secondary.

INFORMATION SOURCES

Primary sources

  • Manufacturers and suppliers
  • Channel partners
  • Industry experts
  • Strategic decision makers

Secondary sources

  • Industry journals and periodicals
  • Government data
  • Financial reports of key industry players
  • Historical data
  • Press releases

DATA ANALYSIS

Data Synthesis

  • Collation of data
  • Estimation of key figures
  • Analysis of derived insights

Data Validation

  • Triangulation with data models
  • Reference against proprietary databases
  • Corroboration with industry experts

REPORT WRITING

Qualitative

  • Market drivers
  • Market challenges
  • Market trends
  • Five forces analysis

Quantitative

  • Market size and forecast
  • Market segmentation
  • Geographical insights
  • Competitive landscape

Interested in this report?

Get your sample now to see our research methodology and insights!

Download Now

Frequently Asked Questions

Peanut Butter market growth will increase by USD 1545.5 million during 2026-2030.

The Peanut Butter market is expected to grow at a CAGR of 6.3% during 2026-2030.

Peanut Butter market is segmented by Distribution channel (Offline, Online) Type (Crunchy, Creamy, Others) Product type (Plain, Flavored)

Algood Food Co., China Kunyu Industrial, Galdisa USA Inc., Hormel Foods Corp., ManiLife, Nuflower, Nuts N More, NuttZo LLC, Oetker Group, Peanut Butter and Co., Pip and Nut Ltd., Post Holdings Inc., Sonya Foods Pvt. Ltd., Swartberg B.V., Teddie Natural Peanut Butter, The Hain Celestial Group, The J.M. Smucker Co., The Kraft Heinz Co., The Kroger Co., Unilever PLC are a few of the key vendors in the Peanut Butter market.

North America will register the highest growth rate of 55.7% among the other regions. Therefore, the Peanut Butter market in North America is expected to garner significant business opportunities for the vendors during the forecast period.

US, Canada, Mexico, Brazil, Argentina, Chile, Germany, UK, The Netherlands, France, Italy, Spain, China, India, Japan, Australia, South Korea, Indonesia, Saudi Arabia, South Africa, UAE, Turkey, Israel

  • Heightened consumer emphasis on health, wellness, and plant-based nutrition is the driving factor this market.

The Peanut Butter market vendors should focus on grabbing business opportunities from the Distribution channel segment as it accounted for the largest market share in the base year.
RIA - Research AI Assistant
Ask RIA