
Enterprise Manufacturing Intelligence Market Size 2025-2029
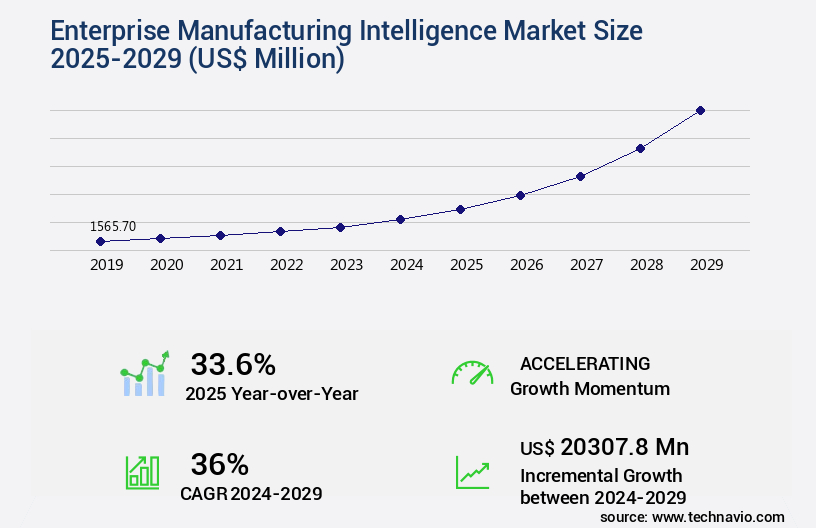
The enterprise manufacturing intelligence market size is valued to increase by USD 20.31 billion, at a CAGR of 36% from 2024 to 2029. Widespread adoption of industry 4.0 and digital transformation will drive the enterprise manufacturing intelligence market.
Major Market Trends & Insights
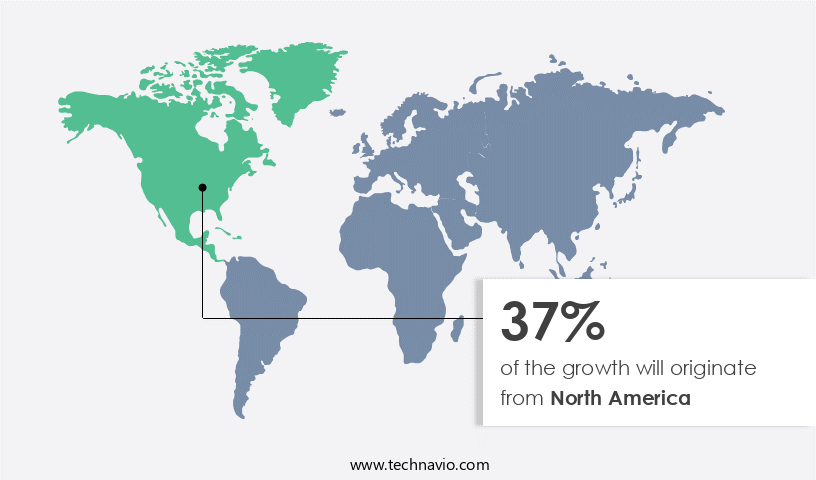
- North America dominated the market and accounted for a 37% growth during the forecast period.
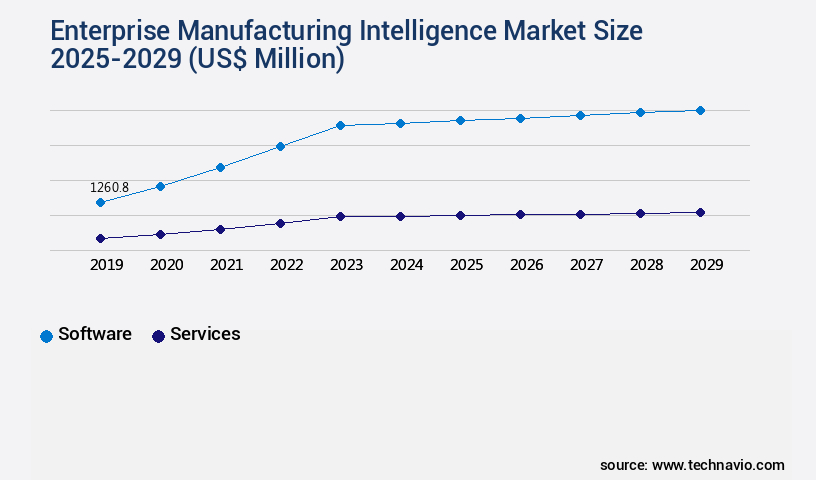
- By Component - Software segment was valued at USD 1.26 billion in 2023
- By Deployment - On-premises segment accounted for the largest market revenue share in 2023
Market Size & Forecast
- Market Opportunities: USD 1.00 million
- Market Future Opportunities: USD 20307.80 million
- CAGR from 2024 to 2029 : 36%
Market Summary
- The market has experienced significant growth in recent years, fueled by the widespread adoption of Industry 4.0 and digital transformation. Companies are increasingly leveraging advanced technologies, such as Artificial Intelligence (AI) and Machine Learning (ML), to gain predictive and prescriptive insights from their manufacturing data. These insights enable manufacturers to optimize production processes, reduce downtime, and improve overall efficiency. However, the integration of data from various sources and the complexity of legacy systems pose challenges. Manufacturers must ensure interoperability and data security while implementing these advanced technologies. According to a recent study, the global manufacturing intelligence market is projected to reach USD52.6 billion by 2026, growing at a steady pace.
- This growth underscores the importance of manufacturing intelligence in the modern industrial landscape. Manufacturers must navigate this evolving landscape with a strategic approach. They must invest in technologies that can handle the complexity of data integration and provide actionable insights. By doing so, they can remain competitive and adapt to the changing demands of the market. The future of manufacturing intelligence lies in its ability to provide real-time, data-driven insights that can inform strategic decision-making and drive operational excellence.
What will be the Size of the Enterprise Manufacturing Intelligence Market during the forecast period?
Get Key Insights on Market Forecast (PDF) Request Free Sample
How is the Enterprise Manufacturing Intelligence Market Segmented ?
The enterprise manufacturing intelligence industry research report provides comprehensive data (region-wise segment analysis), with forecasts and estimates in "USD million" for the period 2025-2029, as well as historical data from 2019-2023 for the following segments.
- Component
- Software
- Services
- Deployment
- On-premises
- Cloud
- Application
- Analytics
- Workflow and KPI management
- Data integration
- Visualization and dashboards
- End-user
- Automotive
- Pharmaceuticals
- Chemicals
- Electronics
- Others
- Geography
- North America
- US
- Canada
- Mexico
- Europe
- France
- Germany
- UK
- APAC
- China
- India
- Japan
- South Korea
- Rest of World (ROW)
- North America
By Component Insights
The software segment is estimated to witness significant growth during the forecast period.
The Enterprise Manufacturing Intelligence (EMI) market is characterized by its dynamic and innovative landscape, with companies continually pushing the boundaries of workflow automation software, data analytics platforms, and performance monitoring systems. These solutions go beyond traditional enterprise resource planning (ERP) systems, integrating digital twin technology, business intelligence tools, IoT sensor integration, inventory management systems, capacity planning tools, manufacturing process optimization, production line efficiency, and lean manufacturing principles. The market's evolution is marked by advanced technologies such as predictive analytics engines, data visualization dashboards, manufacturing execution systems, advanced process control, smart factory technologies, machine learning algorithms, supply chain visibility, operational intelligence, quality control metrics, statistical process control, automated anomaly detection, overall equipment effectiveness, cloud-based manufacturing, predictive maintenance models, six sigma methodologies, and production scheduling software.
A notable trend is the integration of industrial artificial intelligence and machine learning, which enables real-time data integration, production cost reduction, and demand forecasting models. According to a recent report, the global EMI market is projected to grow at a compound annual growth rate of 12.5% between 2021 and 2028.
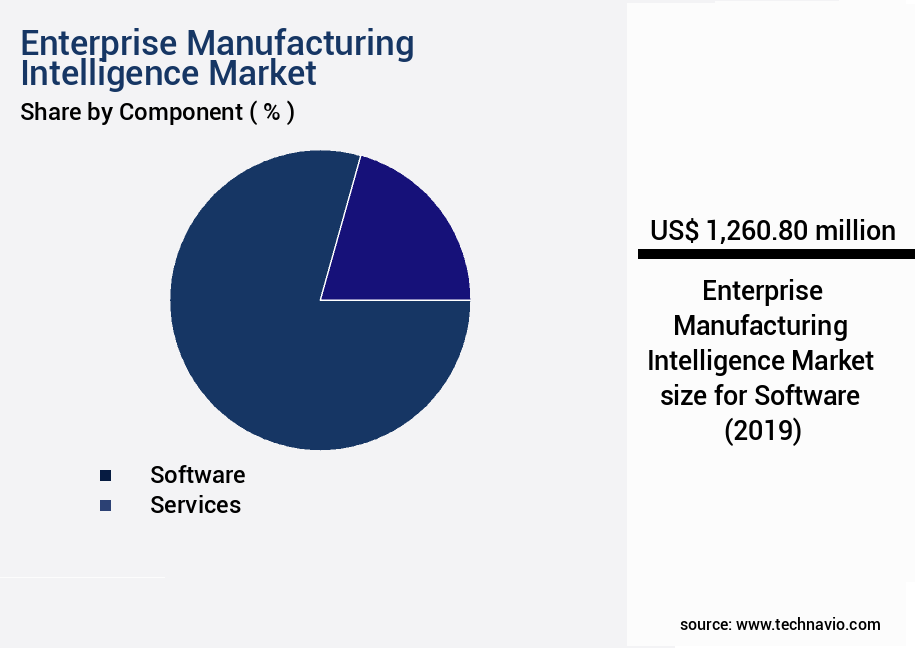
The Software segment was valued at USD 1.26 billion in 2019 and showed a gradual increase during the forecast period.
Regional Analysis
North America is estimated to contribute 37% to the growth of the global market during the forecast period.Technavio's analysts have elaborately explained the regional trends and drivers that shape the market during the forecast period.
See How Enterprise Manufacturing Intelligence Market Demand is Rising in North America Request Free Sample
The market exhibits a dynamic and evolving nature, with significant growth observed in various regions and applications. According to recent studies, the North American market holds a substantial market share, accounting for approximately 38% of the global revenue in 2024. This dominance can be attributed to the region's early adoption of smart factory initiatives and the confluence of factors such as federal incentives, private sector investment, and the integration of advanced technologies like artificial intelligence, 5G, and cyber-physical systems. The market landscape is characterized by a diverse mix of established automation leaders, including Rockwell Automation, Siemens, ABB, and Schneider Electric, as well as cloud hyperscalers and artificial intelligence native newcomers.
The European market is also experiencing growth, driven by the increasing demand for real-time data analysis and predictive maintenance in discrete and process manufacturing industries. Overall, the market is poised for continued expansion, driven by the increasing need for operational efficiency, quality improvement, and cost reduction in manufacturing processes.
Market Dynamics
Our researchers analyzed the data with 2024 as the base year, along with the key drivers, trends, and challenges. A holistic analysis of drivers will help companies refine their marketing strategies to gain a competitive advantage.
The market is experiencing significant growth as businesses seek to implement real-time data analytics in their manufacturing processes. This trend is driving the adoption of predictive maintenance using machine learning models, which optimize production line efficiency using AI and improve supply chain visibility through IoT sensors. Advanced process control techniques, such as statistical process control charts interpretation and lean manufacturing principles implementation, are also gaining popularity. Digital twin technology for production simulation and cloud-based manufacturing platform deployment are revolutionizing the industry, enabling manufacturers to optimize capacity planning and demand forecasting using advanced analytics. Production cost reduction strategies are a key focus area, with overall equipment effectiveness improvement and root cause analysis using data analytics playing crucial roles. Data visualization dashboards design, automated anomaly detection systems, production scheduling software optimization, and quality control metrics dashboards are essential tools for manufacturers looking to streamline their operations and enhance productivity. Inventory management software implementation and enterprise resource planning systems ensure seamless integration of various manufacturing functions, leading to improved operational efficiency and competitiveness in the global market.
What are the key market drivers leading to the rise in the adoption of Enterprise Manufacturing Intelligence Industry?
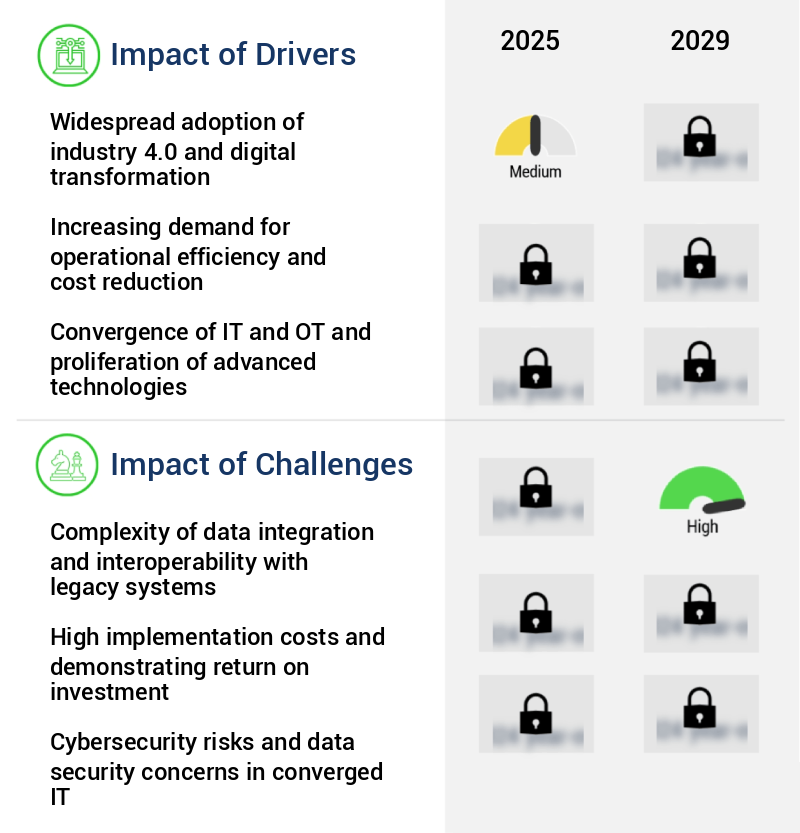
- The integration of Industry 4.0 and digital transformation is a mandatory and significant driver for market growth, as widespread adoption of these technologies fosters increased efficiency, productivity, and innovation within industries.
- The market is experiencing significant growth as a result of the increasing adoption of Industry 4.0 and digital transformation initiatives. This fourth industrial revolution is fundamentally changing manufacturing by creating highly connected, data-rich, and automated production environments, often referred to as smart factories. Enterprise manufacturing intelligence plays a crucial role in this new paradigm, acting as the analytical and decision-making layer that processes the vast amount of data generated by operational technology to deliver valuable insights. Manufacturers are recognizing digital transformation as a strategic necessity for survival and growth, rather than a discretionary investment.
- According to recent studies, the manufacturing sector accounts for over 25% of global industrial data generation, and over 75% of manufacturing enterprises are expected to adopt manufacturing intelligence solutions by 2025.
What are the market trends shaping the Enterprise Manufacturing Intelligence Industry?
- The use of artificial intelligence (AI) and machine learning (ML) for predictive and prescriptive analytics is an emerging market trend. This technological advancement is mandatory for businesses seeking to enhance their analytical capabilities.
- The market is undergoing a significant transformation, marked by the increasing integration of artificial intelligence (AI) and machine learning (ML) technologies. This shift moves EMI platforms beyond historical reporting and descriptive analytics to encompass predictive and prescriptive capabilities. Manufacturers are harnessing these advanced functionalities to optimize operations, enhance autonomy, and anticipate future trends. A prime example of this trend's impact is predictive maintenance. By analyzing real-time sensor data from critical machinery, ML algorithms can identify subtle patterns and anomalies indicative of impending equipment failure.
- This proactive approach to maintenance has been shown to reduce downtime and maintenance costs by up to 15%, underscoring the transformative potential of AI and ML in the manufacturing sector.
What challenges does the Enterprise Manufacturing Intelligence Industry face during its growth?
- The integration complexity and interoperability issues with legacy systems represent a significant challenge that hinders industry growth. This challenge arises from the need to seamlessly combine data from various sources while ensuring compatibility with outdated systems. Professionals in this field must address these intricacies to foster growth and efficiency in the industry.
- Enterprise Manufacturing Intelligence (EMI) solutions have gained significant traction in various sectors due to their potential to streamline operations and enhance productivity. The complexity of implementing these systems, however, remains a formidable challenge. Many manufacturing facilities, particularly those with extensive operational histories, house a diverse and fragmented landscape of machinery and control systems from multiple companies. These legacy systems typically operate on proprietary communication protocols and data formats, resulting in data silos that are challenging to penetrate. The primary value proposition of an EMI platform lies in its capacity to consolidate data from these disparate sources, creating a cohesive, unified data ecosystem.
- According to recent estimates, the global manufacturing intelligence market is projected to reach a value of around 30 billion USD by 2025, growing at a substantial rate. Another study suggests that approximately 70% of manufacturing enterprises have already adopted or are planning to adopt manufacturing intelligence solutions. These figures underscore the market's evolving nature and the increasing recognition of the benefits these solutions can bring to the manufacturing sector.
Exclusive Technavio Analysis on Customer Landscape
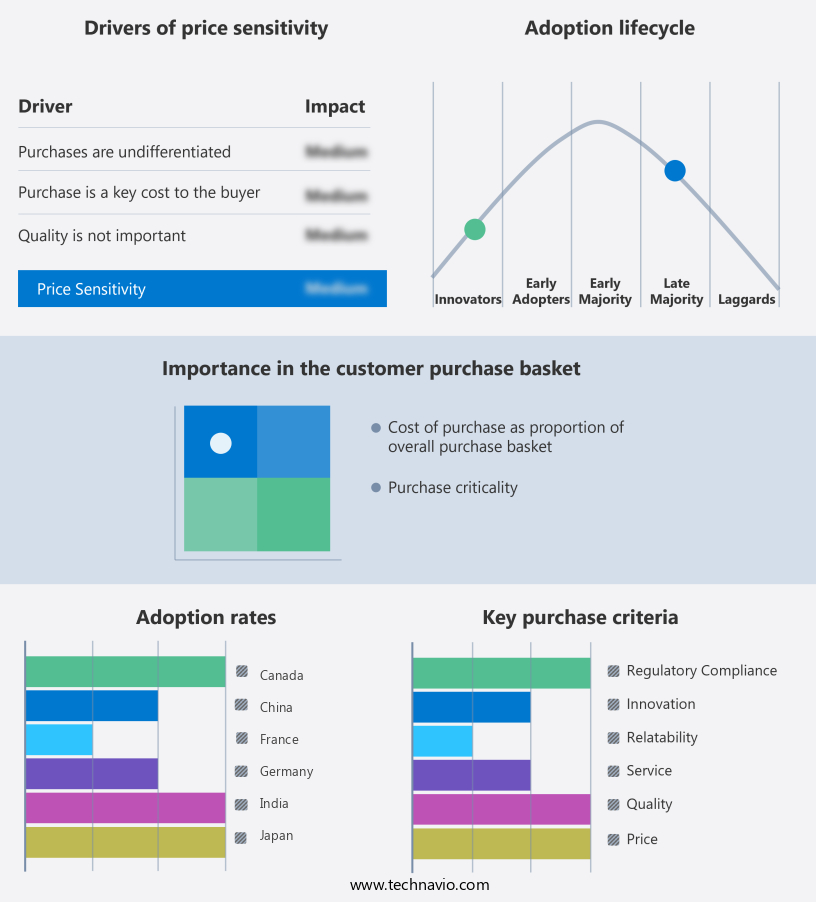
The enterprise manufacturing intelligence market forecasting report includes the adoption lifecycle of the market, covering from the innovator's stage to the laggard's stage. It focuses on adoption rates in different regions based on penetration. Furthermore, the enterprise manufacturing intelligence market report also includes key purchase criteria and drivers of price sensitivity to help companies evaluate and develop their market growth analysis strategies.
Customer Landscape of Enterprise Manufacturing Intelligence Industry
Competitive Landscape
Companies are implementing various strategies, such as strategic alliances, enterprise manufacturing intelligence market forecast, partnerships, mergers and acquisitions, geographical expansion, and product/service launches, to enhance their presence in the industry.
ABB Ltd. - The company specializes in manufacturing intelligence solutions, including ABB Ability Manufacturing Operations Management. This technology empowers businesses with AI-driven analytics for optimal asset performance. By leveraging advanced data analysis, organizations can enhance their manufacturing processes and improve overall efficiency.
The industry research and growth report includes detailed analyses of the competitive landscape of the market and information about key companies, including:
- ABB Ltd.
- Aspen Technology Inc.
- AVEVA Group Plc
- Dassault Systemes SE
- Emerson Electric Co.
- Epicor Software Corp.
- General Electric Co.
- Hexagon AB
- Honeywell International Inc.
- ICONICS Inc.
- International Business Machines Corp.
- Oracle Corp.
- Plex Systems Inc.
- PTC Inc.
- Rockwell Automation Inc.
- SAP SE
- Schneider Electric SE
- Siemens AG
- Yokogawa Electric Corp.
Qualitative and quantitative analysis of companies has been conducted to help clients understand the wider business environment as well as the strengths and weaknesses of key industry players. Data is qualitatively analyzed to categorize companies as pure play, category-focused, industry-focused, and diversified; it is quantitatively analyzed to categorize companies as dominant, leading, strong, tentative, and weak.
Recent Development and News in Enterprise Manufacturing Intelligence Market
- In January 2024, Siemens Digital Industries Software announced the launch of its new Manufacturing Intelligence solution, MindSphere Edition for Manufacturing, aimed at helping manufacturers optimize their production processes by integrating data from various sources and providing real-time insights (Siemens Digital Industries Software Press Release).
- In March 2024, IBM and SAP signed a strategic partnership to integrate IBM's Watson AI capabilities into SAP's Enterprise Manufacturing Intelligence solutions, enhancing predictive maintenance and quality management capabilities (IBM Press Release).
- In May 2024, PTC and Schneider Electric entered into a collaboration to integrate PTC's ThingWorx manufacturing intelligence platform with Schneider Electric's EcoStruxure architecture, enabling real-time monitoring and optimization of manufacturing operations (PTC Press Release).
- In April 2025, GE Digital announced a significant investment of USD200 million in its Predix Platform for Manufacturing, aiming to expand its footprint in the market and enhance its offerings for predictive maintenance and production optimization (GE Digital Press Release).
Dive into Technavio's robust research methodology, blending expert interviews, extensive data synthesis, and validated models for unparalleled Enterprise Manufacturing Intelligence Market insights. See full methodology.
|
Market Scope |
|
|
Report Coverage |
Details |
|
Page number |
261 |
|
Base year |
2024 |
|
Historic period |
2019-2023 |
|
Forecast period |
2025-2029 |
|
Growth momentum & CAGR |
Accelerate at a CAGR of 36% |
|
Market growth 2025-2029 |
USD 20307.8 million |
|
Market structure |
Fragmented |
|
YoY growth 2024-2025(%) |
33.6 |
|
Key countries |
US, Germany, UK, China, France, Canada, South Korea, Japan, Mexico, and India |
|
Competitive landscape |
Leading Companies, Market Positioning of Companies, Competitive Strategies, and Industry Risks |
Research Analyst Overview
- The market continues to evolve, driven by the increasing adoption of advanced technologies and the need for improved operational efficiency. Workflow automation software and data analytics platforms are becoming essential tools for manufacturers, enabling real-time performance monitoring and data integration. Enterprise resource planning (ERP) systems are being augmented with digital twin technology, business intelligence tools, and IoT sensor integration to provide more accurate capacity planning and manufacturing process optimization. For instance, a leading automotive manufacturer reported a 15% increase in production line efficiency by implementing advanced process control and predictive analytics engine. The global manufacturing intelligence market is expected to grow by over 10% annually, fueled by the demand for lean manufacturing principles, demand forecasting models, and supply chain visibility.
- Manufacturing execution systems, machine learning algorithms, and smart factory technologies are also gaining traction, enabling overall equipment effectiveness and predictive maintenance models. Operational intelligence, quality control metrics, and statistical process control are crucial components of this evolving landscape, with automated anomaly detection and cloud-based manufacturing playing a significant role in enhancing production cost reduction. Six sigma methodologies and production scheduling software are further enhancing the industry's ability to optimize operations, ensuring that manufacturers remain competitive in today's dynamic market.
What are the Key Data Covered in this Enterprise Manufacturing Intelligence Market Research and Growth Report?
-
What is the expected growth of the Enterprise Manufacturing Intelligence Market between 2025 and 2029?
-
USD 20.31 billion, at a CAGR of 36%
-
-
What segmentation does the market report cover?
-
The report is segmented by Component (Software and Services), Deployment (On-premises and Cloud), Application (Analytics, Workflow and KPI management, Data integration, and Visualization and dashboards), End-user (Automotive, Pharmaceuticals, Chemicals, Electronics, and Others), and Geography (North America, Europe, APAC, South America, and Middle East and Africa)
-
-
Which regions are analyzed in the report?
-
North America, Europe, APAC, South America, and Middle East and Africa
-
-
What are the key growth drivers and market challenges?
-
Widespread adoption of industry 4.0 and digital transformation, Complexity of data integration and interoperability with legacy systems
-
-
Who are the major players in the Enterprise Manufacturing Intelligence Market?
-
ABB Ltd., Aspen Technology Inc., AVEVA Group Plc, Dassault Systemes SE, Emerson Electric Co., Epicor Software Corp., General Electric Co., Hexagon AB, Honeywell International Inc., ICONICS Inc., International Business Machines Corp., Oracle Corp., Plex Systems Inc., PTC Inc., Rockwell Automation Inc., SAP SE, Schneider Electric SE, Siemens AG, and Yokogawa Electric Corp.
-
Market Research Insights
- The market is a dynamic and ever-evolving landscape, driven by the constant pursuit of optimization and improvement. Two key areas of focus are resource allocation optimization and data integration architecture. In terms of resource allocation, organizations have achieved significant outcomes by implementing data-driven strategies. For instance, one company reported a 15% increase in production throughput by utilizing real-time performance tracking and predictive maintenance strategies. Regarding data integration, the industry anticipates a 20% growth in the adoption of advanced analytics techniques and cloud security measures over the next five years.
- This trend is fueled by the need for enhanced customer satisfaction, reduced operational costs, and supply chain resilience. Other essential aspects of the market include data security protocols, process capability analysis, and risk management strategies. By integrating these elements, manufacturers can improve product quality, operational efficiency, and overall competitiveness.
We can help! Our analysts can customize this enterprise manufacturing intelligence market research report to meet your requirements.
 RIA -
RIA - 
