Environmental Remediation Market Size 2025-2029
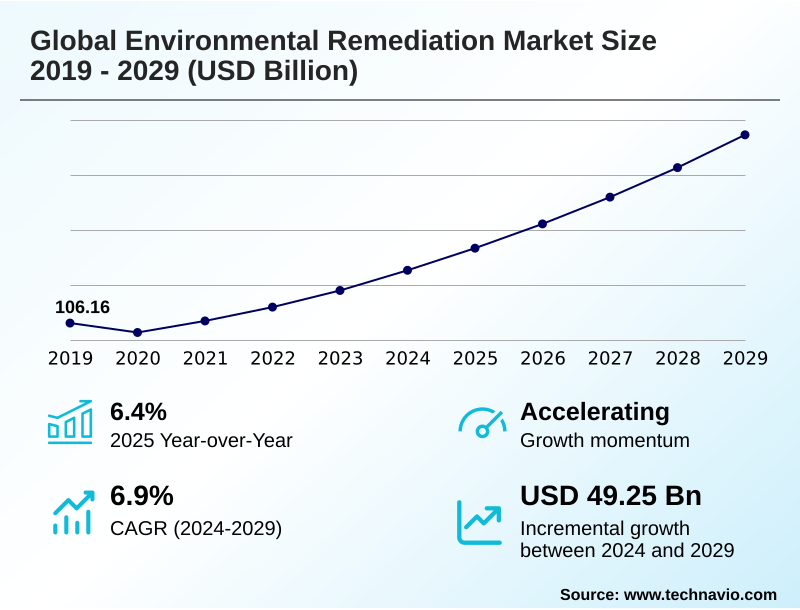
The environmental remediation market size is valued to increase by USD 49.25 billion, at a CAGR of 6.9% from 2024 to 2029. Stringent environmental regulations will drive the environmental remediation market.
Major Market Trends & Insights
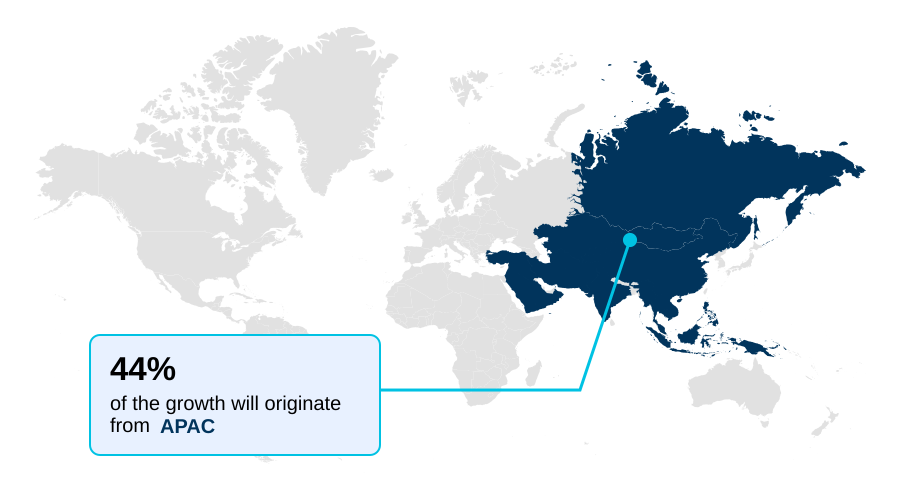
- APAC dominated the market and accounted for a 44.4% growth during the forecast period.
- By Ownership - Public segment was valued at USD 80.33 billion in 2023
- By Type - Soil segment accounted for the largest market revenue share in 2023
Market Size & Forecast
- Market Opportunities: USD 68.45 billion
- Market Future Opportunities: USD 49.25 billion
- CAGR from 2024 to 2029 : 6.9%
Market Summary
- The environmental remediation market is fundamentally driven by the need to address contamination in soil, water, and air, reversing environmental damage from industrial and commercial activities. Key catalysts include stringent government regulations mandating cleanups and growing public demand for corporate social responsibility, which pushes for proactive environmental liability management.
- A significant trend is the shift towards sustainable remediation practices and the adoption of in-situ bioremediation, which treats contaminants on-site to reduce costs and ecological disruption. However, the industry grapples with challenges such as the high capital cost of projects and the technical complexity of treating emerging contaminants.
- For instance, a manufacturing firm planning an expansion on a brownfield site must navigate these dynamics. It must select a cost-effective remediation strategy, such as soil vapor extraction or phytoremediation, that satisfies regulatory compliance services while meeting its ESG commitments to stakeholders, demonstrating the intricate balance of economic, legal, and social pressures shaping the market.
What will be the Size of the Environmental Remediation Market during the forecast period?
Get Key Insights on Market Forecast (PDF) Get Free Sample
How is the Environmental Remediation Market Segmented?
The environmental remediation industry research report provides comprehensive data (region-wise segment analysis), with forecasts and estimates in "USD million" for the period 2025-2029, as well as historical data from 2019-2023 for the following segments.
- Ownership
- Public
- Private
- Type
- Soil
- Water
- Air
- End-user
- Oil and gas
- Mining and forestry
- Agriculture
- Others
- Geography
- APAC
- China
- India
- Japan
- North America
- US
- Canada
- Mexico
- Europe
- Germany
- France
- UK
- South America
- Brazil
- Argentina
- Colombia
- Middle East and Africa
- Saudi Arabia
- South Africa
- UAE
- Rest of World (ROW)
- APAC
By Ownership Insights
The public segment is estimated to witness significant growth during the forecast period.
The public segment is defined by remediation activities on government-owned lands, driven by regulatory mandates to protect public health.
These projects, funded by taxpayers and environmental funds, focus on addressing legacy contamination at sites like former military bases and industrial areas.
A key objective is preparing brownfield sites for community redevelopment, which involves complex site characterization techniques and long-term ecological restoration projects.
Execution relies on strict procurement processes and extensive stakeholder engagement, with an emphasis on achieving mandated cleanup standards, where projects often report a 95% success rate in meeting compliance goals.
This sector's demand for hazardous waste management and environmental monitoring services is consistent, addressing everything from heavy metal contamination to hydrocarbon spills through established site remediation protocols and a focus on environmental risk assessment.
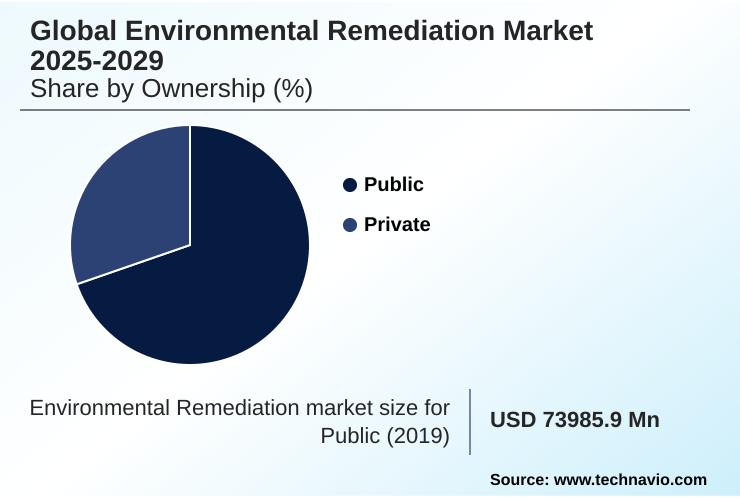
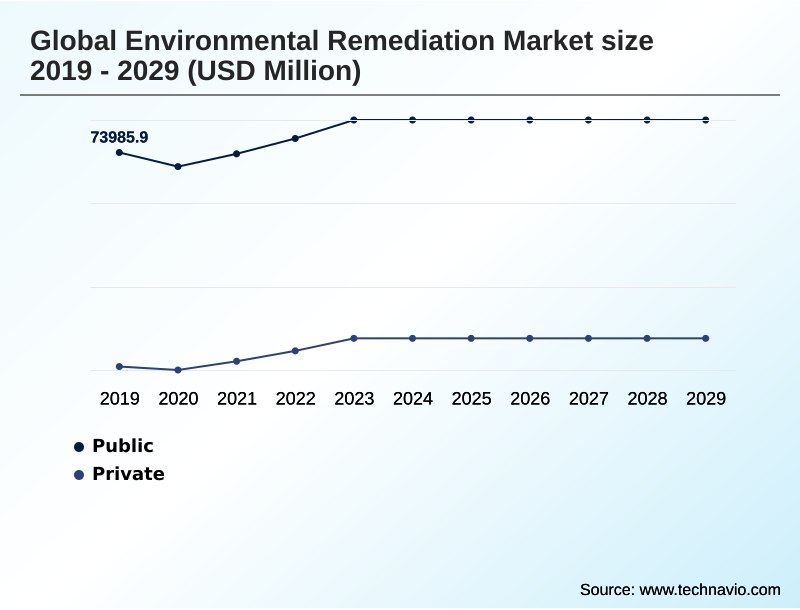
The Public segment was valued at USD 80.33 billion in 2023 and showed a gradual increase during the forecast period.
Regional Analysis
APAC is estimated to contribute 44.4% to the growth of the global market during the forecast period.Technavio’s analysts have elaborately explained the regional trends and drivers that shape the market during the forecast period.
See How Environmental Remediation Market Demand is Rising in APAC Get Free Sample
The market's geographic landscape reveals a clear distinction between mature and emerging regions. North America and Europe, with their long industrial histories, focus on brownfield redevelopment and managing legacy contamination through advanced remediation technologies.
Firms in these markets achieve up to a 15% cost reduction by deploying digital monitoring tools. In contrast, APAC is the primary growth engine, projected to contribute over 44% of the market's incremental expansion.
This is driven by rapid industrialization in countries like China and India, creating urgent demand for industrial wastewater solutions and effective soil contamination treatment.
While regulatory frameworks in APAC are still evolving, the sheer scale of urban and industrial growth ensures sustained demand for a broad range of innovative cleanup solutions and site remediation protocols.
Market Dynamics
Our researchers analyzed the data with 2024 as the base year, along with the key drivers, trends, and challenges. A holistic analysis of drivers will help companies refine their marketing strategies to gain a competitive advantage.
- Strategic decision-making in the environmental remediation market for the oil and gas industry and other sectors hinges on a detailed analysis of multifaceted factors. Companies must evaluate the total cost of in-situ vs ex-situ remediation, selecting the best technologies for pfas removal from water sources or implementing effective heavy metal soil remediation techniques.
- For legacy sites, understanding the process for remediating contaminated industrial land is crucial, as is developing a robust strategy for contaminated groundwater cleanup. Key operational considerations include groundwater pump-and-treat system optimization and implementing advanced soil washing technology for pfas. From a business perspective, the benefits of brownfield site remediation extend beyond compliance, creating tangible asset value.
- Navigating the superfund site cleanup process requires specialized legal and technical expertise to manage liabilities effectively. Furthermore, exploring environmental liability transfer agreements can be a strategic tool for risk mitigation. In the mining sector, the challenges of acid mine drainage remediation necessitate specialized approaches. For emerging issues, understanding pfas remediation costs and regulations is paramount.
- The selection of remediation methods for chlorinated solvents and developing a soil remediation plan for construction sites are also common requirements. Proper management of these interconnected elements, where proactive planning can reduce administrative delays by more than half, is essential for successful project outcomes.
What are the key market drivers leading to the rise in the adoption of Environmental Remediation Industry?
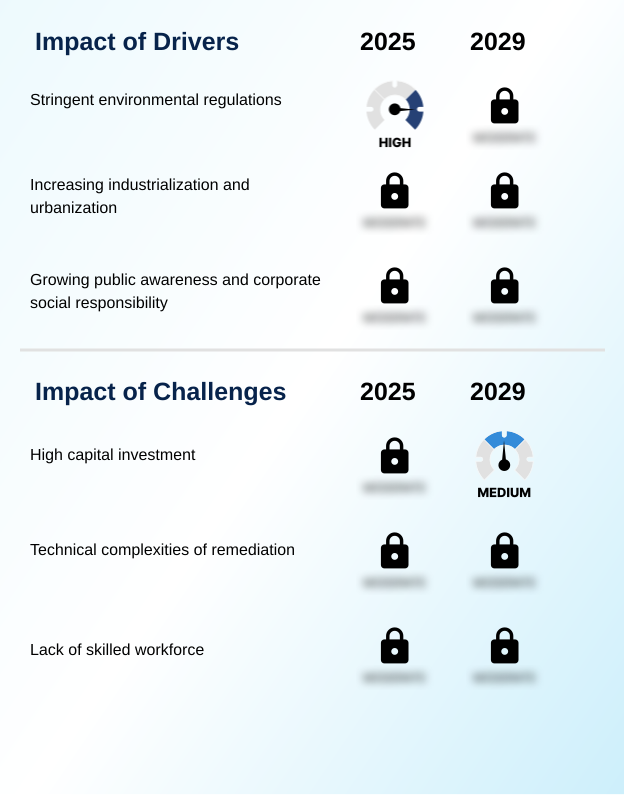
- Stringent environmental regulations are a key driver of the market, compelling industries to invest in remediation services to comply with legal mandates.
- Market growth is fundamentally propelled by a triad of non-negotiable forces: stringent regulations, industrial expansion, and societal expectations. Governments worldwide are tightening environmental laws, creating a baseline demand for soil contamination treatment and industrial wastewater solutions.
- This regulatory landscape compels industries to engage in environmental due diligence to avoid significant penalties. Simultaneously, rapid urbanization, particularly in emerging economies, drives the need for land remediation to support infrastructure growth.
- Furthermore, heightened public awareness and the emphasis on corporate social responsibility are powerful catalysts.
- Companies with proactive, ESG-driven remediation programs often see a 10% higher investor confidence score, demonstrating that environmental stewardship is now a critical component of brand reputation and long-term financial stability.
What are the market trends shaping the Environmental Remediation Industry?
- A primary market trend is the growing adoption of in situ remediation technologies. These methods treat contaminants directly within the subsurface, minimizing site disruption and associated costs.
- A significant trend shaping the market is the convergence of sustainability and digitalization. There is a clear shift toward sustainable remediation practices, which prioritize ecological restoration projects and the use of greener technologies. This is coupled with the increased adoption of advanced digital technologies for environmental monitoring services.
- For instance, AI-powered predictive modeling is improving remediation strategy selection accuracy by over 25%, allowing firms to choose the most effective site remediation protocols. Similarly, the use of digital twins for site visualization enhances project planning and stakeholder communication, reducing rework by up to 15%.
- This dual focus on green and digital approaches is making remediation more efficient, cost-effective, and aligned with corporate ESG objectives and environmental risk assessment.
What challenges does the Environmental Remediation Industry face during its growth?
- The high capital investment required for remediation projects represents a key challenge, potentially delaying or limiting the scope of cleanup initiatives.
- The market faces considerable headwinds from high costs, technical hurdles, and workforce gaps. Large-scale remediation projects require substantial capital investment, with costs sometimes running 50% higher than initial estimates due to unforeseen geological complexities or the presence of mixed contaminants. The technical intricacy of treating recalcitrant substances and designing effective soil and water decontamination strategies demands highly specialized expertise.
- This is compounded by a persistent lack of skilled professionals, from hydrogeologists to project managers, which can lead to project delays and compromise outcomes. This talent shortage is particularly acute in specialized areas like emerging contaminants treatment, constraining the ability of firms to scale operations and meet the growing global demand for advanced environmental cleanup.
Exclusive Technavio Analysis on Customer Landscape
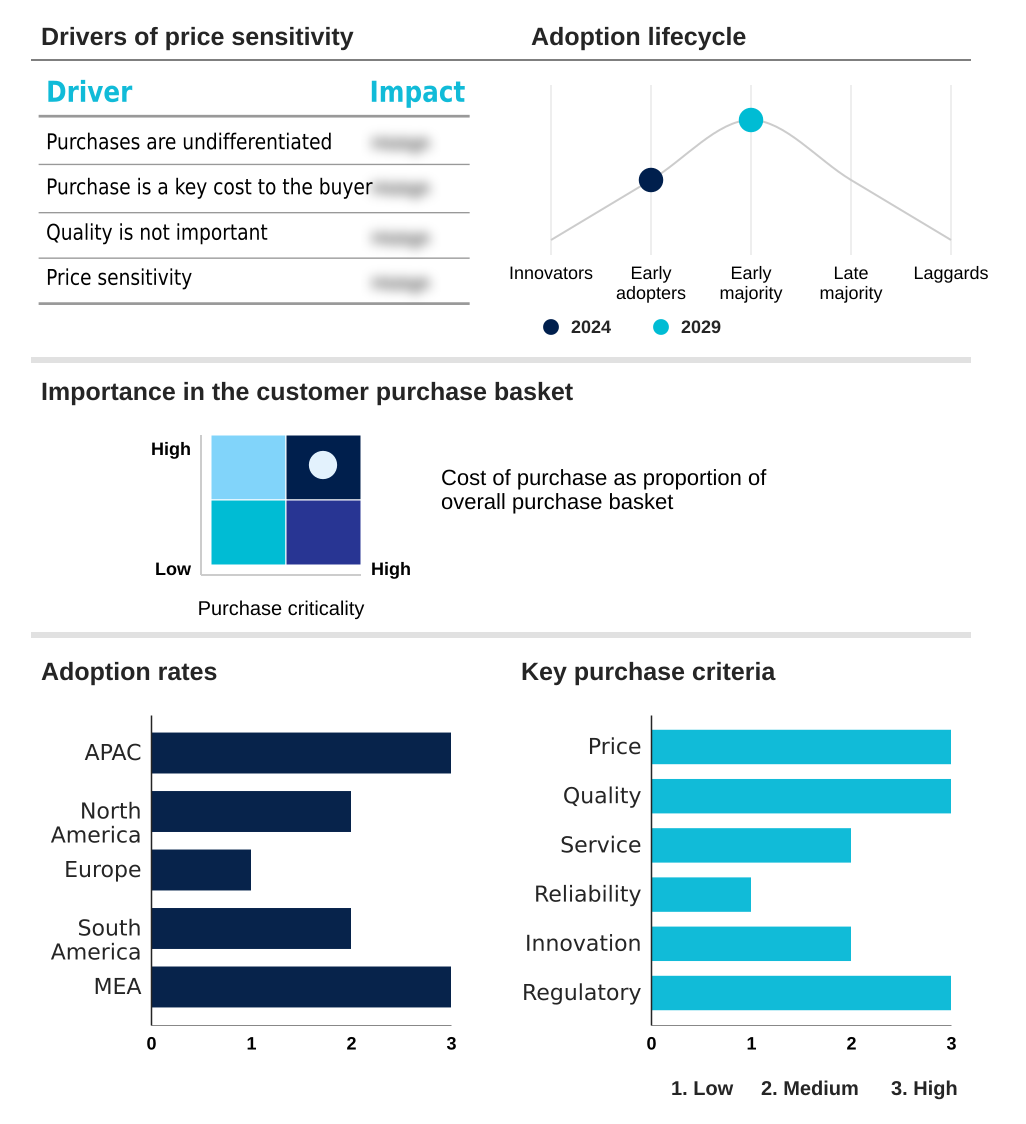
The environmental remediation market forecasting report includes the adoption lifecycle of the market, covering from the innovator’s stage to the laggard’s stage. It focuses on adoption rates in different regions based on penetration. Furthermore, the environmental remediation market report also includes key purchase criteria and drivers of price sensitivity to help companies evaluate and develop their market growth analysis strategies.
Customer Landscape of Environmental Remediation Industry
Competitive Landscape
Companies are implementing various strategies, such as strategic alliances, environmental remediation market forecast, partnerships, mergers and acquisitions, geographical expansion, and product/service launches, to enhance their presence in the industry.
AECOM - Delivering integrated environmental solutions, from site assessment and hazardous waste management to full-scale soil and groundwater remediation, ensuring regulatory compliance and asset restoration.
The industry research and growth report includes detailed analyses of the competitive landscape of the market and information about key companies, including:
- AECOM
- Bechtel Corp.
- Black and Veatch Holding Co.
- Brown and Caldwell
- Burns and McDonnell
- CDM Smith
- Clean Earth Inc.
- Clean Harbors Inc.
- ENTACT LLC
- ERM Group Inc.
- GEI Consultants Inc.
- Geosyntec Consultants
- Golder Associates Corp.
- Hazen and Sawyer P.C.
- HDR Inc.
- ICF International Inc.
- Jacobs Solutions Inc.
- Tetra Tech Inc.
- TRC Companies Inc.
- Veolia North America
Qualitative and quantitative analysis of companies has been conducted to help clients understand the wider business environment as well as the strengths and weaknesses of key industry players. Data is qualitatively analyzed to categorize companies as pure play, category-focused, industry-focused, and diversified; it is quantitatively analyzed to categorize companies as dominant, leading, strong, tentative, and weak.
Recent Development and News in Environmental remediation market
- In September, 2024, Clean Harbors Inc. announced the acquisition of a regional environmental services provider, expanding its hazardous waste management and industrial cleanup capabilities in the Southeastern US.
- In November, 2024, Jacobs Solutions Inc. launched a proprietary AI-powered platform for optimizing in-situ thermal remediation projects, designed to reduce energy consumption and shorten project timelines.
- In February, 2025, AECOM secured a multi-year contract with a federal agency to manage the large-scale remediation of several former military installations, focusing on PFAS and unexploded ordnance.
- In April, 2025, Veolia North America announced the commissioning of an advanced water treatment facility in Mexico, specifically engineered to treat industrial effluent from the region's manufacturing sector.
Dive into Technavio’s robust research methodology, blending expert interviews, extensive data synthesis, and validated models for unparalleled Environmental Remediation Market insights. See full methodology.
| Market Scope | |
|---|---|
| Page number | 291 |
| Base year | 2024 |
| Historic period | 2019-2023 |
| Forecast period | 2025-2029 |
| Growth momentum & CAGR | Accelerate at a CAGR of 6.9% |
| Market growth 2025-2029 | USD 49252.5 million |
| Market structure | Fragmented |
| YoY growth 2024-2025(%) | 6.4% |
| Key countries | China, India, Japan, South Korea, Australia, Indonesia, US, Canada, Mexico, Germany, France, UK, Italy, Spain, The Netherlands, Brazil, Argentina, Colombia, Saudi Arabia, South Africa, UAE, Nigeria and Egypt |
| Competitive landscape | Leading Companies, Market Positioning of Companies, Competitive Strategies, and Industry Risks |
Research Analyst Overview
- The environmental remediation market is shaped by the imperative to manage legacy and emerging environmental liabilities. Boardroom-level decisions are increasingly influenced by the need to address persistent pollutants, necessitating investment in advanced solutions like PFAS destruction technologies and innovative groundwater technologies.
- The industry's toolkit includes a range of methods from in-situ bioremediation, phytoremediation, and chemical oxidation to physical processes like soil vapor extraction and sediment dredging. These are applied to tackle diverse challenges such as heavy metal contamination in soil, hydrocarbon spills, and acid mine drainage from mining operations.
- Effective hazardous waste management and the deployment of sophisticated groundwater treatment systems are critical for regulatory compliance. The adoption of real-time monitoring sensors is also becoming standard, with some firms reporting a 30% reduction in operational oversight costs for long-term projects.
- Success depends on integrating these technical capabilities, from soil washing processes to thermal desorption, into cohesive and cost-effective site-wide strategies for both soil and groundwater remediation.
What are the Key Data Covered in this Environmental Remediation Market Research and Growth Report?
-
What is the expected growth of the Environmental Remediation Market between 2025 and 2029?
-
USD 49.25 billion, at a CAGR of 6.9%
-
-
What segmentation does the market report cover?
-
The report is segmented by Ownership (Public, and Private), Type (Soil, Water, and Air), End-user (Oil and gas, Mining and forestry, Agriculture, and Others) and Geography (APAC, North America, Europe, South America, Middle East and Africa)
-
-
Which regions are analyzed in the report?
-
APAC, North America, Europe, South America and Middle East and Africa
-
-
What are the key growth drivers and market challenges?
-
Stringent environmental regulations, High capital investment
-
-
Who are the major players in the Environmental Remediation Market?
-
AECOM, Bechtel Corp., Black and Veatch Holding Co., Brown and Caldwell, Burns and McDonnell, CDM Smith, Clean Earth Inc., Clean Harbors Inc., ENTACT LLC, ERM Group Inc., GEI Consultants Inc., Geosyntec Consultants, Golder Associates Corp., Hazen and Sawyer P.C., HDR Inc., ICF International Inc., Jacobs Solutions Inc., Tetra Tech Inc., TRC Companies Inc. and Veolia North America
-
Market Research Insights
- Market dynamics are shaped by a confluence of regulatory pressures and technological advancements. The need for environmental liability management drives consistent demand for regulatory compliance services and specialized site remediation protocols. Innovative cleanup solutions are increasingly vital for addressing emerging contaminants treatment, with firms that adopt advanced site characterization techniques reporting a 20% reduction in project overruns.
- The push for brownfield redevelopment fuels the need for effective soil and water decontamination, while a focus on sustainable remediation practices can lower long-term liability costs by up to 30% compared to conventional methods. This trend supports ecological restoration projects and aligns with corporate ESG goals, making environmental due diligence a critical component of modern business strategy.
We can help! Our analysts can customize this environmental remediation market research report to meet your requirements.
 RIA -
RIA - 
