Fertigation And Chemigation Market Analysis, Size, and Forecast 2026-2030: Europe (Germany, UK, and France), APAC (China, India, and Japan), North America (US, Canada, and Mexico), South America (Brazil and Argentina), Middle East and Africa (Saudi Arabia, South Africa, and UAE), and Rest of World (ROW)

Fertigation And Chemigation Market Analysis, Size, and Forecast 2026-2030:
Europe (Germany, UK, and France), APAC (China, India, and Japan), North America (US, Canada, and Mexico), South America (Brazil and Argentina), Middle East and Africa (Saudi Arabia, South Africa, and UAE), and Rest of World (ROW)

Published: Dec 2025 290 Pages SKU: IRTNTR74127

Market Overview at a Glance

$24.22 Mn
Market Opportunity
8.3%
CAGR 2025 - 2030
38%
Europe Growth
$28.01 Mn
Drip segment 2024

Fertigation And Chemigation Market Size 2026-2030

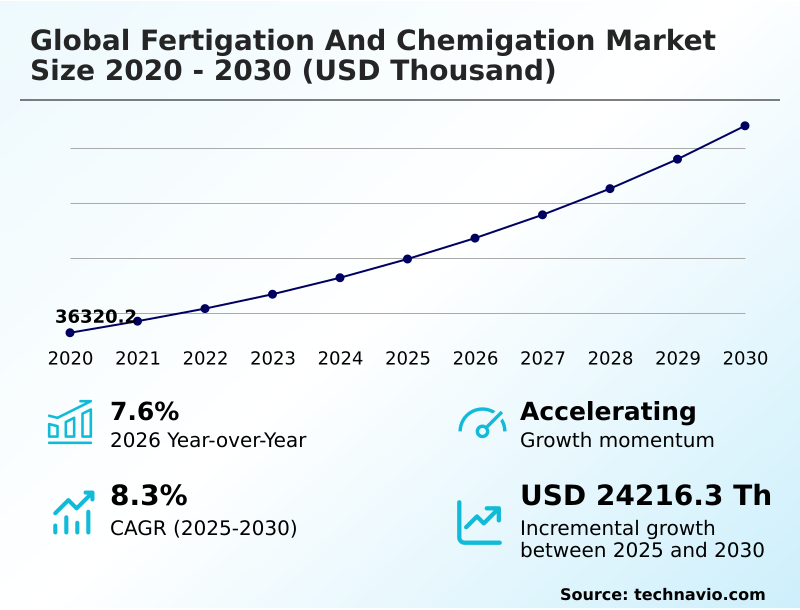
The fertigation and chemigation market size is valued to increase by USD 24.22 million, at a CAGR of 8.3% from 2025 to 2030. Water scarcity and efficient resource management will drive the fertigation and chemigation market.

Major Market Trends & Insights

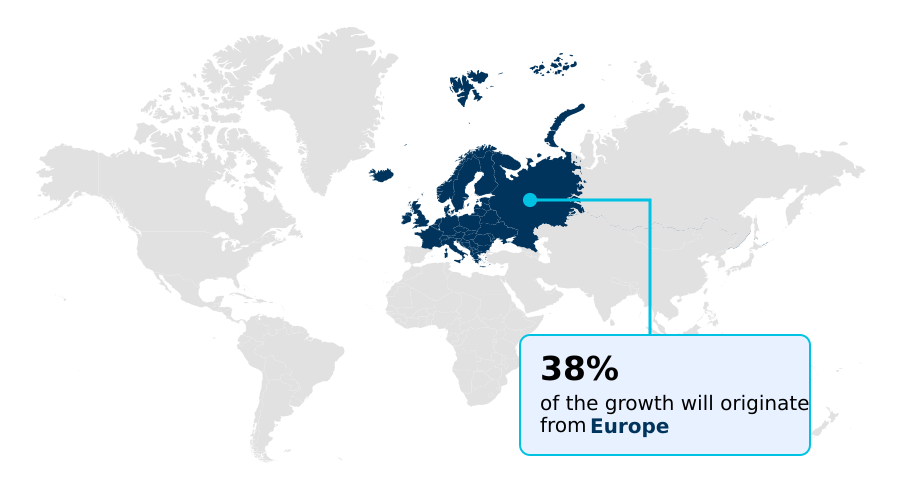
  • Europe dominated the market and accounted for a 38% growth during the forecast period.
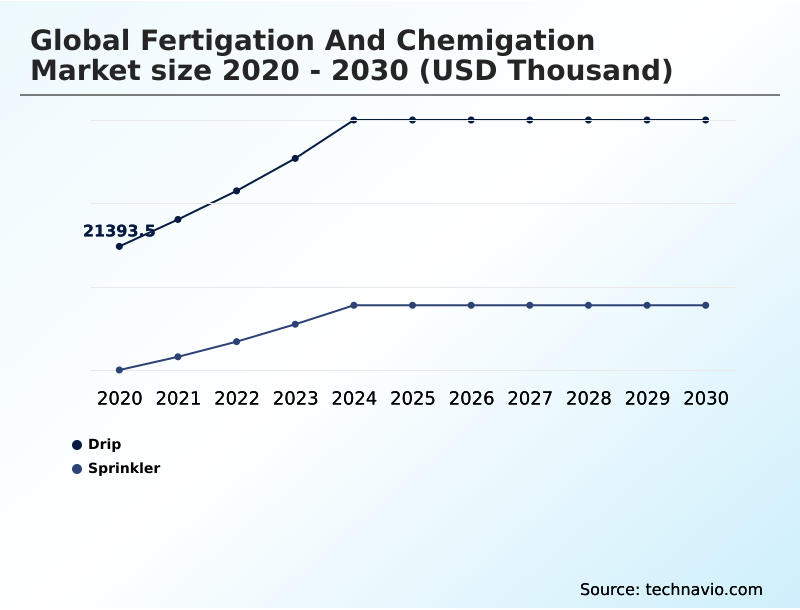
  • By Type - Drip segment was valued at USD 28.01 million in 2024
  • By Product Type - Fertilizers segment accounted for the largest market revenue share in 2024

Market Size & Forecast

  • Market Opportunities:
  • Market Future Opportunities: USD 24.22 million
  • CAGR from 2025 to 2030 : 8.3%

Market Summary

  • The fertigation and chemigation market is undergoing a significant transformation, driven by the agricultural sector's urgent need for enhanced productivity and sustainability. Key market dynamics are shaped by the dual pressures of global water scarcity and the necessity for higher crop yields to ensure food security.
  • In response, there is a strong trend toward adopting precision technologies, including IoT sensors and automated control systems, which enable real-time monitoring and data-driven adjustments to nutrient and water delivery. These systems support sustainable intensification by maximizing resource efficiency and minimizing environmental impact.
  • For instance, a large-scale commercial farm can implement an integrated drip fertigation system to achieve precise, variable-rate application of water-soluble fertilizers directly to the crop root zone. This approach not only conserves water but also improves nutrient use efficiency, leading to higher-quality yields and reduced operational costs.
  • However, technical challenges such as emitter clogging from mineral precipitates and biofilms require advanced filtration and maintenance protocols to ensure long-term system reliability and performance. The market's evolution is geared toward providing holistic solutions that combine innovative hardware with intelligent software for optimized, climate-resilient agriculture.

What will be the Size of the Fertigation And Chemigation Market during the forecast period?

Get Key Insights on Market Forecast (PDF) Request Free Sample

How is the Fertigation And Chemigation Market Segmented?

The fertigation and chemigation industry research report provides comprehensive data (region-wise segment analysis), with forecasts and estimates in "USD thousand" for the period 2026-2030, as well as historical data from 2020-2024 for the following segments.

  • Type
    • Drip
    • Sprinkler
  • Product type
    • Fertilizers
    • Insecticides
    • Fungicides
    • Herbicides
    • Others
  • Application
    • Agriculture irrigation
    • Landscape irrigation
    • Greenhouse irrigation
    • Others
  • Geography
    • Europe
      • Germany
      • UK
      • France
    • APAC
      • China
      • India
      • Japan
    • North America
      • US
      • Canada
      • Mexico
    • South America
      • Brazil
      • Argentina
    • Middle East and Africa
      • Saudi Arabia
      • South Africa
      • UAE
    • Rest of World (ROW)

By Type Insights

The drip segment is estimated to witness significant growth during the forecast period.

The drip segment is pivotal in the fertigation and chemigation market, defined by its high water use efficiency and precision nutrient management.

This method involves the direct root zone delivery of inputs through drip irrigation systems, minimizing waste from runoff and evaporation.

The integration of digital farming technologies with sprinkler irrigation systems enables automated fertigation scheduling and real-time adjustments, addressing the need for resource-efficient farming. Adoption is driven by the clear operational cost reduction and enhanced crop quality enhancement.

However, system longevity is impacted by factors like chemical precipitate management.

Advanced maintenance protocols, such as managed acid washing, have demonstrated a 24% improvement in mitigating clogs under optimal conditions, underscoring the importance of proactive system care and the use of intelligent irrigation controllers to sustain performance and protect investments in climate adaptation strategies and smart agriculture platforms.

Request Free Sample

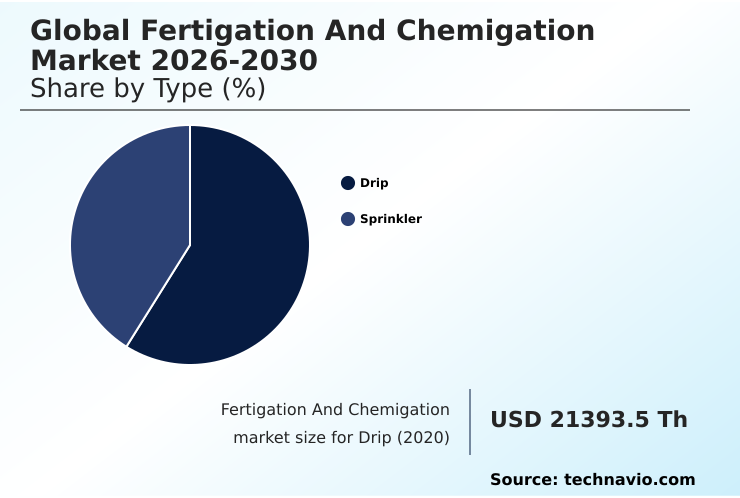
The Drip segment was valued at USD 28.01 million in 2024 and showed a gradual increase during the forecast period.

Request Free Sample

Regional Analysis

Europe is estimated to contribute 38% to the growth of the global market during the forecast period.Technavio’s analysts have elaborately explained the regional trends and drivers that shape the market during the forecast period.

See How Fertigation And Chemigation Market Demand is Rising in Europe Request Free Sample

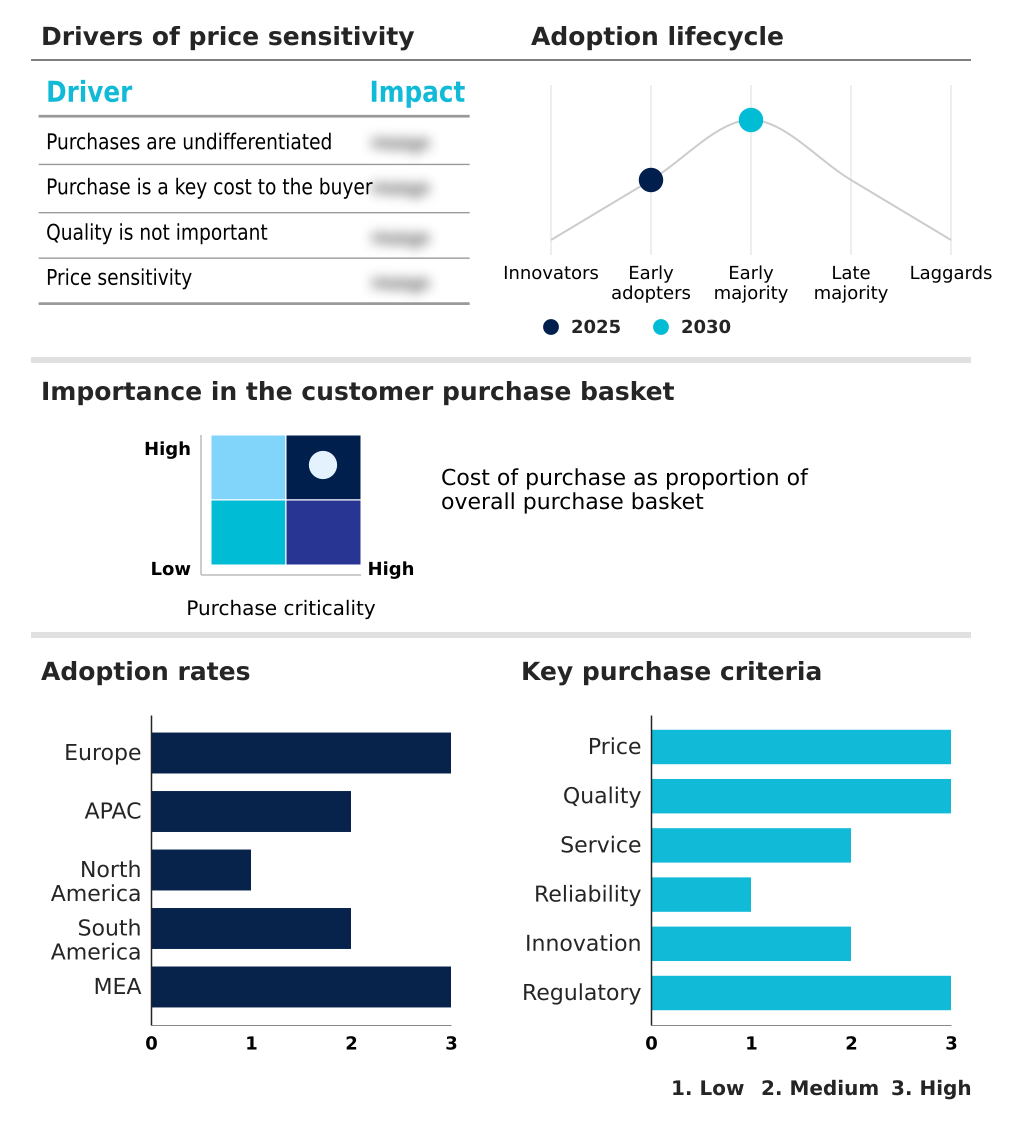
The geographic landscape of the fertigation and chemigation market is characterized by varied adoption rates and regional priorities, with Europe leading in market share, capturing approximately 38% of the global growth opportunity.

This dominance is propelled by stringent environmental regulations and a strong focus on sustainable intensification.

APAC follows, contributing nearly 30% to market growth, driven by government initiatives in countries like India and China to promote water conservation technologies and smart agriculture platforms.

In North America, adoption is concentrated in high-value crop sectors where precision nutrient management is critical for quality and yield.

The deployment of advanced filtration units and automated controllers is essential across all regions to combat issues like emitter clogging, ensuring the long-term viability of investments in both sprinkler irrigation systems and micro-irrigation solutions.

These regional dynamics highlight a global shift toward more technologically advanced and sustainable agricultural practices.
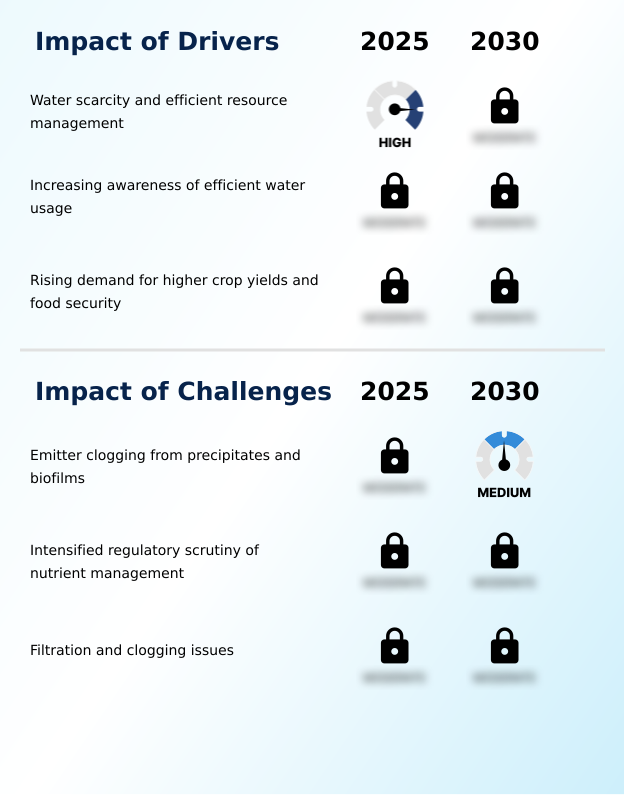
Market Dynamics

Our researchers analyzed the data with 2025 as the base year, along with the key drivers, trends, and challenges. A holistic analysis of drivers will help companies refine their marketing strategies to gain a competitive advantage.

  • The global fertigation and chemigation market continues to evolve as agricultural producers seek more efficient and sustainable methods for crop management. Key considerations include drip system maintenance for clogging and the chemigation impact on soil health, which are critical for long-term productivity. The fertigation for high-value crops is a major driver, as precision is paramount for profitability.
  • Concurrently, there is a focus on optimizing fertilizer use in sprinklers to broaden application. The IoT integration in fertigation systems is transforming the industry, enabling automated nutrient dosing for greenhouses and advanced variable rate chemigation technology. However, challenges persist, such as water-soluble fertilizer compatibility issues and preventing emitter biofouling in irrigation, which demand sophisticated solutions.
  • The use of chemigation systems for pest control and managing water quality for fertigation are integral components of modern integrated pest management strategies. Acid injection for pH control is a common practice to mitigate the impact of salinity on fertigation and enhance nutrient uptake via drip.
  • Economic assessments often analyze the cost-benefit of automated fertigation, with fertigation scheduling for fruit orchards serving as a prime example of optimizing inputs. Ultimately, the goal is improving crop resilience with chemigation and successfully integrating sensors with irrigation controllers.
  • Farms adopting these systems have documented water savings that are multiple times greater than those using traditional flood irrigation, directly improving their operational bottom line.

What are the key market drivers leading to the rise in the adoption of Fertigation And Chemigation Industry?

  • Escalating water scarcity and the corresponding imperative for efficient resource management are primary drivers advancing the market.

  • The market is primarily driven by the critical need for water conservation and resource efficiency in modern agriculture.
  • With increasing water scarcity worldwide, fertigation and chemigation systems offer a compelling solution, achieving up to 90% water use efficiency compared to traditional flood irrigation.
  • This efficiency not only conserves a vital resource but also translates into tangible economic benefits, with payback periods for system installations often under two years.
  • The ability of drip irrigation systems to deliver water-soluble fertilizers and liquid fertilizer formulations directly to the root zone enhances nutrient uptake, supporting both yield and soil health improvement.
  • These resource-efficient farming methods are essential for sustainable agriculture, enabling growers to maximize output while minimizing environmental impact and adhering to regulatory standards for nutrient leaching prevention.

What are the market trends shaping the Fertigation And Chemigation Industry?

  • The integration of precision technologies and the Internet of Things in fertigation systems is a significant market trend, enhancing resource efficiency and promoting sustainable agricultural practices.

  • A primary trend shaping the market is the integration of advanced digital technologies to enhance precision and efficiency. The adoption of IoT-enabled dosing systems and automated controllers allows for real-time monitoring and data-driven adjustments, improving water use efficiency to levels above 90%.
  • This shift toward smart agriculture platforms facilitates predictive analytics for irrigation, enabling variable rate application that optimizes resource use and boosts crop yields by up to 20%. The use of wireless sensor networks is becoming standard for collecting critical data on soil and plant health.
  • These advancements in precision nutrient management and remote irrigation management support sustainable intensification and help growers meet increasingly stringent environmental regulations while achieving significant operational cost reduction and improved crop quality enhancement.

What challenges does the Fertigation And Chemigation Industry face during its growth?

  • Emitter clogging, which arises from the accumulation of chemical precipitates and biofilms, presents a key technical challenge that affects system efficiency and industry growth.

  • A significant technical challenge confronting the market is emitter clogging caused by chemical precipitates and biofilms, which can reduce emission uniformity to below 90% and compromise system effectiveness. Maintenance protocols, such as acid washing, show varied success; studies indicate a 24% reduction in clogging is possible under optimal pH conditions, but this adds to operational burdens.
  • This issue necessitates investments in advanced solutions like self-cleaning filtration systems and anti-clog emitter geometries featuring wider labyrinth path emitters. Issues with biofilm mitigation protocols and chemical precipitate management are particularly pronounced when using low-quality water sources.
  • Consequently, innovation in material science and pre-treatment technologies like UV disinfection and disc filters is critical to ensure system reliability, protect investments, and maintain the performance of both micro-irrigation solutions and large-scale center-pivot irrigation networks.

Exclusive Technavio Analysis on Customer Landscape

The fertigation and chemigation market forecasting report includes the adoption lifecycle of the market, covering from the innovator’s stage to the laggard’s stage. It focuses on adoption rates in different regions based on penetration. Furthermore, the fertigation and chemigation market report also includes key purchase criteria and drivers of price sensitivity to help companies evaluate and develop their market growth analysis strategies.

Customer Landscape of Fertigation And Chemigation Industry

Competitive Landscape

Companies are implementing various strategies, such as strategic alliances, fertigation and chemigation market forecast, partnerships, mergers and acquisitions, geographical expansion, and product/service launches, to enhance their presence in the industry.

AGnVET Services - Providers offer advanced fertigation controllers and automated nutrient-dosing systems, enabling precise management for hydroponics and enhancing irrigation water applications.

The industry research and growth report includes detailed analyses of the competitive landscape of the market and information about key companies, including:

  • AGnVET Services
  • Agri-Inject Inc.
  • Bluelab Corp. Ltd.
  • Finolex Plasson Pvt. Ltd.
  • Galcon Bakarim Society Ltd.
  • Greentech India
  • Haifa Negev technologies Ltd.
  • Hunter Industries
  • Inject-O-Meter
  • Jain Irrigation Systems Ltd.
  • Lindsay Corp.
  • Nelson Irrigation Corp.
  • Netafim Ltd.
  • Rain Bird Corp.
  • Rivulis Irrigation Ltd.
  • T.L. Irrigation Co.
  • The Toro Co.
  • Valmont Industries Inc.

Qualitative and quantitative analysis of companies has been conducted to help clients understand the wider business environment as well as the strengths and weaknesses of key industry players. Data is qualitatively analyzed to categorize companies as pure play, category-focused, industry-focused, and diversified; it is quantitatively analyzed to categorize companies as dominant, leading, strong, tentative, and weak.

Recent Development and News in Fertigation and chemigation market

  • In October 2024, Irritec SPA introduced SFIDA, an Internet of Things-enabled intelligent fertigation system designed to optimize resource allocation and fertilizer efficacy through advanced irrigation protocols.
  • In November 2024, Netafim Italia finalized its acquisition of Tecnir S.r.l., a strategic move to broaden its precision irrigation service capabilities and strengthen its market presence in Europe.
  • In February 2025, The Toro Company launched Intelli360, a web-based digital toolkit developed to streamline equipment and irrigation management for turf professionals, enhancing operational efficiency.
  • In April 2025, Orbia Netafim announced a collaboration with Treetoscope, integrating its real-time plant-sensing technology into the GrowSphere platform to provide data-driven irrigation and fertigation recommendations for orchards.

Dive into Technavio’s robust research methodology, blending expert interviews, extensive data synthesis, and validated models for unparalleled Fertigation And Chemigation Market insights. See full methodology.

Market Scope
Page number 290
Base year 2025
Historic period 2020-2024
Forecast period 2026-2030
Growth momentum & CAGR Accelerate at a CAGR of 8.3%
Market growth 2026-2030 USD 24216.3 thousand
Market structure Fragmented
YoY growth 2025-2026(%) 7.6%
Key countries Germany, UK, France, Italy, Spain, The Netherlands, China, India, Japan, South Korea, Australia, Indonesia, US, Canada, Mexico, Brazil, Argentina, Chile, Saudi Arabia, South Africa, UAE, Israel and Turkey
Competitive landscape Leading Companies, Market Positioning of Companies, Competitive Strategies, and Industry Risks

Request Free Sample

Research Analyst Overview

  • The fertigation and chemigation market is fundamentally reshaping agricultural practices through the integration of advanced hardware and digital oversight. The deployment of drip irrigation systems and sprinkler irrigation systems, enhanced with automated controllers and soil moisture sensors, is becoming standard for achieving crop yield optimization.
  • This shift is driven by the need for superior nutrient use efficiency (NUE) and water use efficiency, which together can boost yields by up to 20%. Key boardroom decisions now center on capital expenditures for micro-irrigation solutions and IoT-enabled dosing systems that support variable rate application and direct root zone delivery.
  • Strategic investments in center-pivot irrigation and advanced filtration units are crucial for large-scale operations. Success in this market depends on addressing technical hurdles like chemical precipitate management and biofilm mitigation protocols, often requiring technologies like disc filters, UV disinfection, or specialized acid injection protocols.
  • The evolution toward smart agriculture platforms, which leverage digital farming technologies for climate adaptation strategies, is compelling producers to adopt more sophisticated, organic-compatible formulations and biostimulant-enhanced fertilizers to remain competitive in a resource-constrained world.

What are the Key Data Covered in this Fertigation And Chemigation Market Research and Growth Report?

  • What is the expected growth of the Fertigation And Chemigation Market between 2026 and 2030?

    • USD 24.22 million, at a CAGR of 8.3%

  • What segmentation does the market report cover?

    • The report is segmented by Type (Drip, and Sprinkler), Product Type (Fertilizers, Insecticides, Fungicides, Herbicides, and Others), Application (Agriculture irrigation, Landscape irrigation, Greenhouse irrigation, and Others) and Geography (Europe, APAC, North America, South America, Middle East and Africa)

  • Which regions are analyzed in the report?

    • Europe, APAC, North America, South America and Middle East and Africa

  • What are the key growth drivers and market challenges?

    • Water scarcity and efficient resource management, Emitter clogging from precipitates and biofilms

  • Who are the major players in the Fertigation And Chemigation Market?

    • AGnVET Services, Agri-Inject Inc., Bluelab Corp. Ltd., Finolex Plasson Pvt. Ltd., Galcon Bakarim Society Ltd., Greentech India, Haifa Negev technologies Ltd., Hunter Industries, Inject-O-Meter, Jain Irrigation Systems Ltd., Lindsay Corp., Nelson Irrigation Corp., Netafim Ltd., Rain Bird Corp., Rivulis Irrigation Ltd., T.L. Irrigation Co., The Toro Co. and Valmont Industries Inc.

Market Research Insights

  • The fertigation and chemigation market is defined by a push toward greater operational efficiency and sustainability, with adoption delivering measurable business outcomes. Advanced systems demonstrate up to 90% water use efficiency compared to conventional methods, a critical advantage in water-stressed agricultural regions.
  • This efficiency gain, coupled with reduced labor needs, contributes to payback periods of under two years for many installations. Furthermore, precision nutrient management through these systems helps growers align with stringent regulatory compliance reporting for environmental protection. The integration of data-driven agronomy and remote irrigation management allows for precise control over inputs, enhancing resource-efficient farming.
  • As a result, enterprises can achieve significant operational cost reduction while also improving soil health, showcasing a clear return on investment beyond simple yield increases.

We can help! Our analysts can customize this fertigation and chemigation market research report to meet your requirements.

Get in touch

1. Executive Summary

1.1 Market overview

Executive Summary - Chart on Market Overview
Executive Summary - Data Table on Market Overview
Executive Summary - Chart on Global Market Characteristics
Executive Summary - Chart on Market by Geography
Executive Summary - Chart on Market Segmentation by Type
Executive Summary - Chart on Market Segmentation by Product Type
Executive Summary - Chart on Market Segmentation by Application
Executive Summary - Chart on Incremental Growth
Executive Summary - Data Table on Incremental Growth
Executive Summary - Chart on Company Market Positioning

2. Technavio Analysis

2.1 Analysis of price sensitivity, lifecycle, customer purchase basket, adoption rates, and purchase criteria

2.2 Criticality of inputs and Factors of differentiation

Chart on Overview on criticality of inputs and factors of differentiation

2.3 Factors of disruption

Chart on Overview on factors of disruption

2.4 Impact of drivers and challenges

Chart on Impact of drivers and challenges in 2025 and 2030

3. Market Landscape

3.1 Market ecosystem

Chart on Parent Market
Data Table on - Parent Market

3.2 Market characteristics

Chart on Market characteristics analysis

3.3 Value chain analysis

Chart on Value chain analysis

4. Market Sizing

4.1 Market definition

Data Table on Offerings of companies included in the market definition

4.2 Market segment analysis

Market segments

4.3 Market size 2025

4.4 Market outlook: Forecast for 2025-2030

Chart on Global - Market size and forecast 2025-2030 ($ thousand)
Data Table on Global - Market size and forecast 2025-2030 ($ thousand)
Chart on Global Market: Year-over-year growth 2025-2030 (%)
Data Table on Global Market: Year-over-year growth 2025-2030 (%)

5. Historic Market Size

5.1 Global Fertigation And Chemigation Market 2020 - 2024

Historic Market Size - Data Table on Global Fertigation And Chemigation Market 2020 - 2024 ($ thousand)

5.2 Type segment analysis 2020 - 2024

Historic Market Size - Type Segment 2020 - 2024 ($ thousand)

5.3 Product Type segment analysis 2020 - 2024

Historic Market Size - Product Type Segment 2020 - 2024 ($ thousand)

5.4 Application segment analysis 2020 - 2024

Historic Market Size - Application Segment 2020 - 2024 ($ thousand)

5.5 Geography segment analysis 2020 - 2024

Historic Market Size - Geography Segment 2020 - 2024 ($ thousand)

5.6 Country segment analysis 2020 - 2024

Historic Market Size - Country Segment 2020 - 2024 ($ thousand)

6. Qualitative Analysis

6.1 The AI impact on Global Fertigation and Chemigation Market

7. Five Forces Analysis

7.1 Five forces summary

Five forces analysis - Comparison between 2025 and 2030

7.2 Bargaining power of buyers

Bargaining power of buyers - Impact of key factors 2025 and 2030

7.3 Bargaining power of suppliers

Bargaining power of suppliers - Impact of key factors in 2025 and 2030

7.4 Threat of new entrants

Threat of new entrants - Impact of key factors in 2025 and 2030

7.5 Threat of substitutes

Threat of substitutes - Impact of key factors in 2025 and 2030

7.6 Threat of rivalry

Threat of rivalry - Impact of key factors in 2025 and 2030

7.7 Market condition

Chart on Market condition - Five forces 2025 and 2030

8. Market Segmentation by Type

8.1 Market segments

Chart on Type - Market share 2025-2030 (%)
Data Table on Type - Market share 2025-2030 (%)

8.2 Comparison by Type

Chart on Comparison by Type
Data Table on Comparison by Type

8.3 Drip - Market size and forecast 2025-2030

Chart on Drip - Market size and forecast 2025-2030 ($ thousand)
Data Table on Drip - Market size and forecast 2025-2030 ($ thousand)
Chart on Drip - Year-over-year growth 2025-2030 (%)
Data Table on Drip - Year-over-year growth 2025-2030 (%)

8.4 Sprinkler - Market size and forecast 2025-2030

Chart on Sprinkler - Market size and forecast 2025-2030 ($ thousand)
Data Table on Sprinkler - Market size and forecast 2025-2030 ($ thousand)
Chart on Sprinkler - Year-over-year growth 2025-2030 (%)
Data Table on Sprinkler - Year-over-year growth 2025-2030 (%)

8.5 Market opportunity by Type

Market opportunity by Type ($ thousand)
Data Table on Market opportunity by Type ($ thousand)

9. Market Segmentation by Product Type

9.1 Market segments

Chart on Product Type - Market share 2025-2030 (%)
Data Table on Product Type - Market share 2025-2030 (%)

9.2 Comparison by Product Type

Chart on Comparison by Product Type
Data Table on Comparison by Product Type

9.3 Fertilizers - Market size and forecast 2025-2030

Chart on Fertilizers - Market size and forecast 2025-2030 ($ thousand)
Data Table on Fertilizers - Market size and forecast 2025-2030 ($ thousand)
Chart on Fertilizers - Year-over-year growth 2025-2030 (%)
Data Table on Fertilizers - Year-over-year growth 2025-2030 (%)

9.4 Insecticides - Market size and forecast 2025-2030

Chart on Insecticides - Market size and forecast 2025-2030 ($ thousand)
Data Table on Insecticides - Market size and forecast 2025-2030 ($ thousand)
Chart on Insecticides - Year-over-year growth 2025-2030 (%)
Data Table on Insecticides - Year-over-year growth 2025-2030 (%)

9.5 Fungicides - Market size and forecast 2025-2030

Chart on Fungicides - Market size and forecast 2025-2030 ($ thousand)
Data Table on Fungicides - Market size and forecast 2025-2030 ($ thousand)
Chart on Fungicides - Year-over-year growth 2025-2030 (%)
Data Table on Fungicides - Year-over-year growth 2025-2030 (%)

9.6 Herbicides - Market size and forecast 2025-2030

Chart on Herbicides - Market size and forecast 2025-2030 ($ thousand)
Data Table on Herbicides - Market size and forecast 2025-2030 ($ thousand)
Chart on Herbicides - Year-over-year growth 2025-2030 (%)
Data Table on Herbicides - Year-over-year growth 2025-2030 (%)

9.7 Others - Market size and forecast 2025-2030

Chart on Others - Market size and forecast 2025-2030 ($ thousand)
Data Table on Others - Market size and forecast 2025-2030 ($ thousand)
Chart on Others - Year-over-year growth 2025-2030 (%)
Data Table on Others - Year-over-year growth 2025-2030 (%)

9.8 Market opportunity by Product Type

Market opportunity by Product Type ($ thousand)
Data Table on Market opportunity by Product Type ($ thousand)

10. Market Segmentation by Application

10.1 Market segments

Chart on Application - Market share 2025-2030 (%)
Data Table on Application - Market share 2025-2030 (%)

10.2 Comparison by Application

Chart on Comparison by Application
Data Table on Comparison by Application

10.3 Agriculture irrigation - Market size and forecast 2025-2030

Chart on Agriculture irrigation - Market size and forecast 2025-2030 ($ thousand)
Data Table on Agriculture irrigation - Market size and forecast 2025-2030 ($ thousand)
Chart on Agriculture irrigation - Year-over-year growth 2025-2030 (%)
Data Table on Agriculture irrigation - Year-over-year growth 2025-2030 (%)

10.4 Landscape irrigation - Market size and forecast 2025-2030

Chart on Landscape irrigation - Market size and forecast 2025-2030 ($ thousand)
Data Table on Landscape irrigation - Market size and forecast 2025-2030 ($ thousand)
Chart on Landscape irrigation - Year-over-year growth 2025-2030 (%)
Data Table on Landscape irrigation - Year-over-year growth 2025-2030 (%)

10.5 Greenhouse irrigation - Market size and forecast 2025-2030

Chart on Greenhouse irrigation - Market size and forecast 2025-2030 ($ thousand)
Data Table on Greenhouse irrigation - Market size and forecast 2025-2030 ($ thousand)
Chart on Greenhouse irrigation - Year-over-year growth 2025-2030 (%)
Data Table on Greenhouse irrigation - Year-over-year growth 2025-2030 (%)

10.6 Others - Market size and forecast 2025-2030

Chart on Others - Market size and forecast 2025-2030 ($ thousand)
Data Table on Others - Market size and forecast 2025-2030 ($ thousand)
Chart on Others - Year-over-year growth 2025-2030 (%)
Data Table on Others - Year-over-year growth 2025-2030 (%)

10.7 Market opportunity by Application

Market opportunity by Application ($ thousand)
Data Table on Market opportunity by Application ($ thousand)

11. Customer Landscape

11.1 Customer landscape overview

Analysis of price sensitivity, lifecycle, customer purchase basket, adoption rates, and purchase criteria

12. Geographic Landscape

12.1 Geographic segmentation

Chart on Market share by geography 2025-2030 (%)
Data Table on Market share by geography 2025-2030 (%)

12.2 Geographic comparison

Chart on Geographic comparison
Data Table on Geographic comparison

12.3 Europe - Market size and forecast 2025-2030

Chart on Europe - Market size and forecast 2025-2030 ($ thousand)
Data Table on Europe - Market size and forecast 2025-2030 ($ thousand)
Chart on Europe - Year-over-year growth 2025-2030 (%)
Data Table on Europe - Year-over-year growth 2025-2030 (%)
Chart on Regional Comparison - Europe
Data Table on Regional Comparison - Europe

12.3.1 Germany - Market size and forecast 2025-2030

Chart on Germany - Market size and forecast 2025-2030 ($ thousand)
Data Table on Germany - Market size and forecast 2025-2030 ($ thousand)
Chart on Germany - Year-over-year growth 2025-2030 (%)
Data Table on Germany - Year-over-year growth 2025-2030 (%)

12.3.2 UK - Market size and forecast 2025-2030

Chart on UK - Market size and forecast 2025-2030 ($ thousand)
Data Table on UK - Market size and forecast 2025-2030 ($ thousand)
Chart on UK - Year-over-year growth 2025-2030 (%)
Data Table on UK - Year-over-year growth 2025-2030 (%)

12.3.3 France - Market size and forecast 2025-2030

Chart on France - Market size and forecast 2025-2030 ($ thousand)
Data Table on France - Market size and forecast 2025-2030 ($ thousand)
Chart on France - Year-over-year growth 2025-2030 (%)
Data Table on France - Year-over-year growth 2025-2030 (%)

12.3.4 Italy - Market size and forecast 2025-2030

Chart on Italy - Market size and forecast 2025-2030 ($ thousand)
Data Table on Italy - Market size and forecast 2025-2030 ($ thousand)
Chart on Italy - Year-over-year growth 2025-2030 (%)
Data Table on Italy - Year-over-year growth 2025-2030 (%)

12.3.5 Spain - Market size and forecast 2025-2030

Chart on Spain - Market size and forecast 2025-2030 ($ thousand)
Data Table on Spain - Market size and forecast 2025-2030 ($ thousand)
Chart on Spain - Year-over-year growth 2025-2030 (%)
Data Table on Spain - Year-over-year growth 2025-2030 (%)

12.3.6 The Netherlands - Market size and forecast 2025-2030

Chart on The Netherlands - Market size and forecast 2025-2030 ($ thousand)
Data Table on The Netherlands - Market size and forecast 2025-2030 ($ thousand)
Chart on The Netherlands - Year-over-year growth 2025-2030 (%)
Data Table on The Netherlands - Year-over-year growth 2025-2030 (%)

12.4 APAC - Market size and forecast 2025-2030

Chart on APAC - Market size and forecast 2025-2030 ($ thousand)
Data Table on APAC - Market size and forecast 2025-2030 ($ thousand)
Chart on APAC - Year-over-year growth 2025-2030 (%)
Data Table on APAC - Year-over-year growth 2025-2030 (%)
Chart on Regional Comparison - APAC
Data Table on Regional Comparison - APAC

12.4.1 China - Market size and forecast 2025-2030

Chart on China - Market size and forecast 2025-2030 ($ thousand)
Data Table on China - Market size and forecast 2025-2030 ($ thousand)
Chart on China - Year-over-year growth 2025-2030 (%)
Data Table on China - Year-over-year growth 2025-2030 (%)

12.4.2 India - Market size and forecast 2025-2030

Chart on India - Market size and forecast 2025-2030 ($ thousand)
Data Table on India - Market size and forecast 2025-2030 ($ thousand)
Chart on India - Year-over-year growth 2025-2030 (%)
Data Table on India - Year-over-year growth 2025-2030 (%)

12.4.3 Japan - Market size and forecast 2025-2030

Chart on Japan - Market size and forecast 2025-2030 ($ thousand)
Data Table on Japan - Market size and forecast 2025-2030 ($ thousand)
Chart on Japan - Year-over-year growth 2025-2030 (%)
Data Table on Japan - Year-over-year growth 2025-2030 (%)

12.4.4 South Korea - Market size and forecast 2025-2030

Chart on South Korea - Market size and forecast 2025-2030 ($ thousand)
Data Table on South Korea - Market size and forecast 2025-2030 ($ thousand)
Chart on South Korea - Year-over-year growth 2025-2030 (%)
Data Table on South Korea - Year-over-year growth 2025-2030 (%)

12.4.5 Australia - Market size and forecast 2025-2030

Chart on Australia - Market size and forecast 2025-2030 ($ thousand)
Data Table on Australia - Market size and forecast 2025-2030 ($ thousand)
Chart on Australia - Year-over-year growth 2025-2030 (%)
Data Table on Australia - Year-over-year growth 2025-2030 (%)

12.4.6 Indonesia - Market size and forecast 2025-2030

Chart on Indonesia - Market size and forecast 2025-2030 ($ thousand)
Data Table on Indonesia - Market size and forecast 2025-2030 ($ thousand)
Chart on Indonesia - Year-over-year growth 2025-2030 (%)
Data Table on Indonesia - Year-over-year growth 2025-2030 (%)

12.5 North America - Market size and forecast 2025-2030

Chart on North America - Market size and forecast 2025-2030 ($ thousand)
Data Table on North America - Market size and forecast 2025-2030 ($ thousand)
Chart on North America - Year-over-year growth 2025-2030 (%)
Data Table on North America - Year-over-year growth 2025-2030 (%)
Chart on Regional Comparison - North America
Data Table on Regional Comparison - North America

12.5.1 US - Market size and forecast 2025-2030

Chart on US - Market size and forecast 2025-2030 ($ thousand)
Data Table on US - Market size and forecast 2025-2030 ($ thousand)
Chart on US - Year-over-year growth 2025-2030 (%)
Data Table on US - Year-over-year growth 2025-2030 (%)

12.5.2 Canada - Market size and forecast 2025-2030

Chart on Canada - Market size and forecast 2025-2030 ($ thousand)
Data Table on Canada - Market size and forecast 2025-2030 ($ thousand)
Chart on Canada - Year-over-year growth 2025-2030 (%)
Data Table on Canada - Year-over-year growth 2025-2030 (%)

12.5.3 Mexico - Market size and forecast 2025-2030

Chart on Mexico - Market size and forecast 2025-2030 ($ thousand)
Data Table on Mexico - Market size and forecast 2025-2030 ($ thousand)
Chart on Mexico - Year-over-year growth 2025-2030 (%)
Data Table on Mexico - Year-over-year growth 2025-2030 (%)

12.6 South America - Market size and forecast 2025-2030

Chart on South America - Market size and forecast 2025-2030 ($ thousand)
Data Table on South America - Market size and forecast 2025-2030 ($ thousand)
Chart on South America - Year-over-year growth 2025-2030 (%)
Data Table on South America - Year-over-year growth 2025-2030 (%)
Chart on Regional Comparison - South America
Data Table on Regional Comparison - South America

12.6.1 Brazil - Market size and forecast 2025-2030

Chart on Brazil - Market size and forecast 2025-2030 ($ thousand)
Data Table on Brazil - Market size and forecast 2025-2030 ($ thousand)
Chart on Brazil - Year-over-year growth 2025-2030 (%)
Data Table on Brazil - Year-over-year growth 2025-2030 (%)

12.6.2 Argentina - Market size and forecast 2025-2030

Chart on Argentina - Market size and forecast 2025-2030 ($ thousand)
Data Table on Argentina - Market size and forecast 2025-2030 ($ thousand)
Chart on Argentina - Year-over-year growth 2025-2030 (%)
Data Table on Argentina - Year-over-year growth 2025-2030 (%)

12.6.3 Chile - Market size and forecast 2025-2030

Chart on Chile - Market size and forecast 2025-2030 ($ thousand)
Data Table on Chile - Market size and forecast 2025-2030 ($ thousand)
Chart on Chile - Year-over-year growth 2025-2030 (%)
Data Table on Chile - Year-over-year growth 2025-2030 (%)

12.7 Middle East and Africa - Market size and forecast 2025-2030

Chart on Middle East and Africa - Market size and forecast 2025-2030 ($ thousand)
Data Table on Middle East and Africa - Market size and forecast 2025-2030 ($ thousand)
Chart on Middle East and Africa - Year-over-year growth 2025-2030 (%)
Data Table on Middle East and Africa - Year-over-year growth 2025-2030 (%)
Chart on Regional Comparison - Middle East and Africa
Data Table on Regional Comparison - Middle East and Africa

12.7.1 Saudi Arabia - Market size and forecast 2025-2030

Chart on Saudi Arabia - Market size and forecast 2025-2030 ($ thousand)
Data Table on Saudi Arabia - Market size and forecast 2025-2030 ($ thousand)
Chart on Saudi Arabia - Year-over-year growth 2025-2030 (%)
Data Table on Saudi Arabia - Year-over-year growth 2025-2030 (%)

12.7.2 South Africa - Market size and forecast 2025-2030

Chart on South Africa - Market size and forecast 2025-2030 ($ thousand)
Data Table on South Africa - Market size and forecast 2025-2030 ($ thousand)
Chart on South Africa - Year-over-year growth 2025-2030 (%)
Data Table on South Africa - Year-over-year growth 2025-2030 (%)

12.7.3 UAE - Market size and forecast 2025-2030

Chart on UAE - Market size and forecast 2025-2030 ($ thousand)
Data Table on UAE - Market size and forecast 2025-2030 ($ thousand)
Chart on UAE - Year-over-year growth 2025-2030 (%)
Data Table on UAE - Year-over-year growth 2025-2030 (%)

12.7.4 Israel - Market size and forecast 2025-2030

Chart on Israel - Market size and forecast 2025-2030 ($ thousand)
Data Table on Israel - Market size and forecast 2025-2030 ($ thousand)
Chart on Israel - Year-over-year growth 2025-2030 (%)
Data Table on Israel - Year-over-year growth 2025-2030 (%)

12.7.5 Turkey - Market size and forecast 2025-2030

Chart on Turkey - Market size and forecast 2025-2030 ($ thousand)
Data Table on Turkey - Market size and forecast 2025-2030 ($ thousand)
Chart on Turkey - Year-over-year growth 2025-2030 (%)
Data Table on Turkey - Year-over-year growth 2025-2030 (%)

12.8 Market opportunity by geography

Market opportunity by geography ($ thousand)
Data Tables on Market opportunity by geography ($ thousand)

13. Drivers, Challenges, and Opportunity

13.1 Market drivers

Water scarcity and efficient resource management
Increasing awareness of efficient water usage
Rising demand for higher crop yields and food security

13.2 Market challenges

Emitter clogging from precipitates and biofilms
Intensified regulatory scrutiny of nutrient management
Filtration and clogging issues

13.3 Impact of drivers and challenges

Impact of drivers and challenges in 2025 and 2030

13.4 Market opportunities

Integration of precision technologies and IoT in fertigation systems
Expansion of greenhouse and controlled environment agriculture
Emphasis on sustainability and water conservation innovations

14. Competitive Landscape

14.1 Overview

14.2

Overview on criticality of inputs and factors of differentiation

14.3 Landscape disruption

Overview on factors of disruption

14.4 Industry risks

Impact of key risks on business

15. Competitive Analysis

15.1 Companies profiled

Companies covered

15.2 Company ranking index

15.3 Market positioning of companies

Matrix on companies position and classification

15.4 Bluelab Corp. Ltd.

Bluelab Corp. Ltd. - Overview
Bluelab Corp. Ltd. - Product / Service
Bluelab Corp. Ltd. - Key offerings
SWOT

15.5 Finolex Plasson Pvt. Ltd.

Finolex Plasson Pvt. Ltd. - Overview
Finolex Plasson Pvt. Ltd. - Product / Service
Finolex Plasson Pvt. Ltd. - Key offerings
SWOT

15.6 Galcon Bakarim Society Ltd.

Galcon Bakarim Society Ltd. - Overview
Galcon Bakarim Society Ltd. - Product / Service
Galcon Bakarim Society Ltd. - Key offerings
SWOT

15.7 Haifa Negev technologies Ltd.

Haifa Negev technologies Ltd. - Overview
Haifa Negev technologies Ltd. - Product / Service
Haifa Negev technologies Ltd. - Key offerings
SWOT

15.8 Hunter Industries

Hunter Industries - Overview
Hunter Industries - Product / Service
Hunter Industries - Key offerings
SWOT

15.9 Inject-O-Meter

Inject-O-Meter - Overview
Inject-O-Meter - Product / Service
Inject-O-Meter - Key offerings
SWOT

15.10 Jain Irrigation Systems Ltd.

Jain Irrigation Systems Ltd. - Overview
Jain Irrigation Systems Ltd. - Business segments
Jain Irrigation Systems Ltd. - Key offerings
Jain Irrigation Systems Ltd. - Segment focus
SWOT

15.11 Lindsay Corp.

Lindsay Corp. - Overview
Lindsay Corp. - Business segments
Lindsay Corp. - Key offerings
Lindsay Corp. - Segment focus
SWOT

15.12 Nelson Irrigation Corp.

Nelson Irrigation Corp. - Overview
Nelson Irrigation Corp. - Product / Service
Nelson Irrigation Corp. - Key offerings
SWOT

15.13 Netafim Ltd.

Netafim Ltd. - Overview
Netafim Ltd. - Product / Service
Netafim Ltd. - Key offerings
SWOT

15.14 Rain Bird Corp.

Rain Bird Corp. - Overview
Rain Bird Corp. - Product / Service
Rain Bird Corp. - Key offerings
SWOT

15.15 Rivulis Irrigation Ltd.

Rivulis Irrigation Ltd. - Overview
Rivulis Irrigation Ltd. - Product / Service
Rivulis Irrigation Ltd. - Key offerings
SWOT

15.16 T.L. Irrigation Co.

T.L. Irrigation Co. - Overview
T.L. Irrigation Co. - Product / Service
T.L. Irrigation Co. - Key offerings
SWOT

15.17 The Toro Co.

The Toro Co. - Overview
The Toro Co. - Business segments
The Toro Co. - Key news
The Toro Co. - Key offerings
The Toro Co. - Segment focus
SWOT

15.18 Valmont Industries Inc.

Valmont Industries Inc. - Overview
Valmont Industries Inc. - Business segments
Valmont Industries Inc. - Key offerings
Valmont Industries Inc. - Segment focus
SWOT

16. Appendix

16.1 Scope of the report

Market definition
Objectives
Notes and caveats

16.2 Inclusions and exclusions checklist

Inclusions checklist
Exclusions checklist

16.3 Currency conversion rates for US$

16.4 Research methodology

16.5 Data procurement

Information sources

16.6 Data validation

16.7 Validation techniques employed for market sizing

16.8 Data synthesis

16.9 360 degree market analysis

16.10 List of abbreviations

Research Methodology

Technavio presents a detailed picture of the market by way of study, synthesis, and summation of data from multiple sources. The analysts have presented the various facets of the market with a particular focus on identifying the key industry influencers. The data thus presented is comprehensive, reliable, and the result of extensive research, both primary and secondary.

INFORMATION SOURCES

Primary sources

  • Manufacturers and suppliers
  • Channel partners
  • Industry experts
  • Strategic decision makers

Secondary sources

  • Industry journals and periodicals
  • Government data
  • Financial reports of key industry players
  • Historical data
  • Press releases

DATA ANALYSIS

Data Synthesis

  • Collation of data
  • Estimation of key figures
  • Analysis of derived insights

Data Validation

  • Triangulation with data models
  • Reference against proprietary databases
  • Corroboration with industry experts

REPORT WRITING

Qualitative

  • Market drivers
  • Market challenges
  • Market trends
  • Five forces analysis

Quantitative

  • Market size and forecast
  • Market segmentation
  • Geographical insights
  • Competitive landscape

Interested in this report?

Get your sample now to see our research methodology and insights!

Download Now

Frequently Asked Questions

Fertigation And Chemigation market growth will increase by USD 24216.3 thousand thousand during 2026-2030.

The Fertigation And Chemigation market is expected to grow at a CAGR of 8.3% during 2026-2030.

Fertigation And Chemigation market is segmented by Type (Drip, Sprinkler) Product type (Fertilizers, Insecticides, Fungicides, Herbicides, Others) Application (Agriculture irrigation, Landscape irrigation, Greenhouse irrigation, Others)

AGnVET Services, Agri-Inject Inc., Bluelab Corp. Ltd., Finolex Plasson Pvt. Ltd., Galcon Bakarim Society Ltd., Greentech India, Haifa Negev technologies Ltd., Hunter Industries, Inject-O-Meter, Jain Irrigation Systems Ltd., Lindsay Corp., Nelson Irrigation Corp., Netafim Ltd., Rain Bird Corp., Rivulis Irrigation Ltd., T.L. Irrigation Co., The Toro Co., Valmont Industries Inc. are a few of the key vendors in the Fertigation And Chemigation market.

Europe will register the highest growth rate of 38% among the other regions. Therefore, the Fertigation And Chemigation market in Europe is expected to garner significant business opportunities for the vendors during the forecast period.

Germany, UK, France, Italy, Spain, The Netherlands, China, India, Japan, South Korea, Australia, Indonesia, US, Canada, Mexico, Brazil, Argentina, Chile, Saudi Arabia, South Africa, UAE, Israel, Turkey

  • Water scarcity and efficient resource management is the driving factor this market.

The Fertigation And Chemigation market vendors should focus on grabbing business opportunities from the Type segment as it accounted for the largest market share in the base year.