Fiberglass Fabrics Market Analysis, Size, and Forecast 2026-2030: APAC (China, Japan, and India), North America (US, Canada, and Mexico), Europe (Germany, UK, and France), South America (Brazil and Argentina), Middle East and Africa (Saudi Arabia, UAE, and South Africa), and Rest of World (ROW)

Fiberglass Fabrics Market Analysis, Size, and Forecast 2026-2030:
APAC (China, Japan, and India), North America (US, Canada, and Mexico), Europe (Germany, UK, and France), South America (Brazil and Argentina), Middle East and Africa (Saudi Arabia, UAE, and South Africa), and Rest of World (ROW)

Published: Dec 2025 303 Pages SKU: IRTNTR80171

Market Overview at a Glance

$3.61 B
Market Opportunity
8.2%
CAGR 2025 - 2030
37.8%
APAC Growth
$3.00 B
Construction segment 2024

Fiberglass Fabrics Market Size 2026-2030

The fiberglass fabrics market size is valued to increase by USD 3.61 billion, at a CAGR of 8.2% from 2025 to 2030. Sustained growth in global construction and infrastructure sector will drive the fiberglass fabrics market.

Major Market Trends & Insights

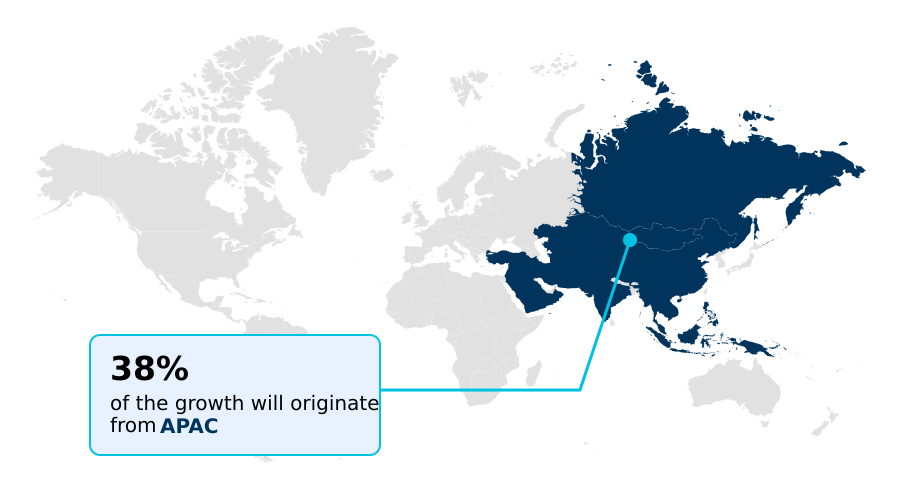
  • APAC dominated the market and accounted for a 37.8% growth during the forecast period.
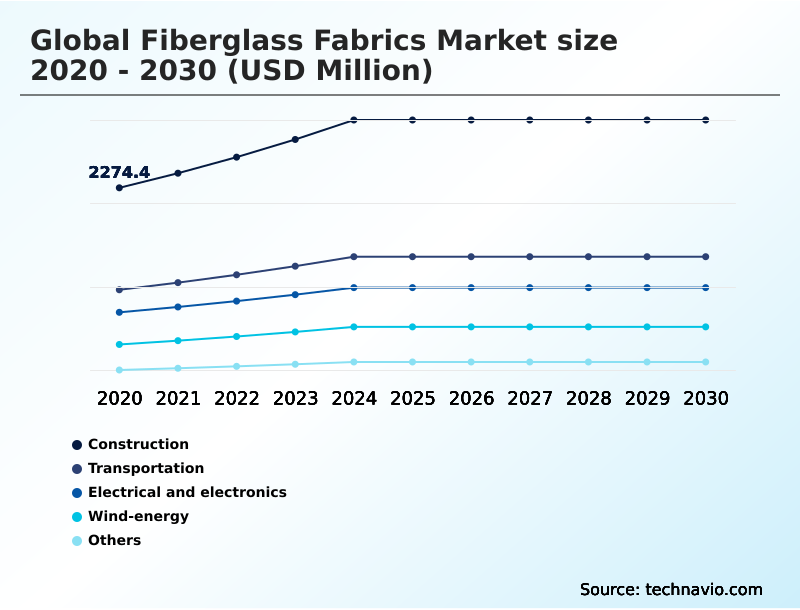
  • By Application - Construction segment was valued at USD 3.00 billion in 2024
  • By Type - Woven fiberglass fabric segment accounted for the largest market revenue share in 2024

Market Size & Forecast

  • Market Opportunities: USD 5.74 billion
  • Market Future Opportunities: USD 3.61 billion
  • CAGR from 2025 to 2030 : 8.2%

Market Summary

  • The fiberglass fabrics market is characterized by its critical role in advancing lightweight, high-strength composite solutions across multiple industries. Demand is principally driven by the relentless pursuit of efficiency in the transportation sector, the global expansion of renewable energy infrastructure, and the continuous need for durable materials in construction.
  • Key trends include the adoption of thermoplastic composites to address sustainability and high-volume production challenges, alongside the development of hybrid fabrics that offer tailored performance characteristics.
  • However, the industry contends with significant hurdles, including the price volatility of raw materials and energy, competition from alternative materials like carbon fiber and advanced metals, and the persistent challenge of recycling end-of-life thermoset composite parts.
  • For instance, an automotive manufacturer developing an electric vehicle platform must navigate these dynamics, balancing the need for lightweight, fire-retardant composite battery enclosures against material cost pressures and end-of-life disposal regulations. This scenario exemplifies the complex interplay of performance requirements, economic constraints, and environmental stewardship that defines the competitive landscape.

What will be the Size of the Fiberglass Fabrics Market during the forecast period?

Get Key Insights on Market Forecast (PDF) Request Free Sample

How is the Fiberglass Fabrics Market Segmented?

The fiberglass fabrics industry research report provides comprehensive data (region-wise segment analysis), with forecasts and estimates in "USD million" for the period 2026-2030, as well as historical data from 2020-2024 for the following segments.

  • Application
    • Construction
    • Transportation
    • Electrical and electronics
    • Wind-energy
    • Others
  • Type
    • Woven fiberglass fabric
    • Non-woven fiberglass fabric
  • Product type
    • E-glass
    • S-glass
    • Others
  • Geography
    • APAC
      • China
      • Japan
      • India
    • North America
      • US
      • Canada
      • Mexico
    • Europe
      • Germany
      • UK
      • France
    • South America
      • Brazil
      • Argentina
    • Middle East and Africa
      • Saudi Arabia
      • UAE
      • South Africa
    • Rest of World (ROW)

By Application Insights

The construction segment is estimated to witness significant growth during the forecast period.

The construction sector is a primary consumer, driven by the demand for materials that enhance structural integrity and longevity. The use of woven fiberglass fabric for concrete reinforcement is pivotal, leveraging the material's inherent high tensile strength and corrosion resistance.

In applications for structural strengthening of aging infrastructure, these composites provide exceptional dimensional stability. Integrating fire retardant materials into building envelopes is a critical application, with fabrics serving as non-combustible layers in wall systems and roofing.

Advanced architectural composites enable complex designs previously unachievable with traditional methods.

The push for sustainable construction and widespread infrastructure renewal further amplifies demand for materials offering superior thermal and acoustic insulation, with some automated processes reducing waste by over 15% compared to manual methods.

Request Free Sample

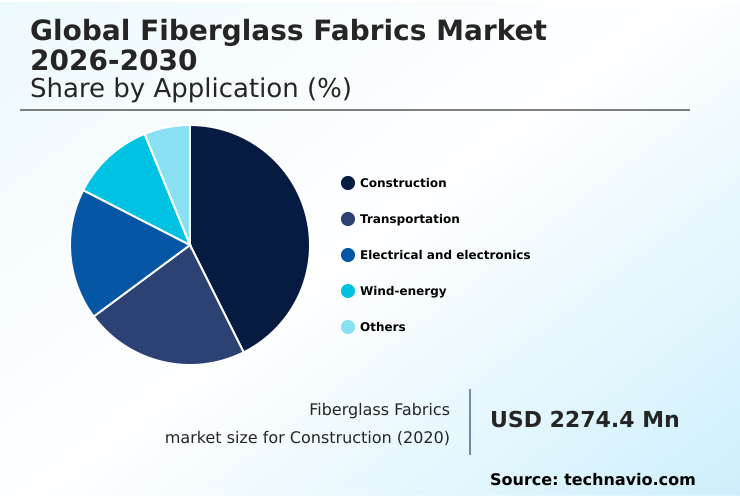
The Construction segment was valued at USD 3.00 billion in 2024 and showed a gradual increase during the forecast period.

Request Free Sample

Regional Analysis

APAC is estimated to contribute 37.8% to the growth of the global market during the forecast period.Technavio’s analysts have elaborately explained the regional trends and drivers that shape the market during the forecast period.

See How Fiberglass Fabrics Market Demand is Rising in APAC Request Free Sample

The geographic landscape is led by APAC, where rapid industrialization and large-scale manufacturing create immense demand.

This region's market expansion rate is approximately 17% higher than that of Europe, driven by its dominance in electronics and a burgeoning electric vehicle (EV) manufacturing ecosystem that depends on localized supply chains for components like automotive body panels.

In North America, the market is mature, with a focus on high-performance applications such as aerospace interiors and advanced air mobility (AAM).

The adoption of automated fiber placement systems in these advanced sectors reduces material waste by up to 20%, enhancing competitiveness.

Across all regions, the demand for E-glass grades for printed circuit boards (PCBs) remains a constant, while the use of non-woven fiberglass fabric, including chopped strand mat (CSM) and multiaxial fabrics, is growing in industrial applications.

Market Dynamics

Our researchers analyzed the data with 2025 as the base year, along with the key drivers, trends, and challenges. A holistic analysis of drivers will help companies refine their marketing strategies to gain a competitive advantage.

  • Strategic decision-making in the global fiberglass fabrics market 2026-2030 is increasingly focused on application-specific material selection. The choice between thermoplastic vs thermoset composite recycling is a critical consideration, particularly as regulations tighten. For mission-critical sectors, the use of high-performance composites for aerospace is non-negotiable, often favoring materials with exceptional fatigue resistance in wind blades and superior ballistic protection with s-glass.
  • In contrast, industrial applications prioritize corrosion-resistant piping for industrial use and enhancing durability in marine structures. In the automotive sector, the push for lightweight materials for electric vehicles drives innovation, with engineers focused on optimizing resin infusion processes to balance cost and performance.
  • This has operational implications, as sourcing for automotive lightweighting with fiberglass can be streamlined, reducing supply chain lead times by over 25% compared to more complex material sources. The demand for structural reinforcement for aging infrastructure, coupled with a focus on fire safety with fiberglass materials and non-combustible insulation for building envelopes, ensures stable demand from construction.
  • The cost-effectiveness of fiberglass reinforcement makes it a preferred solution, while the need to improve the impact resistance of hybrid composites continues to drive R&D efforts.

What are the key market drivers leading to the rise in the adoption of Fiberglass Fabrics Industry?

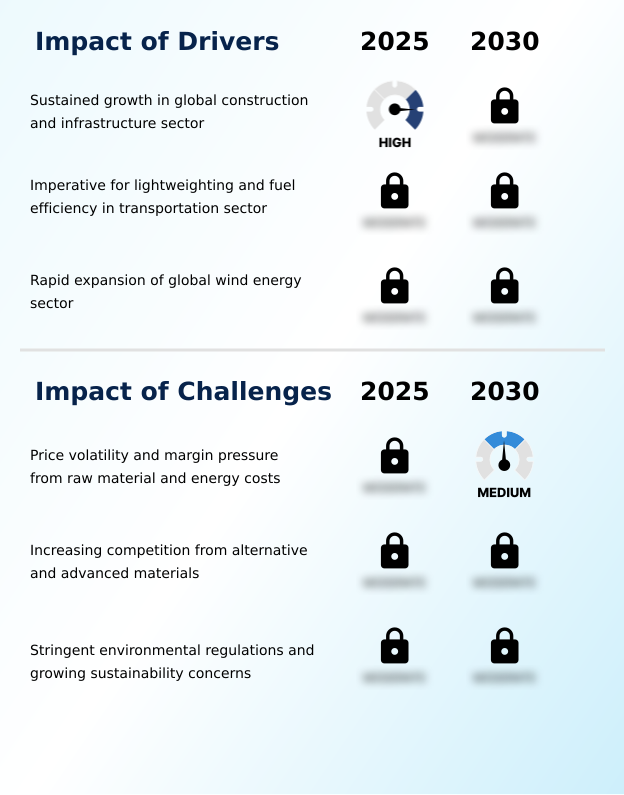
  • Sustained growth in the global construction and infrastructure sector serves as a key driver for the market.

  • Market growth is fundamentally tied to the demand for high-performance, lightweight materials in key sectors.
  • The imperative for lightweighting in transportation is a primary driver, with fiber reinforced polymer (FRP) composites offering a superior high strength-to-weight ratio that improves fuel efficiency by up to 10% in certain automotive applications.
  • This is achieved using processes like sheet molding compound (SMC) and resin transfer molding (RTM).
  • In the energy sector, the expansion of offshore wind installations and adherence to renewable energy targets fuel demand for E-glass fabrics used in wind turbine blades and nacelle housings. Modern blade designs have increased energy capture by over 12%.
  • The ongoing shift toward electric mobility and robust demand from the marine boat hulls market further solidify the material's strategic importance.

What are the market trends shaping the Fiberglass Fabrics Industry?

  • A key market trend is the growing prominence of thermoplastics and compatible fabrics, driven by the industry's push for enhanced recyclability and shorter manufacturing cycles.

  • Key market trends are reshaping manufacturing processes and material science. The shift toward thermoplastic composites, which offer recyclability aligned with circular economy principles, is accelerating, with rapid-cycle manufacturing techniques reducing processing times by over 90% compared to thermoset resins. This involves developing advanced fiber sizings to ensure compatibility.
  • Concurrently, the adoption of hybrid composite fabrics, which blend different fiber types, allows for part consolidation and enhanced vibration damping, improving impact resistance by up to 25% in certain applications. The integration of automation, including automated tape laying (ATL), is revolutionizing production by enabling the use of organosheets and commingled fabrics.
  • These custom material systems, including pre-impregnated materials (prepregs), are driving efficiency and enabling more complex designs.

What challenges does the Fiberglass Fabrics Industry face during its growth?

  • Price volatility and margin pressure stemming from raw material and energy costs represent a key challenge affecting industry growth.

  • The market contends with significant challenges that impact profitability and long-term sustainability. The energy-intensive production process makes manufacturers vulnerable to raw material volatility, with energy costs comprising up to 35% of operational expenses. This price instability is compounded by intense material substitution pressure from alternatives like carbon fiber composites, natural fibers, and basalt fiber.
  • A critical challenge is managing end-of-life composites, as over 98% of thermoset-based parts are landfilled, posing a hurdle for life cycle assessment (LCA) compliance. Furthermore, ensuring occupational health and safety standards are met while handling materials for applications like composite battery enclosures adds to regulatory compliance costs, making it difficult to maintain price stability against competing S-glass fabrics.

Exclusive Technavio Analysis on Customer Landscape

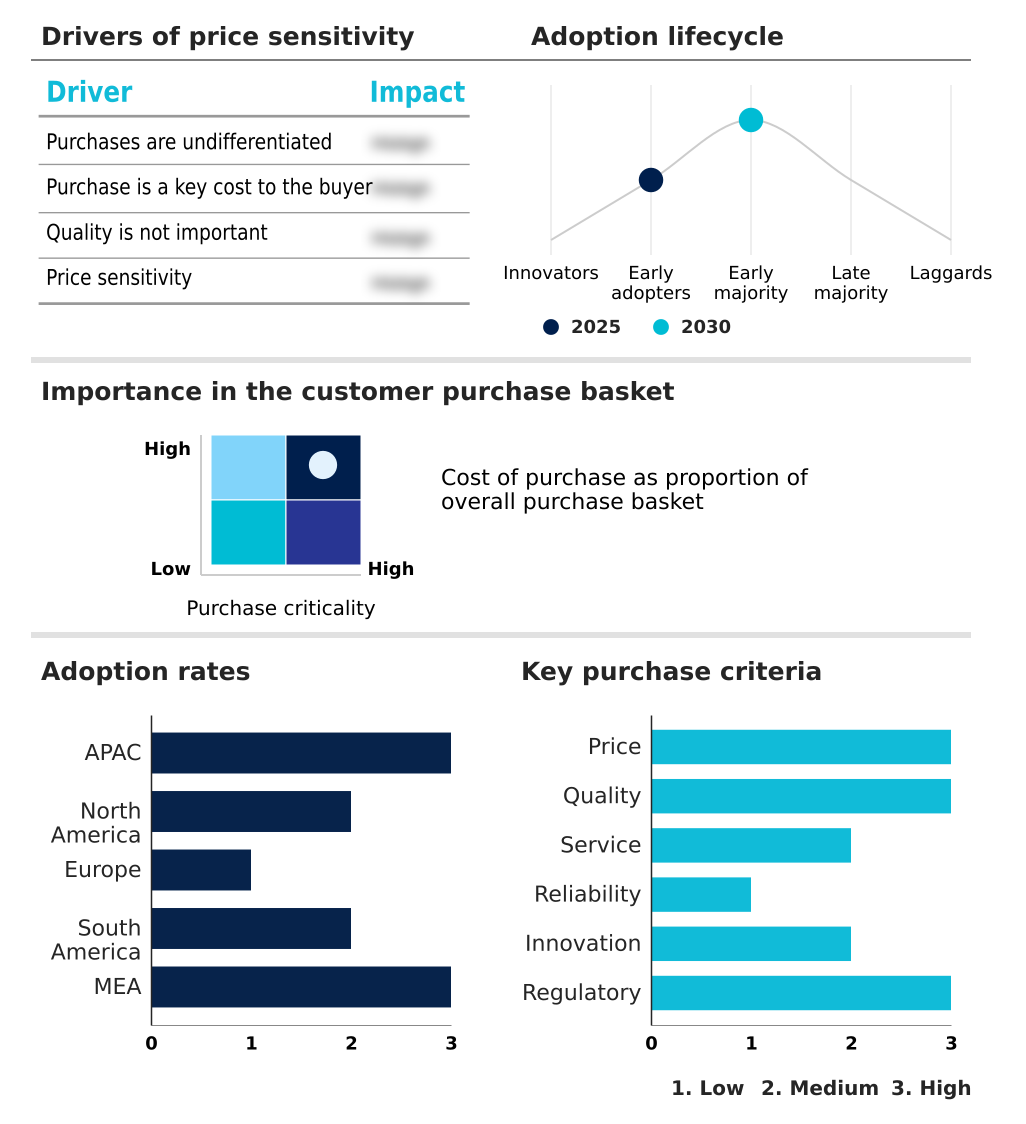
The fiberglass fabrics market forecasting report includes the adoption lifecycle of the market, covering from the innovator’s stage to the laggard’s stage. It focuses on adoption rates in different regions based on penetration. Furthermore, the fiberglass fabrics market report also includes key purchase criteria and drivers of price sensitivity to help companies evaluate and develop their market growth analysis strategies.

Customer Landscape of Fiberglass Fabrics Industry

Competitive Landscape

Companies are implementing various strategies, such as strategic alliances, fiberglass fabrics market forecast, partnerships, mergers and acquisitions, geographical expansion, and product/service launches, to enhance their presence in the industry.

3B the fiberglass Co. - Offerings include high-modulus non-crimp glass fabrics and direct rovings, engineered for wind turbine blades, prepregs, and advanced composite reinforcements.

The industry research and growth report includes detailed analyses of the competitive landscape of the market and information about key companies, including:

  • 3B the fiberglass Co.
  • AGY Holding Corp.
  • ASAHI FIBER GLASS Co. Ltd.
  • BGF Industries
  • Central Glass Co. Ltd.
  • China Jushi Co. Ltd.
  • Compagnie Chomarat
  • Compagnie de Saint Gobain SA
  • Hexcel Corp.
  • Johns Manville Corp.
  • Nippon Electric Glass Co. Ltd.
  • Owens Corning
  • P D Glasseiden GmbH Oschatz
  • Porcher Industries
  • SAERTEX GmbH and Co.KG
  • Sinoma Science and Technology Co. Ltd.
  • Taiwan Glass Ind. Corp.
  • ValuTex Reinforcements Inc.
  • Yuntianhua Group Co. Ltd.

Qualitative and quantitative analysis of companies has been conducted to help clients understand the wider business environment as well as the strengths and weaknesses of key industry players. Data is qualitatively analyzed to categorize companies as pure play, category-focused, industry-focused, and diversified; it is quantitatively analyzed to categorize companies as dominant, leading, strong, tentative, and weak.

Recent Development and News in Fiberglass fabrics market

  • In September, 2024, Owens Corning announced the launch of its new line of thermoplastic-compatible fabrics designed to improve processing speeds and recyclability for automotive components.
  • In November, 2024, SAERTEX GmbH and Co.KG secured a multi-year contract to supply high-performance multiaxial glass fabrics for the blades of a major North Sea offshore wind farm.
  • In January, 2025, Hexcel Corp. entered a strategic partnership with a leading automotive OEM to co-develop next-generation lightweight battery enclosures using advanced glass and hybrid composite materials.
  • In April, 2025, Compagnie de Saint Gobain SA revealed a new solvolysis-based recycling process capable of recovering high-quality glass fibers from end-of-life thermoset composite parts, addressing a key industry sustainability challenge.

Dive into Technavio’s robust research methodology, blending expert interviews, extensive data synthesis, and validated models for unparalleled Fiberglass Fabrics Market insights. See full methodology.

Market Scope
Page number 303
Base year 2025
Historic period 2020-2024
Forecast period 2026-2030
Growth momentum & CAGR Accelerate at a CAGR of 8.2%
Market growth 2026-2030 USD 3614.7 million
Market structure Fragmented
YoY growth 2025-2026(%) 7.6%
Key countries China, Japan, India, South Korea, Australia, Indonesia, US, Canada, Mexico, Germany, UK, France, Italy, Spain, The Netherlands, Brazil, Argentina, Chile, Saudi Arabia, UAE, South Africa, Israel and Turkey
Competitive landscape Leading Companies, Market Positioning of Companies, Competitive Strategies, and Industry Risks

Request Free Sample

Research Analyst Overview

  • The fiberglass fabrics market is sustained by its integral role as a reinforcement material, where a high strength-to-weight ratio is paramount. The industry is defined by a diverse range of material types, including woven fiberglass fabric, non-woven fiberglass fabric, and multiaxial fabrics, each offering specific performance benefits.
  • Innovations are centered on enhancing material properties such as corrosion resistance and dimensional stability through advanced formulations like E-glass, S-glass, C-glass, and AR-glass. These are processed into forms like chopped strand mat (CSM) and continuous filament mat (CFM) for various manufacturing techniques. A key boardroom-level consideration is the strategic shift toward thermoplastic composites over traditional thermoset resins.
  • This move directly impacts capital expenditure, as adopting technologies like automated fiber placement and automated tape laying (ATL) for organosheets can reduce manufacturing cycle times by up to 95%. This efficiency gain is crucial for industries requiring high-volume production of fiber reinforced polymer (FRP) components used in applications from printed circuit boards (PCBs) to wind turbine blades and nacelle housings.

What are the Key Data Covered in this Fiberglass Fabrics Market Research and Growth Report?

  • What is the expected growth of the Fiberglass Fabrics Market between 2026 and 2030?

    • USD 3.61 billion, at a CAGR of 8.2%

  • What segmentation does the market report cover?

    • The report is segmented by Application (Construction, Transportation, Electrical and electronics, Wind-energy, and Others), Type (Woven fiberglass fabric, and Non-woven fiberglass fabric), Product Type (E-glass, S-glass, and Others) and Geography (APAC, North America, Europe, South America, Middle East and Africa)

  • Which regions are analyzed in the report?

    • APAC, North America, Europe, South America and Middle East and Africa

  • What are the key growth drivers and market challenges?

    • Sustained growth in global construction and infrastructure sector, Price volatility and margin pressure from raw material and energy costs

  • Who are the major players in the Fiberglass Fabrics Market?

    • 3B the fiberglass Co., AGY Holding Corp., ASAHI FIBER GLASS Co. Ltd., BGF Industries, Central Glass Co. Ltd., China Jushi Co. Ltd., Compagnie Chomarat, Compagnie de Saint Gobain SA, Hexcel Corp., Johns Manville Corp., Nippon Electric Glass Co. Ltd., Owens Corning, P D Glasseiden GmbH Oschatz, Porcher Industries, SAERTEX GmbH and Co.KG, Sinoma Science and Technology Co. Ltd., Taiwan Glass Ind. Corp., ValuTex Reinforcements Inc. and Yuntianhua Group Co. Ltd.

Market Research Insights

  • Market dynamics are shaped by the imperative for advanced material solutions across key sectors. The drive for lightweighting in transportation achieves fuel efficiency improvements of up to 8% through the use of composites in automotive body panels and aerospace interiors.
  • In renewable energy, innovations in wind turbine blade manufacturing contribute to an increased energy capture of over 10% in next-generation designs. For electric mobility, the use of specialized composite battery enclosures enhances thermal runaway containment time by 40%, a critical safety metric.
  • The expansion into advanced air mobility (AAM) and the localization of supply chains for electric vehicle (EV) manufacturing in emerging markets are creating new, high-volume production opportunities. These applications depend on a reliable supply of materials for everything from marine boat hulls and filtration media to geotechnical textiles and scrim fabric uses, underscoring the material's versatility.

We can help! Our analysts can customize this fiberglass fabrics market research report to meet your requirements.

Get in touch

1. Executive Summary

1.1 Market overview

Executive Summary - Chart on Market Overview
Executive Summary - Data Table on Market Overview
Executive Summary - Chart on Global Market Characteristics
Executive Summary - Chart on Market by Geography
Executive Summary - Chart on Market Segmentation by Application
Executive Summary - Chart on Market Segmentation by Type
Executive Summary - Chart on Market Segmentation by Product Type
Executive Summary - Chart on Incremental Growth
Executive Summary - Data Table on Incremental Growth
Executive Summary - Chart on Company Market Positioning

2. Technavio Analysis

2.1 Analysis of price sensitivity, lifecycle, customer purchase basket, adoption rates, and purchase criteria

2.2 Criticality of inputs and Factors of differentiation

Chart on Overview on criticality of inputs and factors of differentiation

2.3 Factors of disruption

Chart on Overview on factors of disruption

2.4 Impact of drivers and challenges

Chart on Impact of drivers and challenges in 2025 and 2030

3. Market Landscape

3.1 Market ecosystem

Chart on Parent Market
Data Table on - Parent Market

3.2 Market characteristics

Chart on Market characteristics analysis

3.3 Value chain analysis

Chart on Value chain analysis

4. Market Sizing

4.1 Market definition

Data Table on Offerings of companies included in the market definition

4.2 Market segment analysis

Market segments

4.3 Market size 2025

4.4 Market outlook: Forecast for 2025-2030

Chart on Global - Market size and forecast 2025-2030 ($ million)
Data Table on Global - Market size and forecast 2025-2030 ($ million)
Chart on Global Market: Year-over-year growth 2025-2030 (%)
Data Table on Global Market: Year-over-year growth 2025-2030 (%)

5. Historic Market Size

5.1 Global Fiberglass Fabrics Market 2020 - 2024

Historic Market Size - Data Table on Global Fiberglass Fabrics Market 2020 - 2024 ($ million)

5.2 Application segment analysis 2020 - 2024

Historic Market Size - Application Segment 2020 - 2024 ($ million)

5.3 Type segment analysis 2020 - 2024

Historic Market Size - Type Segment 2020 - 2024 ($ million)

5.4 Product Type segment analysis 2020 - 2024

Historic Market Size - Product Type Segment 2020 - 2024 ($ million)

5.5 Geography segment analysis 2020 - 2024

Historic Market Size - Geography Segment 2020 - 2024 ($ million)

5.6 Country segment analysis 2020 - 2024

Historic Market Size - Country Segment 2020 - 2024 ($ million)

6. Qualitative Analysis

6.1 The AI impact on global fiberglass fabrics market

7. Five Forces Analysis

7.1 Five forces summary

Five forces analysis - Comparison between 2025 and 2030

7.2 Bargaining power of buyers

Bargaining power of buyers - Impact of key factors 2025 and 2030

7.3 Bargaining power of suppliers

Bargaining power of suppliers - Impact of key factors in 2025 and 2030

7.4 Threat of new entrants

Threat of new entrants - Impact of key factors in 2025 and 2030

7.5 Threat of substitutes

Threat of substitutes - Impact of key factors in 2025 and 2030

7.6 Threat of rivalry

Threat of rivalry - Impact of key factors in 2025 and 2030

7.7 Market condition

Chart on Market condition - Five forces 2025 and 2030

8. Market Segmentation by Application

8.1 Market segments

Chart on Application - Market share 2025-2030 (%)
Data Table on Application - Market share 2025-2030 (%)

8.2 Comparison by Application

Chart on Comparison by Application
Data Table on Comparison by Application

8.3 Construction - Market size and forecast 2025-2030

Chart on Construction - Market size and forecast 2025-2030 ($ million)
Data Table on Construction - Market size and forecast 2025-2030 ($ million)
Chart on Construction - Year-over-year growth 2025-2030 (%)
Data Table on Construction - Year-over-year growth 2025-2030 (%)

8.4 Transportation - Market size and forecast 2025-2030

Chart on Transportation - Market size and forecast 2025-2030 ($ million)
Data Table on Transportation - Market size and forecast 2025-2030 ($ million)
Chart on Transportation - Year-over-year growth 2025-2030 (%)
Data Table on Transportation - Year-over-year growth 2025-2030 (%)

8.5 Electrical and electronics - Market size and forecast 2025-2030

Chart on Electrical and electronics - Market size and forecast 2025-2030 ($ million)
Data Table on Electrical and electronics - Market size and forecast 2025-2030 ($ million)
Chart on Electrical and electronics - Year-over-year growth 2025-2030 (%)
Data Table on Electrical and electronics - Year-over-year growth 2025-2030 (%)

8.6 Wind-energy - Market size and forecast 2025-2030

Chart on Wind-energy - Market size and forecast 2025-2030 ($ million)
Data Table on Wind-energy - Market size and forecast 2025-2030 ($ million)
Chart on Wind-energy - Year-over-year growth 2025-2030 (%)
Data Table on Wind-energy - Year-over-year growth 2025-2030 (%)

8.7 Others - Market size and forecast 2025-2030

Chart on Others - Market size and forecast 2025-2030 ($ million)
Data Table on Others - Market size and forecast 2025-2030 ($ million)
Chart on Others - Year-over-year growth 2025-2030 (%)
Data Table on Others - Year-over-year growth 2025-2030 (%)

8.8 Market opportunity by Application

Market opportunity by Application ($ million)
Data Table on Market opportunity by Application ($ million)

9. Market Segmentation by Type

9.1 Market segments

Chart on Type - Market share 2025-2030 (%)
Data Table on Type - Market share 2025-2030 (%)

9.2 Comparison by Type

Chart on Comparison by Type
Data Table on Comparison by Type

9.3 Woven fiberglass fabric - Market size and forecast 2025-2030

Chart on Woven fiberglass fabric - Market size and forecast 2025-2030 ($ million)
Data Table on Woven fiberglass fabric - Market size and forecast 2025-2030 ($ million)
Chart on Woven fiberglass fabric - Year-over-year growth 2025-2030 (%)
Data Table on Woven fiberglass fabric - Year-over-year growth 2025-2030 (%)

9.4 Non-woven fiberglass fabric - Market size and forecast 2025-2030

Chart on Non-woven fiberglass fabric - Market size and forecast 2025-2030 ($ million)
Data Table on Non-woven fiberglass fabric - Market size and forecast 2025-2030 ($ million)
Chart on Non-woven fiberglass fabric - Year-over-year growth 2025-2030 (%)
Data Table on Non-woven fiberglass fabric - Year-over-year growth 2025-2030 (%)

9.5 Market opportunity by Type

Market opportunity by Type ($ million)
Data Table on Market opportunity by Type ($ million)

10. Market Segmentation by Product Type

10.1 Market segments

Chart on Product Type - Market share 2025-2030 (%)
Data Table on Product Type - Market share 2025-2030 (%)

10.2 Comparison by Product Type

Chart on Comparison by Product Type
Data Table on Comparison by Product Type

10.3 E-glass - Market size and forecast 2025-2030

Chart on E-glass - Market size and forecast 2025-2030 ($ million)
Data Table on E-glass - Market size and forecast 2025-2030 ($ million)
Chart on E-glass - Year-over-year growth 2025-2030 (%)
Data Table on E-glass - Year-over-year growth 2025-2030 (%)

10.4 S-glass - Market size and forecast 2025-2030

Chart on S-glass - Market size and forecast 2025-2030 ($ million)
Data Table on S-glass - Market size and forecast 2025-2030 ($ million)
Chart on S-glass - Year-over-year growth 2025-2030 (%)
Data Table on S-glass - Year-over-year growth 2025-2030 (%)

10.5 Others - Market size and forecast 2025-2030

Chart on Others - Market size and forecast 2025-2030 ($ million)
Data Table on Others - Market size and forecast 2025-2030 ($ million)
Chart on Others - Year-over-year growth 2025-2030 (%)
Data Table on Others - Year-over-year growth 2025-2030 (%)

10.6 Market opportunity by Product Type

Market opportunity by Product Type ($ million)
Data Table on Market opportunity by Product Type ($ million)

11. Customer Landscape

11.1 Customer landscape overview

Analysis of price sensitivity, lifecycle, customer purchase basket, adoption rates, and purchase criteria

12. Geographic Landscape

12.1 Geographic segmentation

Chart on Market share by geography 2025-2030 (%)
Data Table on Market share by geography 2025-2030 (%)

12.2 Geographic comparison

Chart on Geographic comparison
Data Table on Geographic comparison

12.3 APAC - Market size and forecast 2025-2030

Chart on APAC - Market size and forecast 2025-2030 ($ million)
Data Table on APAC - Market size and forecast 2025-2030 ($ million)
Chart on APAC - Year-over-year growth 2025-2030 (%)
Data Table on APAC - Year-over-year growth 2025-2030 (%)
Chart on Regional Comparison - APAC
Data Table on Regional Comparison - APAC

12.3.1 China - Market size and forecast 2025-2030

Chart on China - Market size and forecast 2025-2030 ($ million)
Data Table on China - Market size and forecast 2025-2030 ($ million)
Chart on China - Year-over-year growth 2025-2030 (%)
Data Table on China - Year-over-year growth 2025-2030 (%)

12.3.2 Japan - Market size and forecast 2025-2030

Chart on Japan - Market size and forecast 2025-2030 ($ million)
Data Table on Japan - Market size and forecast 2025-2030 ($ million)
Chart on Japan - Year-over-year growth 2025-2030 (%)
Data Table on Japan - Year-over-year growth 2025-2030 (%)

12.3.3 India - Market size and forecast 2025-2030

Chart on India - Market size and forecast 2025-2030 ($ million)
Data Table on India - Market size and forecast 2025-2030 ($ million)
Chart on India - Year-over-year growth 2025-2030 (%)
Data Table on India - Year-over-year growth 2025-2030 (%)

12.3.4 South Korea - Market size and forecast 2025-2030

Chart on South Korea - Market size and forecast 2025-2030 ($ million)
Data Table on South Korea - Market size and forecast 2025-2030 ($ million)
Chart on South Korea - Year-over-year growth 2025-2030 (%)
Data Table on South Korea - Year-over-year growth 2025-2030 (%)

12.3.5 Australia - Market size and forecast 2025-2030

Chart on Australia - Market size and forecast 2025-2030 ($ million)
Data Table on Australia - Market size and forecast 2025-2030 ($ million)
Chart on Australia - Year-over-year growth 2025-2030 (%)
Data Table on Australia - Year-over-year growth 2025-2030 (%)

12.3.6 Indonesia - Market size and forecast 2025-2030

Chart on Indonesia - Market size and forecast 2025-2030 ($ million)
Data Table on Indonesia - Market size and forecast 2025-2030 ($ million)
Chart on Indonesia - Year-over-year growth 2025-2030 (%)
Data Table on Indonesia - Year-over-year growth 2025-2030 (%)

12.4 North America - Market size and forecast 2025-2030

Chart on North America - Market size and forecast 2025-2030 ($ million)
Data Table on North America - Market size and forecast 2025-2030 ($ million)
Chart on North America - Year-over-year growth 2025-2030 (%)
Data Table on North America - Year-over-year growth 2025-2030 (%)
Chart on Regional Comparison - North America
Data Table on Regional Comparison - North America

12.4.1 US - Market size and forecast 2025-2030

Chart on US - Market size and forecast 2025-2030 ($ million)
Data Table on US - Market size and forecast 2025-2030 ($ million)
Chart on US - Year-over-year growth 2025-2030 (%)
Data Table on US - Year-over-year growth 2025-2030 (%)

12.4.2 Canada - Market size and forecast 2025-2030

Chart on Canada - Market size and forecast 2025-2030 ($ million)
Data Table on Canada - Market size and forecast 2025-2030 ($ million)
Chart on Canada - Year-over-year growth 2025-2030 (%)
Data Table on Canada - Year-over-year growth 2025-2030 (%)

12.4.3 Mexico - Market size and forecast 2025-2030

Chart on Mexico - Market size and forecast 2025-2030 ($ million)
Data Table on Mexico - Market size and forecast 2025-2030 ($ million)
Chart on Mexico - Year-over-year growth 2025-2030 (%)
Data Table on Mexico - Year-over-year growth 2025-2030 (%)

12.5 Europe - Market size and forecast 2025-2030

Chart on Europe - Market size and forecast 2025-2030 ($ million)
Data Table on Europe - Market size and forecast 2025-2030 ($ million)
Chart on Europe - Year-over-year growth 2025-2030 (%)
Data Table on Europe - Year-over-year growth 2025-2030 (%)
Chart on Regional Comparison - Europe
Data Table on Regional Comparison - Europe

12.5.1 Germany - Market size and forecast 2025-2030

Chart on Germany - Market size and forecast 2025-2030 ($ million)
Data Table on Germany - Market size and forecast 2025-2030 ($ million)
Chart on Germany - Year-over-year growth 2025-2030 (%)
Data Table on Germany - Year-over-year growth 2025-2030 (%)

12.5.2 UK - Market size and forecast 2025-2030

Chart on UK - Market size and forecast 2025-2030 ($ million)
Data Table on UK - Market size and forecast 2025-2030 ($ million)
Chart on UK - Year-over-year growth 2025-2030 (%)
Data Table on UK - Year-over-year growth 2025-2030 (%)

12.5.3 France - Market size and forecast 2025-2030

Chart on France - Market size and forecast 2025-2030 ($ million)
Data Table on France - Market size and forecast 2025-2030 ($ million)
Chart on France - Year-over-year growth 2025-2030 (%)
Data Table on France - Year-over-year growth 2025-2030 (%)

12.5.4 Italy - Market size and forecast 2025-2030

Chart on Italy - Market size and forecast 2025-2030 ($ million)
Data Table on Italy - Market size and forecast 2025-2030 ($ million)
Chart on Italy - Year-over-year growth 2025-2030 (%)
Data Table on Italy - Year-over-year growth 2025-2030 (%)

12.5.5 Spain - Market size and forecast 2025-2030

Chart on Spain - Market size and forecast 2025-2030 ($ million)
Data Table on Spain - Market size and forecast 2025-2030 ($ million)
Chart on Spain - Year-over-year growth 2025-2030 (%)
Data Table on Spain - Year-over-year growth 2025-2030 (%)

12.5.6 The Netherlands - Market size and forecast 2025-2030

Chart on The Netherlands - Market size and forecast 2025-2030 ($ million)
Data Table on The Netherlands - Market size and forecast 2025-2030 ($ million)
Chart on The Netherlands - Year-over-year growth 2025-2030 (%)
Data Table on The Netherlands - Year-over-year growth 2025-2030 (%)

12.6 South America - Market size and forecast 2025-2030

Chart on South America - Market size and forecast 2025-2030 ($ million)
Data Table on South America - Market size and forecast 2025-2030 ($ million)
Chart on South America - Year-over-year growth 2025-2030 (%)
Data Table on South America - Year-over-year growth 2025-2030 (%)
Chart on Regional Comparison - South America
Data Table on Regional Comparison - South America

12.6.1 Brazil - Market size and forecast 2025-2030

Chart on Brazil - Market size and forecast 2025-2030 ($ million)
Data Table on Brazil - Market size and forecast 2025-2030 ($ million)
Chart on Brazil - Year-over-year growth 2025-2030 (%)
Data Table on Brazil - Year-over-year growth 2025-2030 (%)

12.6.2 Argentina - Market size and forecast 2025-2030

Chart on Argentina - Market size and forecast 2025-2030 ($ million)
Data Table on Argentina - Market size and forecast 2025-2030 ($ million)
Chart on Argentina - Year-over-year growth 2025-2030 (%)
Data Table on Argentina - Year-over-year growth 2025-2030 (%)

12.6.3 Chile - Market size and forecast 2025-2030

Chart on Chile - Market size and forecast 2025-2030 ($ million)
Data Table on Chile - Market size and forecast 2025-2030 ($ million)
Chart on Chile - Year-over-year growth 2025-2030 (%)
Data Table on Chile - Year-over-year growth 2025-2030 (%)

12.7 Middle East and Africa - Market size and forecast 2025-2030

Chart on Middle East and Africa - Market size and forecast 2025-2030 ($ million)
Data Table on Middle East and Africa - Market size and forecast 2025-2030 ($ million)
Chart on Middle East and Africa - Year-over-year growth 2025-2030 (%)
Data Table on Middle East and Africa - Year-over-year growth 2025-2030 (%)
Chart on Regional Comparison - Middle East and Africa
Data Table on Regional Comparison - Middle East and Africa

12.7.1 Saudi Arabia - Market size and forecast 2025-2030

Chart on Saudi Arabia - Market size and forecast 2025-2030 ($ million)
Data Table on Saudi Arabia - Market size and forecast 2025-2030 ($ million)
Chart on Saudi Arabia - Year-over-year growth 2025-2030 (%)
Data Table on Saudi Arabia - Year-over-year growth 2025-2030 (%)

12.7.2 UAE - Market size and forecast 2025-2030

Chart on UAE - Market size and forecast 2025-2030 ($ million)
Data Table on UAE - Market size and forecast 2025-2030 ($ million)
Chart on UAE - Year-over-year growth 2025-2030 (%)
Data Table on UAE - Year-over-year growth 2025-2030 (%)

12.7.3 South Africa - Market size and forecast 2025-2030

Chart on South Africa - Market size and forecast 2025-2030 ($ million)
Data Table on South Africa - Market size and forecast 2025-2030 ($ million)
Chart on South Africa - Year-over-year growth 2025-2030 (%)
Data Table on South Africa - Year-over-year growth 2025-2030 (%)

12.7.4 Israel - Market size and forecast 2025-2030

Chart on Israel - Market size and forecast 2025-2030 ($ million)
Data Table on Israel - Market size and forecast 2025-2030 ($ million)
Chart on Israel - Year-over-year growth 2025-2030 (%)
Data Table on Israel - Year-over-year growth 2025-2030 (%)

12.7.5 Turkey - Market size and forecast 2025-2030

Chart on Turkey - Market size and forecast 2025-2030 ($ million)
Data Table on Turkey - Market size and forecast 2025-2030 ($ million)
Chart on Turkey - Year-over-year growth 2025-2030 (%)
Data Table on Turkey - Year-over-year growth 2025-2030 (%)

12.8 Market opportunity by geography

Market opportunity by geography ($ million)
Data Tables on Market opportunity by geography ($ million)

13. Drivers, Challenges, and Opportunity

13.1 Market drivers

Sustained growth in global construction and infrastructure sector
Imperative for lightweighting and fuel efficiency in transportation sector
Rapid expansion of global wind energy sector

13.2 Market challenges

Price volatility and margin pressure from raw material and energy costs
Increasing competition from alternative and advanced materials
Stringent environmental regulations and growing sustainability concerns

13.3 Impact of drivers and challenges

Impact of drivers and challenges in 2025 and 2030

13.4 Market opportunities

Growing prominence of thermoplastics and compatible fabrics
Development and adoption of hybrid composite fabrics
Integration of digitalization and automation in composite manufacturing

14. Competitive Landscape

14.1 Overview

14.2

Overview on criticality of inputs and factors of differentiation

14.3 Landscape disruption

Overview on factors of disruption

14.4 Industry risks

Impact of key risks on business

15. Competitive Analysis

15.1 Companies profiled

Companies covered

15.2 Company ranking index

15.3 Market positioning of companies

Matrix on companies position and classification

15.4 3B the fiberglass Co.

3B the fiberglass Co. - Overview
3B the fiberglass Co. - Product / Service
3B the fiberglass Co. - Key offerings
SWOT

15.5 AGY Holding Corp.

AGY Holding Corp. - Overview
AGY Holding Corp. - Product / Service
AGY Holding Corp. - Key offerings
SWOT

15.6 ASAHI FIBER GLASS Co. Ltd.

ASAHI FIBER GLASS Co. Ltd. - Overview
ASAHI FIBER GLASS Co. Ltd. - Product / Service
ASAHI FIBER GLASS Co. Ltd. - Key offerings
SWOT

15.7 BGF Industries

BGF Industries - Overview
BGF Industries - Product / Service
BGF Industries - Key offerings
SWOT

15.8 Central Glass Co. Ltd.

Central Glass Co. Ltd. - Overview
Central Glass Co. Ltd. - Business segments
Central Glass Co. Ltd. - Key offerings
Central Glass Co. Ltd. - Segment focus
SWOT

15.9 China Jushi Co. Ltd.

China Jushi Co. Ltd. - Overview
China Jushi Co. Ltd. - Product / Service
China Jushi Co. Ltd. - Key offerings
SWOT

15.10 Compagnie de Saint Gobain SA

Compagnie de Saint Gobain SA - Overview
Compagnie de Saint Gobain SA - Business segments
Compagnie de Saint Gobain SA - Key news
Compagnie de Saint Gobain SA - Key offerings
Compagnie de Saint Gobain SA - Segment focus
SWOT

15.11 Hexcel Corp.

Hexcel Corp. - Overview
Hexcel Corp. - Business segments
Hexcel Corp. - Key news
Hexcel Corp. - Key offerings
Hexcel Corp. - Segment focus
SWOT

15.12 Johns Manville Corp.

Johns Manville Corp. - Overview
Johns Manville Corp. - Product / Service
Johns Manville Corp. - Key offerings
SWOT

15.13 Nippon Electric Glass Co. Ltd.

Nippon Electric Glass Co. Ltd. - Overview
Nippon Electric Glass Co. Ltd. - Product / Service
Nippon Electric Glass Co. Ltd. - Key offerings
SWOT

15.14 Owens Corning

Owens Corning - Overview
Owens Corning - Business segments
Owens Corning - Key news
Owens Corning - Key offerings
Owens Corning - Segment focus
SWOT

15.15 Porcher Industries

Porcher Industries - Overview
Porcher Industries - Product / Service
Porcher Industries - Key offerings
SWOT

15.16 SAERTEX GmbH and Co.KG

SAERTEX GmbH and Co.KG - Overview
SAERTEX GmbH and Co.KG - Product / Service
SAERTEX GmbH and Co.KG - Key offerings
SWOT

15.17 Sinoma Science and Technology Co. Ltd.

Sinoma Science and Technology Co. Ltd. - Overview
Sinoma Science and Technology Co. Ltd. - Product / Service
Sinoma Science and Technology Co. Ltd. - Key offerings
SWOT

15.18 Taiwan Glass Ind. Corp.

Taiwan Glass Ind. Corp. - Overview
Taiwan Glass Ind. Corp. - Business segments
Taiwan Glass Ind. Corp. - Key offerings
Taiwan Glass Ind. Corp. - Segment focus
SWOT

16. Appendix

16.1 Scope of the report

Market definition
Objectives
Notes and caveats

16.2 Inclusions and exclusions checklist

Inclusions checklist
Exclusions checklist

16.3 Currency conversion rates for US$

16.4 Research methodology

16.5 Data procurement

Information sources

16.6 Data validation

16.7 Validation techniques employed for market sizing

16.8 Data synthesis

16.9 360 degree market analysis

16.10 List of abbreviations

Research Methodology

Technavio presents a detailed picture of the market by way of study, synthesis, and summation of data from multiple sources. The analysts have presented the various facets of the market with a particular focus on identifying the key industry influencers. The data thus presented is comprehensive, reliable, and the result of extensive research, both primary and secondary.

INFORMATION SOURCES

Primary sources

  • Manufacturers and suppliers
  • Channel partners
  • Industry experts
  • Strategic decision makers

Secondary sources

  • Industry journals and periodicals
  • Government data
  • Financial reports of key industry players
  • Historical data
  • Press releases

DATA ANALYSIS

Data Synthesis

  • Collation of data
  • Estimation of key figures
  • Analysis of derived insights

Data Validation

  • Triangulation with data models
  • Reference against proprietary databases
  • Corroboration with industry experts

REPORT WRITING

Qualitative

  • Market drivers
  • Market challenges
  • Market trends
  • Five forces analysis

Quantitative

  • Market size and forecast
  • Market segmentation
  • Geographical insights
  • Competitive landscape

Interested in this report?

Get your sample now to see our research methodology and insights!

Download Now

Frequently Asked Questions

Fiberglass Fabrics market growth will increase by USD 3614.7 million during 2026-2030 .

The Fiberglass Fabrics market is expected to grow at a CAGR of 8.2% during 2026-2030 .

Fiberglass Fabrics market is segmented by Application (Construction, Transportation, Electrical and electronics, Wind-energy, Others) Type (Woven fiberglass fabric, Non-woven fiberglass fabric) Product type (E-glass, S-glass, Others)

3B the fiberglass Co., AGY Holding Corp., ASAHI FIBER GLASS Co. Ltd., BGF Industries, Central Glass Co. Ltd., China Jushi Co. Ltd., Compagnie Chomarat, Compagnie de Saint Gobain SA, Hexcel Corp., Johns Manville Corp., Nippon Electric Glass Co. Ltd., Owens Corning, P D Glasseiden GmbH Oschatz, Porcher Industries, SAERTEX GmbH and Co.KG, Sinoma Science and Technology Co. Ltd., Taiwan Glass Ind. Corp., ValuTex Reinforcements Inc., Yuntianhua Group Co. Ltd. are a few of the key vendors in the Fiberglass Fabrics market.

APAC will register the highest growth rate of 37.8% among the other regions. Therefore, the Fiberglass Fabrics market in APAC is expected to garner significant business opportunities for the vendors during the forecast period.

China, Japan, India, South Korea, Australia, Indonesia, US, Canada, Mexico, Germany, UK, France, Italy, Spain, The Netherlands, Brazil, Argentina, Chile, Saudi Arabia, UAE, South Africa, Israel, Turkey

  • Sustained growth in global construction and infrastructure sector is the driving factor this market.

The Fiberglass Fabrics market vendors should focus on grabbing business opportunities from the Application segment as it accounted for the largest market share in the base year.