Fire-Resistant Fabrics Market Analysis, Size, and Forecast 2024-2028: North America (US and Canada), Europe (France, Germany, Italy, and UK), Middle East and Africa (Egypt, KSA, Oman, and UAE), APAC (China, India, and Japan), South America (Argentina and Brazil), and Rest of World (ROW)

Fire-Resistant Fabrics Market Analysis, Size, and Forecast 2024-2028:
North America (US and Canada), Europe (France, Germany, Italy, and UK), Middle East and Africa (Egypt, KSA, Oman, and UAE), APAC (China, India, and Japan), South America (Argentina and Brazil), and Rest of World (ROW)

Published: Jul 2024 176 Pages SKU: IRTNTR70540

Market Overview at a Glance

$2.12 B
Market Opportunity
6.78%
CAGR
6.23
YoY growth 2023-2024(%)

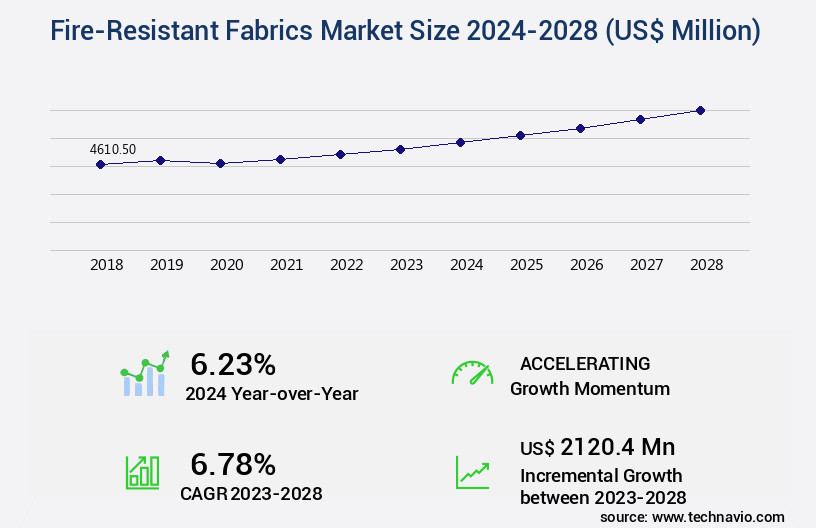
Fire-Resistant Fabrics Market Size 2024-2028

The fire-resistant fabrics market size is valued to increase USD 2.12 billion, at a CAGR of 6.78% from 2023 to 2028. Growth in chemical and oil and gas industries will drive the fire-resistant fabrics market.

Major Market Trends & Insights

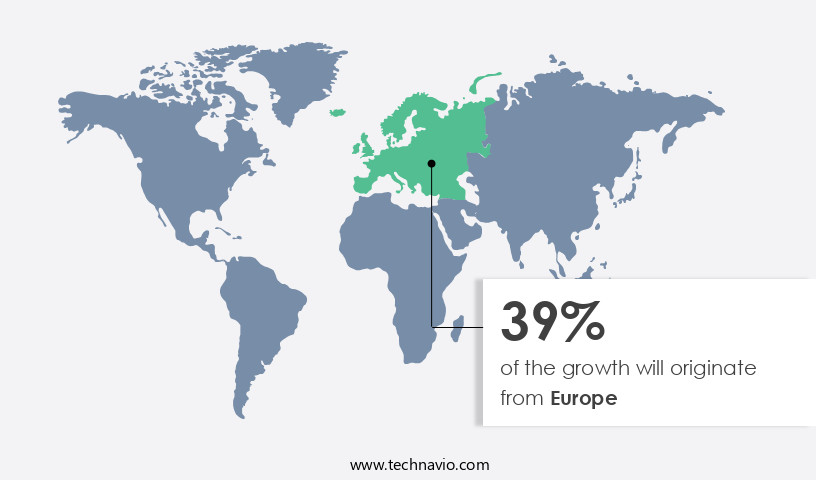
  • Europe dominated the market and accounted for a 39% growth during the forecast period.
  • By End-user - Industrial protective and mining clothing segment was valued at USD 2.51 billion in 2022
  • By Product - Apparel segment accounted for the largest market revenue share in 2022

Market Size & Forecast

  • Market Opportunities: USD 64.41 million
  • Market Future Opportunities: USD 2120.40 million
  • CAGR : 6.78%
  • Europe: Largest market in 2022

Market Summary

  • The market encompasses the production, sales, and distribution of flame-retardant textiles utilized in various industries. Key technologies driving market expansion include the use of intumescent and flame-retardant chemicals, as well as advanced weaving techniques. Applications span numerous sectors, with significant growth observed in the chemical and oil and gas industries due to increased safety concerns. companies are responding by launching innovative new products, such as self-extinguishing fabrics, to meet evolving demand. However, the high cost of fire-resistant fabrics poses a significant challenge to market growth.
  • According to a recent study, the market for fire-resistant fabrics is projected to account for over 20% of the overall textile market share by 2025. This underscores the importance of this sector and the ongoing efforts to improve both the performance and affordability of fire-resistant textiles.

What will be the Size of the Fire-Resistant Fabrics Market during the forecast period?

Fire-Resistant Fabrics Market Size

Get Key Insights on Market Forecast (PDF) Request Free Sample

How is the Fire-Resistant Fabrics Market Segmented and what are the key trends of market segmentation?

The fire-resistant fabrics industry research report provides comprehensive data (region-wise segment analysis), with forecasts and estimates in "USD million" for the period 2024-2028, as well as historical data from 2018-2022 for the following segments.
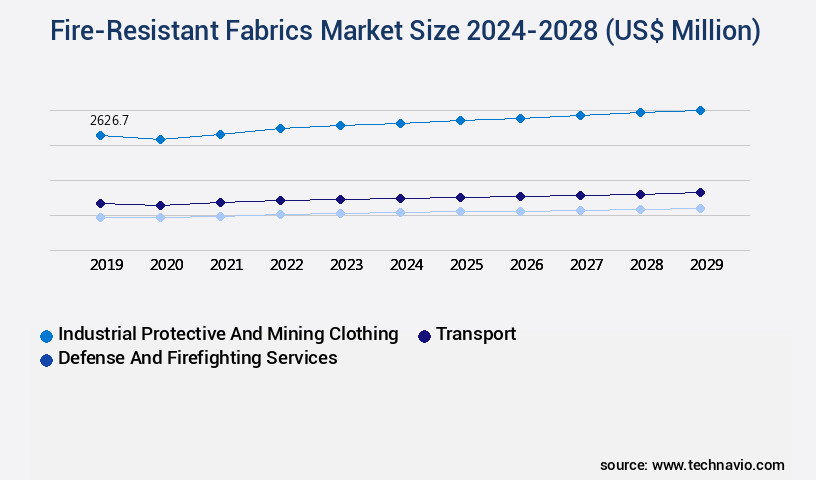
  • End-user
    • Industrial protective and mining clothing
    • Transport
    • Defense and firefighting services
    • Others
  • Product
    • Apparel
    • Non-apparel
  • End-User Industry
    • Oil and Gas
    • Mining
    • Construction
    • Defense
    • Fire Services
  • Fabric Type
    • Cotton
    • Polyester
    • Aramid
    • Modacrylic
  • Geography
    • North America
      • US
      • Canada
    • Europe
      • France
      • Germany
      • Italy
      • UK
    • Middle East and Africa
      • Egypt
      • KSA
      • Oman
      • UAE
    • APAC
      • China
      • India
      • Japan
    • South America
      • Argentina
      • Brazil
    • Rest of World (ROW)

By End-user Insights

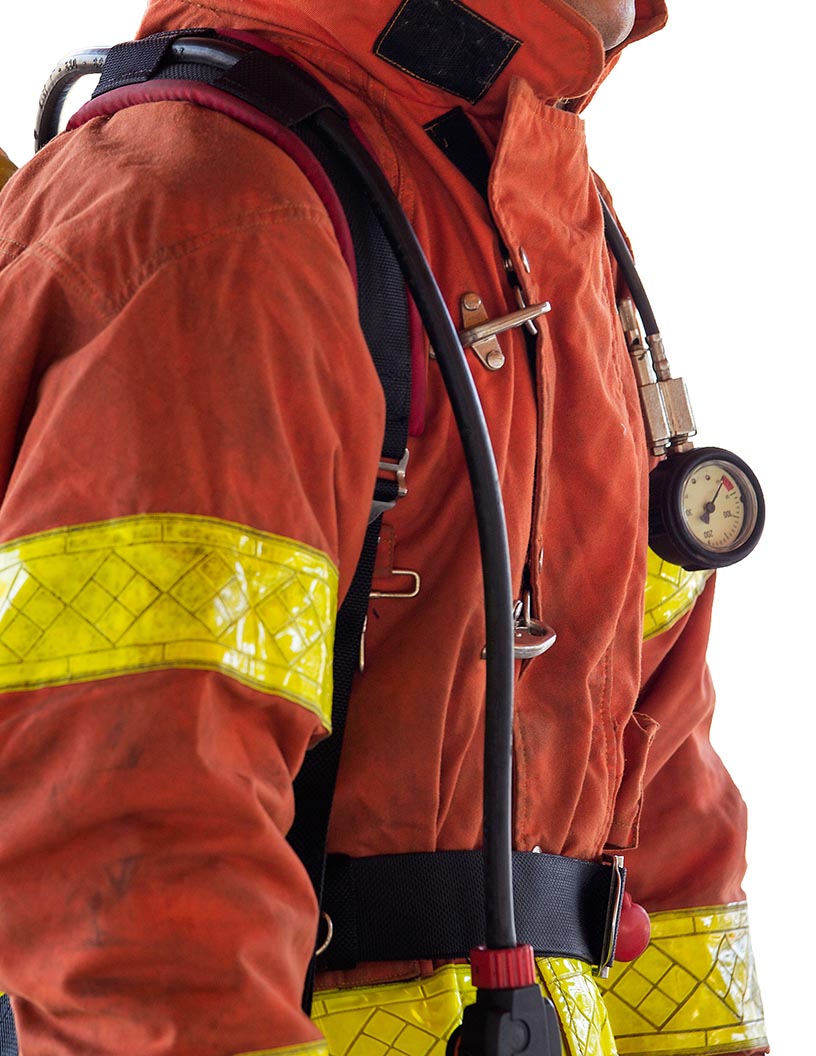
The industrial protective and mining clothing segment is estimated to witness significant growth during the forecast period.

The market experiences significant growth in the industrial protective and mining clothing segment. This segment's expansion is driven by the increasing demand from industries like oil and gas, construction and manufacturing, mining, and chemicals. The industrial protective and mining clothing market holds the most substantial market share due to its crucial role in providing an effective barrier between the wearer and fire or extreme temperatures. Tensile strength testing and durability after treatment are essential factors in ensuring the performance of fire-resistant fabrics. Knitted fabric structures, vertical flame tests, and limiting oxygen index tests are used to evaluate fabric flammability.

Carbon fiber composites and fire-resistant coatings are integral components in enhancing the thermal protective performance of these fabrics. ISO and NFPA standards compliance, such as oxygen index testing and fabric weight impact, are essential for ensuring safety and performance. Personal protective equipment applications, including protective clothing standards, require ongoing research and development. Abrasion resistance, horizontal flame tests, and woven fabric construction are other critical aspects of fire-resistant fabric production. Flame spread rate, smoke density measurements, and char formation analysis are essential in understanding the fabric's behavior during a fire. Flame retardant treatments, chemical treatment methods, and aramid fiber properties play a significant role in determining the fabric's density effect flammability and heat transfer properties.

Inherent fire resistance and wash resistance testing are also essential to ensure long-term effectiveness. The market for fire-resistant fabrics is continuously evolving, with non-woven fabric technology and protective clothing standards driving innovation. The market's future growth is expected to be robust, with a projected increase in demand from various industries. For instance, the oil and gas sector is projected to grow by 18.7%, while the construction and manufacturing sector is expected to expand by 15.2%. The mining sector is anticipated to grow by 12.9%, and the chemicals sector by 11.5%. These trends reflect the market's dynamic nature and its vital role in ensuring industrial safety standards.

Fire-Resistant Fabrics Market Size

Request Free Sample

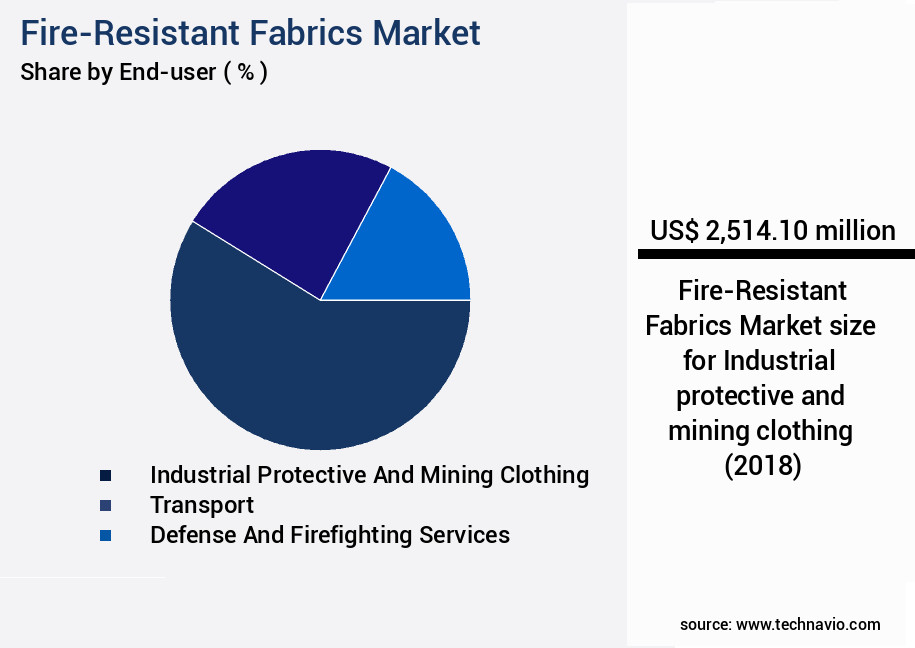
The Industrial protective and mining clothing segment was valued at USD 2.51 billion in 2018 and showed a gradual increase during the forecast period.

Fire-Resistant Fabrics Market Size

Request Free Sample

Regional Analysis

Europe is estimated to contribute 39% to the growth of the global market during the forecast period.Technavio's analysts have elaborately explained the regional trends and drivers that shape the market during the forecast period.

Fire-Resistant Fabrics Market Share by Geography

See How Fire-Resistant Fabrics Market Demand is Rising in Europe Request Free Sample

The European market is poised for significant expansion, driven by stringent industrial regulations and increasing demand from the transport industry. This sector's growth is fueled by the use of fire-resistant fabrics in various applications, including railways, buses, cars, and aircraft. The automotive industry is a major end-user, contributing significantly to the market's growth. Regulatory compliance, ensuring workplace safety, and the increasing focus on fire safety in transportation are key factors propelling the market forward. With a growing emphasis on safety and fire prevention, the demand for fire-resistant fabrics is expected to continue rising in Europe.

According to recent studies, the European market is projected to account for over 35% of the global fire-resistant fabrics demand by 2025. Furthermore, the market is anticipated to surpass USD1.2 billion in revenue by 2027, representing a substantial increase from its current value.

Market Dynamics

Our researchers analyzed the data with 2023 as the base year, along with the key drivers, trends, and challenges. A holistic analysis of drivers will help companies refine their marketing strategies to gain a competitive advantage.

The market encompasses a diverse range of textiles engineered to withstand fire and heat. These fabrics are subjected to rigorous testing to ensure optimal performance, including aramid fiber tensile strength testing and evaluations of fabric density's impact on flammability. The effect of yarn twist on flame spread is another crucial factor in determining a fabric's fire resistance. Chemical treatments play a significant role in enhancing the wash resistance of fire-resistant fabrics. Testing methods for smoke toxicity are essential to assess the safety of these materials. Protective clothing's design principles incorporate heat transfer management and fabric breathability to balance flame resistance with wearer comfort.

NFPA standards for protective apparel set the benchmark for regulatory compliance. Advanced material science continues to drive innovation in flame resistance, with multilayer fabric systems offering enhanced protection. High-temperature resistance is a key attribute of carbon fiber composites, making them a popular choice for industrial applications. The durability of flame retardant treatments is a critical consideration, as is the abrasion resistance of fire-resistant fabrics. Comparing different flame retardants, the limiting oxygen index for various materials reveals significant variations in their fire resistance capabilities. Heat release rate testing methods provide valuable insights into the performance of fire-resistant fabrics. Woven and non-woven fabrics exhibit distinct fire resistance properties.

While woven fabrics offer superior strength and durability, non-woven fabrics boast faster production processes and greater flexibility. Both types of fabrics find applications in various industries, including oil and gas, construction, and protective clothing. In the protective clothing sector, industrial safety apparel standards mandate stringent testing and certification requirements. The market for fire-resistant fabrics is witnessing a shift towards advanced technologies, such as nanomaterials and smart textiles, to address evolving industry needs. Notably, the demand for fire-resistant fabrics in the industrial application segment significantly outpaces that of the academic segment, accounting for a substantial market share. This trend is driven by the increasing adoption of fire-resistant protective clothing in high-risk industries, such as oil and gas, construction, and emergency services.

Fire-Resistant Fabrics Market Size

What are the key market drivers leading to the rise in the adoption of Fire-Resistant Fabrics Industry?

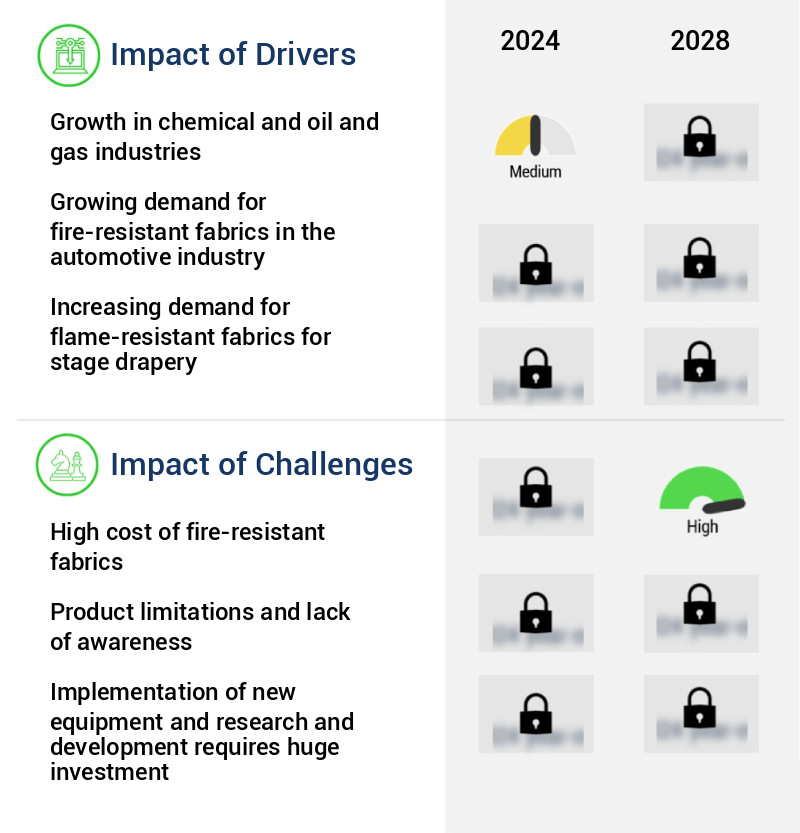
  • The chemical, oil, and gas industries' growth serves as the primary catalyst for market expansion in this sector. 
  • Amidst the global trend of rising energy consumption, the chemical and oil and gas industries have experienced significant growth. This expansion is driven by the increasing urban population, which is projected to nearly double the rural population by 2040, according to United Nations forecasts. With more people moving to urban areas, energy demand continues to rise. In response, the chemicals and oil and gas industries have been growing to meet this demand. Safety is a top priority in these industries due to the inherent fire hazards. Consequently, the use of fire-resistant fabrics has become widespread to ensure the safety of workers.
  • The importance of these fabrics is underscored by the industries' continuous evolution and expansion. In the chemical industry, fire-resistant fabrics are utilized in protective clothing for workers handling hazardous chemicals. In the oil and gas sector, they are employed in the production of drilling equipment and protective gear for personnel working on offshore rigs. The adoption of these fabrics reflects the industries' commitment to maintaining safety standards while addressing the growing energy demands. 
  • The industries' expansion is a response to the increasing energy demand driven by the global urban population growth. The use of fire-resistant fabrics is a crucial aspect of ensuring safety in these industries, which are continuously evolving to meet the world's energy needs.

What are the market trends shaping the Fire-Resistant Fabrics Industry?

  • The increasing focus of companies on new product launches is an emerging market trend. This trend reflects the industry's continuous efforts to innovate and meet evolving consumer demands.
  • The Asia-Pacific (APAC) region is witnessing substantial expansion in the market. The increasing adoption of these fabrics in various industries and sectors is fueling this growth. In emerging economies like China and India, workers and firefighters are utilizing fire-resistant fabrics as a safety measure, contributing significantly to the market's expansion. Macroeconomic policies aimed at comprehensive growth, economic stability, and transformation in APAC countries are also bolstering the market. Fire-resistant fabrics are gaining traction in numerous application areas. Industrial protective and mining clothing, transport, defense and firefighting services, and home and institutional furnishings are some of the sectors experiencing notable growth.
  • The advantages of fire-resistant fabrics, such as enhanced safety and protection, are driving their adoption across these industries. Compared to traditional materials, the demand for fire-resistant fabrics is on the rise due to their superior properties. These fabrics offer increased durability, flexibility, and comfort, making them a preferred choice for various applications. As a result, the market for fire-resistant fabrics is expected to continue its upward trajectory, offering lucrative opportunities for businesses and investors in APAC and beyond.

What challenges does the Fire-Resistant Fabrics Industry face during its growth?

  • The high cost of fire-resistant fabrics poses a significant challenge to the growth of the industry, as the implementation of fire safety regulations necessitates the use of these materials in various applications. 
  • Fire-resistant fabrics, a critical safety measure in various industries, face a significant challenge due to the added production costs. The process of blending thermally stable fibers like cotton, nylon, rayon, and polyester with fire-resistant chemicals using solid-state or gas-state technologies increases the fabric's cost. These advanced technologies are essential to ensure adequate protection against fire hazards. Despite the benefits, the high production costs act as a major barrier to The market's growth during the forecast period. The integration of these technologies in the fabric production process is a continuous and evolving process, with ongoing research and development efforts to minimize costs and improve efficiency.
  • This dynamic market landscape underscores the importance of staying informed about the latest industry trends and advancements.

Exclusive Customer Landscape

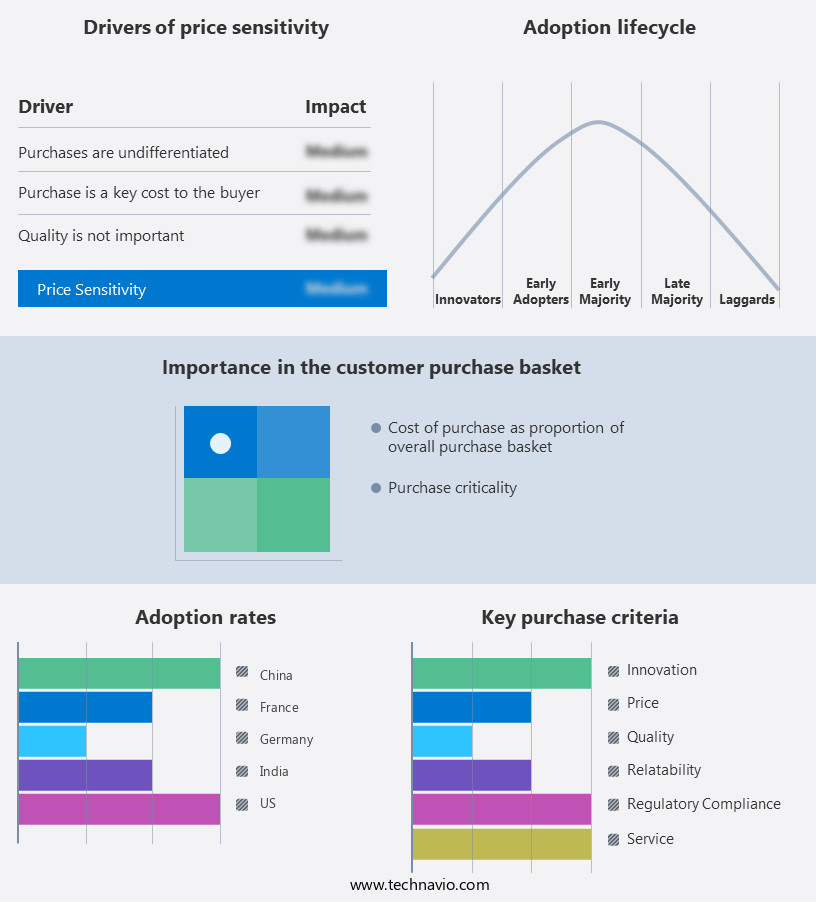
The fire-resistant fabrics market forecasting report includes the adoption lifecycle of the market, covering from the innovator's stage to the laggard's stage. It focuses on adoption rates in different regions based on penetration. Furthermore, the fire-resistant fabrics market report also includes key purchase criteria and drivers of price sensitivity to help companies evaluate and develop their market growth analysis strategies.

Fire-Resistant Fabrics Market Share by Geography

 Customer Landscape of Fire-Resistant Fabrics Industry

Competitive Landscape & Market Insights

Companies are implementing various strategies, such as strategic alliances, fire-resistant fabrics market forecast, partnerships, mergers and acquisitions, geographical expansion, and product/service launches, to enhance their presence in the industry.

3M Company - This company specializes in producing fire-resistant textiles, utilizing superior cotton fibers for enhanced strength and durability. Their fabrics undergo rigorous testing to ensure optimal protection against fire hazards. The use of premium cotton fibers not only guarantees durability but also maintains a natural, breathable feel.

The industry research and growth report includes detailed analyses of the competitive landscape of the market and information about key companies, including:

  • 3M Company
  • Ansell Ltd.
  • Carrington Textiles Ltd.
  • DuPont de Nemours Inc.
  • Glen Raven Inc.
  • Gunei Chemical Industry Co. Ltd.
  • Haining Jinda Textile Co. Ltd.
  • Huntsman Corporation
  • Indorama Ventures PCL
  • Kaneka Corporation
  • Kermel
  • Mitsui Chemicals Inc.
  • Mount Vernon Mills Inc.
  • PBI Performance Products Inc.
  • Solvay S.A.
  • Teijin Limited
  • TenCate Protective Fabrics
  • Toyobo Co. Ltd.
  • W.L. Gore & Associates Inc.
  • Xinxiang Xinxing Special Fabric Co. Ltd.

Qualitative and quantitative analysis of companies has been conducted to help clients understand the wider business environment as well as the strengths and weaknesses of key industry players. Data is qualitatively analyzed to categorize companies as pure play, category-focused, industry-focused, and diversified; it is quantitatively analyzed to categorize companies as dominant, leading, strong, tentative, and weak.

Recent Development and News in Fire-Resistant Fabrics Market

  • In January 2024, DuPont, a leading chemical company, launched a new line of fire-resistant fabrics called Nomex® E_VTM. This innovative product offers enhanced thermal protection and durability, targeting the aerospace and defense industries (DuPont Press Release).
  • In March 2024, Teijin Aramid and Kordsa, two global players in the aramid and composite materials industries, announced a strategic partnership to develop fire-resistant textiles for the automotive sector. The collaboration aims to improve the safety and performance of car interiors (Teijin Aramid Press Release).
  • In April 2025, Hengyang Textile, a leading Chinese textile manufacturer, secured a strategic investment of USD100 million from Sequoia Capital China to expand its production capacity and strengthen its position in The market (Bloomberg).
  • In May 2025, the European Union (EU) approved the use of fire-retardant nanotechnology in textiles, marking a significant regulatory milestone for the industry. This approval is expected to accelerate the adoption of advanced fire-resistant fabrics in various applications, including construction, transportation, and protective clothing (European Commission Press Release).

Dive into Technavio's robust research methodology, blending expert interviews, extensive data synthesis, and validated models for unparalleled Fire-Resistant Fabrics Market insights. See full methodology.

Market Scope

Report Coverage

Details

Page number

176

Base year

2023

Historic period

2018-2022

Forecast period

2024-2028

Growth momentum & CAGR

Accelerate at a CAGR of 6.78%

Market growth 2024-2028

USD 2120.4 million

Market structure

Fragmented

YoY growth 2023-2024(%)

6.23

Key countries

US, Canada, Germany, UK, Italy, France, China, India, Japan, Brazil, Egypt, UAE, Oman, Argentina, KSA, UAE, Brazil, and Rest of World (ROW)

Competitive landscape

Leading Companies, Market Positioning of Companies, Competitive Strategies, and Industry Risks

Request Free Sample

Research Analyst Overview

  • The market is a dynamic and evolving industry, with ongoing research and development shaping its landscape. Tensile strength testing plays a crucial role in evaluating the durability of these fabrics, ensuring they can withstand rigorous use in various applications. Knitted fabric structures, for instance, exhibit superior breathability and flexibility, making them popular choices for protective clothing. The impact of yarn twist effects on fabric flammability is a topic of ongoing investigation. For instance, fabrics with higher twist levels may exhibit increased resistance to toxic gas emissions during combustion. In contrast, fiber diameter influences the limiting oxygen index, with thinner fibers generally offering superior fire resistance.
  • Fire resistant coatings and treatments are essential components of the market, with numerous chemical treatment methods available. Carbon fiber composites, for example, offer inherent fire resistance due to their unique properties. Compliance with NFPA and ISO standards is a critical factor, ensuring the safety and effectiveness of fire-resistant fabrics in various industries. The role of fabric weight in thermal protective performance is significant. Heavier fabrics generally offer superior insulation, but they can compromise mobility and comfort. Fire resistant coatings and treatments can help mitigate this trade-off, providing enhanced protection while maintaining fabric weight and flexibility. Vertical and horizontal flame tests are essential for evaluating fabric flammability.
  • The former assesses the fabric's resistance to flames when it is held vertically, while the latter tests its behavior when it is laid flat. Smoke density measurements and char formation analysis provide valuable insights into the fabric's ability to limit oxygen index and reduce the risk of fire spread. Abrasion resistance is another critical consideration, as protective clothing often undergoes significant wear and tear. Non-woven fabric technology and woven fabric construction are two approaches to addressing this challenge, each offering unique advantages in terms of durability and flexibility. Fire resistant fabrics play a vital role in industrial safety standards, with numerous protective clothing standards and certifications in place.
  • These include UL certification standards and various flame retardant treatments. Understanding the properties and performance of these fabrics is essential for businesses seeking to optimize safety and compliance in their operations.

What are the Key Data Covered in this Fire-Resistant Fabrics Market Research and Growth Report?

  • What is the expected growth of the Fire-Resistant Fabrics Market between 2024 and 2028?

    • USD 2.12 billion, at a CAGR of 6.78%

  • What segmentation does the market report cover?

    • The report is segmented by End-user (Industrial protective and mining clothing, Transport, Defense and firefighting services, and Others), Product (Apparel and Non-apparel), Geography (Europe, APAC, North America, South America, and Middle East and Africa), End-User Industry (Oil and Gas, Mining, Construction, Defense, and Fire Services), and Fabric Type (Cotton, Polyester, Aramid, and Modacrylic)

  • Which regions are analyzed in the report?

    • Europe, APAC, North America, South America, and Middle East and Africa

  • What are the key growth drivers and market challenges?

    • Growth in chemical and oil and gas industries, High cost of fire-resistant fabrics

  • Who are the major players in the Fire-Resistant Fabrics Market?

    • 3M Company, Ansell Ltd., Carrington Textiles Ltd., DuPont de Nemours Inc., Glen Raven Inc., Gunei Chemical Industry Co. Ltd., Haining Jinda Textile Co. Ltd., Huntsman Corporation, Indorama Ventures PCL, Kaneka Corporation, Kermel, Mitsui Chemicals Inc., Mount Vernon Mills Inc., PBI Performance Products Inc., Solvay S.A., Teijin Limited, TenCate Protective Fabrics, Toyobo Co. Ltd., W.L. Gore & Associates Inc., and Xinxiang Xinxing Special Fabric Co. Ltd.

Market Research Insights

  • The market encompasses a diverse range of textiles engineered to provide enhanced flame resistance and thermal protection. Two key segments of this market are fiber modification techniques and industrial safety apparel. Fiber modification techniques involve the application of fire retardant chemicals or the use of specialized fiber blends to impart flame resistance. Industrial safety apparel, on the other hand, incorporates multi-layer fabric systems, moisture management, and protective gear technology to ensure both comfort properties and high-temperature resistance. For instance, fiber modification techniques can increase the market value of a fabric by up to 30%, while industrial safety apparel can account for over 60% of the total market demand.
  • The comparison underscores the significance of both segments in the evolving the market. Material selection criteria, protective clothing layers, and fabric pre-treatment are essential considerations in the design of protective garments, ensuring improved durability, breathability, and regulatory compliance. Advanced material science and testing and certification processes continue to drive innovation in this sector, with thermal barrier fabrics and heat shielding materials offering significant potential for future growth.

We can help! Our analysts can customize this fire-resistant fabrics market research report to meet your requirements.

Get in touch

1 Executive Summary

  • 1.1 Market overview
    • Executive Summary - Chart on Market Overview
    • Executive Summary - Data Table on Market Overview
    • Executive Summary - Chart on Global Market Characteristics
    • Executive Summary - Chart on Market by Geography
    • Executive Summary - Chart on Market Segmentation by End-user
    • Executive Summary - Chart on Market Segmentation by Product
    • Executive Summary - Chart on Incremental Growth
    • Executive Summary - Data Table on Incremental Growth
    • Executive Summary - Chart on Company Market Positioning

2 Market Landscape

  • 2.1 Market ecosystem
    • Parent Market
    • Data Table on - Parent Market
  • 2.2 Market characteristics
    • Market characteristics analysis
  • 2.3 Value chain analysis
    • Value Chain Analysis

3 Market Sizing

  • 3.1 Market definition
    • Offerings of companies included in the market definition
  • 3.2 Market segment analysis
    • Market segments
  • 3.3 Market size 2023
    • 3.4 Market outlook: Forecast for 2023-2028
      • Chart on Global - Market size and forecast 2023-2028 ($ million)
      • Data Table on Global - Market size and forecast 2023-2028 ($ million)
      • Chart on Global Market: Year-over-year growth 2023-2028 (%)
      • Data Table on Global Market: Year-over-year growth 2023-2028 (%)

    4 Historic Market Size

    • 4.1 Global Fire-Resistant Fabrics Market 2018 - 2022
      • Historic Market Size - Data Table on Global Fire-Resistant Fabrics Market 2018 - 2022 ($ million)
    • 4.2 End-user segment analysis 2018 - 2022
      • Historic Market Size - End-user Segment 2018 - 2022 ($ million)
    • 4.3 Product segment analysis 2018 - 2022
      • Historic Market Size - Product Segment 2018 - 2022 ($ million)
    • 4.4 Geography segment analysis 2018 - 2022
      • Historic Market Size - Geography Segment 2018 - 2022 ($ million)
    • 4.5 Country segment analysis 2018 - 2022
      • Historic Market Size - Country Segment 2018 - 2022 ($ million)

    5 Five Forces Analysis

    • 5.1 Five forces summary
      • Five forces analysis - Comparison between 2023 and 2028
    • 5.2 Bargaining power of buyers
      • Bargaining power of buyers - Impact of key factors 2023 and 2028
    • 5.3 Bargaining power of suppliers
      • Bargaining power of suppliers - Impact of key factors in 2023 and 2028
    • 5.4 Threat of new entrants
      • Threat of new entrants - Impact of key factors in 2023 and 2028
    • 5.5 Threat of substitutes
      • Threat of substitutes - Impact of key factors in 2023 and 2028
    • 5.6 Threat of rivalry
      • Threat of rivalry - Impact of key factors in 2023 and 2028
    • 5.7 Market condition
      • Chart on Market condition - Five forces 2023 and 2028

    6 Market Segmentation by End-user

    • 6.1 Market segments
      • Chart on End-user - Market share (2023-2028) (%)
      • Data Table on End-user - Market share (2023-2028) (%)
    • 6.2 Comparison by End-user
      • Chart on Comparison by End-user
      • Data Table on Comparison by End-user
    • 6.3 Industrial protective and mining clothing - Market size and forecast (2023-2028)
      • Chart on Industrial protective and mining clothing - Market size and forecast (2023-2028) ($ million)
      • Data Table on Industrial protective and mining clothing - Market size and forecast (2023-2028) ($ million)
      • Chart on Industrial protective and mining clothing - Year-over-year growth (2023-2028) (%)
      • Data Table on Industrial protective and mining clothing - Year-over-year growth (2023-2028) (%)
    • 6.4 Transport - Market size and forecast (2023-2028)
      • Chart on Transport - Market size and forecast (2023-2028) ($ million)
      • Data Table on Transport - Market size and forecast (2023-2028) ($ million)
      • Chart on Transport - Year-over-year growth (2023-2028) (%)
      • Data Table on Transport - Year-over-year growth (2023-2028) (%)
    • 6.5 Defense and firefighting services - Market size and forecast (2023-2028)
      • Chart on Defense and firefighting services - Market size and forecast (2023-2028) ($ million)
      • Data Table on Defense and firefighting services - Market size and forecast (2023-2028) ($ million)
      • Chart on Defense and firefighting services - Year-over-year growth (2023-2028) (%)
      • Data Table on Defense and firefighting services - Year-over-year growth (2023-2028) (%)
    • 6.6 Others - Market size and forecast (2023-2028)
      • Chart on Others - Market size and forecast (2023-2028) ($ million)
      • Data Table on Others - Market size and forecast (2023-2028) ($ million)
      • Chart on Others - Year-over-year growth (2023-2028) (%)
      • Data Table on Others - Year-over-year growth (2023-2028) (%)
    • 6.7 Market opportunity by End-user
      • Market opportunity by End-user ($ million)
      • Data Table on Market opportunity by End-user ($ million)

    7 Market Segmentation by Product

    • 7.1 Market segments
      • Chart on Product - Market share (2023-2028) (%)
      • Data Table on Product - Market share (2023-2028) (%)
    • 7.2 Comparison by Product
      • Chart on Comparison by Product
      • Data Table on Comparison by Product
    • 7.3 Apparel - Market size and forecast (2023-2028)
      • Chart on Apparel - Market size and forecast (2023-2028) ($ million)
      • Data Table on Apparel - Market size and forecast (2023-2028) ($ million)
      • Chart on Apparel - Year-over-year growth (2023-2028) (%)
      • Data Table on Apparel - Year-over-year growth (2023-2028) (%)
    • 7.4 Non-apparel - Market size and forecast (2023-2028)
      • Chart on Non-apparel - Market size and forecast (2023-2028) ($ million)
      • Data Table on Non-apparel - Market size and forecast (2023-2028) ($ million)
      • Chart on Non-apparel - Year-over-year growth (2023-2028) (%)
      • Data Table on Non-apparel - Year-over-year growth (2023-2028) (%)
    • 7.5 Market opportunity by Product
      • Market opportunity by Product ($ million)
      • Data Table on Market opportunity by Product ($ million)

    8 Market Segmentation by End-User Industry

    • 8.1 Market segments
      • Chart on End-User Industry - Market share (2023-2028) (%)
      • Data Table on End-User Industry - Market share (2023-2028) (%)
    • 8.2 Comparison by End-User Industry
      • Chart on Comparison by End-User Industry
      • Data Table on Comparison by End-User Industry
    • 8.3 Oil and Gas - Market size and forecast (2023-2028)
      • Chart on Oil and Gas - Market size and forecast (2023-2028) ($ million)
      • Data Table on Oil and Gas - Market size and forecast (2023-2028) ($ million)
      • Chart on Oil and Gas - Year-over-year growth (2023-2028) (%)
      • Data Table on Oil and Gas - Year-over-year growth (2023-2028) (%)
    • 8.4 Mining - Market size and forecast (2023-2028)
      • Chart on Mining - Market size and forecast (2023-2028) ($ million)
      • Data Table on Mining - Market size and forecast (2023-2028) ($ million)
      • Chart on Mining - Year-over-year growth (2023-2028) (%)
      • Data Table on Mining - Year-over-year growth (2023-2028) (%)
    • 8.5 Construction - Market size and forecast (2023-2028)
      • Chart on Construction - Market size and forecast (2023-2028) ($ million)
      • Data Table on Construction - Market size and forecast (2023-2028) ($ million)
      • Chart on Construction - Year-over-year growth (2023-2028) (%)
      • Data Table on Construction - Year-over-year growth (2023-2028) (%)
    • 8.6 Defense - Market size and forecast (2023-2028)
      • Chart on Defense - Market size and forecast (2023-2028) ($ million)
      • Data Table on Defense - Market size and forecast (2023-2028) ($ million)
      • Chart on Defense - Year-over-year growth (2023-2028) (%)
      • Data Table on Defense - Year-over-year growth (2023-2028) (%)
    • 8.7 Fire Services - Market size and forecast (2023-2028)
      • Chart on Fire Services - Market size and forecast (2023-2028) ($ million)
      • Data Table on Fire Services - Market size and forecast (2023-2028) ($ million)
      • Chart on Fire Services - Year-over-year growth (2023-2028) (%)
      • Data Table on Fire Services - Year-over-year growth (2023-2028) (%)
    • 8.8 Market opportunity by End-User Industry
      • Market opportunity by End-User Industry ($ million)
      • Data Table on Market opportunity by End-User Industry ($ million)

    9 Market Segmentation by Fabric Type

    • 9.1 Market segments
      • Chart on Fabric Type - Market share (2023-2028) (%)
      • Data Table on Fabric Type - Market share (2023-2028) (%)
    • 9.2 Comparison by Fabric Type
      • Chart on Comparison by Fabric Type
      • Data Table on Comparison by Fabric Type
    • 9.3 Cotton - Market size and forecast (2023-2028)
      • Chart on Cotton - Market size and forecast (2023-2028) ($ million)
      • Data Table on Cotton - Market size and forecast (2023-2028) ($ million)
      • Chart on Cotton - Year-over-year growth (2023-2028) (%)
      • Data Table on Cotton - Year-over-year growth (2023-2028) (%)
    • 9.4 Polyester - Market size and forecast (2023-2028)
      • Chart on Polyester - Market size and forecast (2023-2028) ($ million)
      • Data Table on Polyester - Market size and forecast (2023-2028) ($ million)
      • Chart on Polyester - Year-over-year growth (2023-2028) (%)
      • Data Table on Polyester - Year-over-year growth (2023-2028) (%)
    • 9.5 Aramid - Market size and forecast (2023-2028)
      • Chart on Aramid - Market size and forecast (2023-2028) ($ million)
      • Data Table on Aramid - Market size and forecast (2023-2028) ($ million)
      • Chart on Aramid - Year-over-year growth (2023-2028) (%)
      • Data Table on Aramid - Year-over-year growth (2023-2028) (%)
    • 9.6 Modacrylic - Market size and forecast (2023-2028)
      • Chart on Modacrylic - Market size and forecast (2023-2028) ($ million)
      • Data Table on Modacrylic - Market size and forecast (2023-2028) ($ million)
      • Chart on Modacrylic - Year-over-year growth (2023-2028) (%)
      • Data Table on Modacrylic - Year-over-year growth (2023-2028) (%)
    • 9.7 Market opportunity by Fabric Type
      • Market opportunity by Fabric Type ($ million)
      • Data Table on Market opportunity by Fabric Type ($ million)

    10 Customer Landscape

    • 10.1 Customer landscape overview
      • Analysis of price sensitivity, lifecycle, customer purchase basket, adoption rates, and purchase criteria

    11 Geographic Landscape

    • 11.1 Geographic segmentation
      • Chart on Market share by geography 2023-2028 (%)
      • Data Table on Market share by geography 2023-2028 (%)
    • 11.2 Geographic comparison
      • Chart on Geographic comparison
      • Data Table on Geographic comparison
    • 11.3 Europe - Market size and forecast 2023-2028
      • Chart on Europe - Market size and forecast 2023-2028 ($ million)
      • Data Table on Europe - Market size and forecast 2023-2028 ($ million)
      • Chart on Europe - Year-over-year growth 2023-2028 (%)
      • Data Table on Europe - Year-over-year growth 2023-2028 (%)
    • 11.4 APAC - Market size and forecast 2023-2028
      • Chart on APAC - Market size and forecast 2023-2028 ($ million)
      • Data Table on APAC - Market size and forecast 2023-2028 ($ million)
      • Chart on APAC - Year-over-year growth 2023-2028 (%)
      • Data Table on APAC - Year-over-year growth 2023-2028 (%)
    • 11.5 North America - Market size and forecast 2023-2028
      • Chart on North America - Market size and forecast 2023-2028 ($ million)
      • Data Table on North America - Market size and forecast 2023-2028 ($ million)
      • Chart on North America - Year-over-year growth 2023-2028 (%)
      • Data Table on North America - Year-over-year growth 2023-2028 (%)
    • 11.6 South America - Market size and forecast 2023-2028
      • Chart on South America - Market size and forecast 2023-2028 ($ million)
      • Data Table on South America - Market size and forecast 2023-2028 ($ million)
      • Chart on South America - Year-over-year growth 2023-2028 (%)
      • Data Table on South America - Year-over-year growth 2023-2028 (%)
    • 11.7 Middle East and Africa - Market size and forecast 2023-2028
      • Chart on Middle East and Africa - Market size and forecast 2023-2028 ($ million)
      • Data Table on Middle East and Africa - Market size and forecast 2023-2028 ($ million)
      • Chart on Middle East and Africa - Year-over-year growth 2023-2028 (%)
      • Data Table on Middle East and Africa - Year-over-year growth 2023-2028 (%)
    • 11.8 Germany - Market size and forecast 2023-2028
      • Chart on Germany - Market size and forecast 2023-2028 ($ million)
      • Data Table on Germany - Market size and forecast 2023-2028 ($ million)
      • Chart on Germany - Year-over-year growth 2023-2028 (%)
      • Data Table on Germany - Year-over-year growth 2023-2028 (%)
    • 11.9 US - Market size and forecast 2023-2028
      • Chart on US - Market size and forecast 2023-2028 ($ million)
      • Data Table on US - Market size and forecast 2023-2028 ($ million)
      • Chart on US - Year-over-year growth 2023-2028 (%)
      • Data Table on US - Year-over-year growth 2023-2028 (%)
    • 11.10 China - Market size and forecast 2023-2028
      • Chart on China - Market size and forecast 2023-2028 ($ million)
      • Data Table on China - Market size and forecast 2023-2028 ($ million)
      • Chart on China - Year-over-year growth 2023-2028 (%)
      • Data Table on China - Year-over-year growth 2023-2028 (%)
    • 11.11 France - Market size and forecast 2023-2028
      • Chart on France - Market size and forecast 2023-2028 ($ million)
      • Data Table on France - Market size and forecast 2023-2028 ($ million)
      • Chart on France - Year-over-year growth 2023-2028 (%)
      • Data Table on France - Year-over-year growth 2023-2028 (%)
    • 11.12 India - Market size and forecast 2023-2028
      • Chart on India - Market size and forecast 2023-2028 ($ million)
      • Data Table on India - Market size and forecast 2023-2028 ($ million)
      • Chart on India - Year-over-year growth 2023-2028 (%)
      • Data Table on India - Year-over-year growth 2023-2028 (%)
    • 11.13 Market opportunity by geography
      • Market opportunity by geography ($ million)
      • Data Tables on Market opportunity by geography ($ million)
    • 11.14 Canada - Market size and forecast (2023-2028)
      • Chart on Canada - Market size and forecast (2023-2028) ($ million)
      • Data Table on Canada - Market size and forecast (2023-2028) ($ million)
      • Chart on Canada - Year-over-year growth (2023-2028) (%)
      • Data Table on Canada - Year-over-year growth (2023-2028) (%)
    • 11.15 UK - Market size and forecast (2023-2028)
      • Chart on UK - Market size and forecast (2023-2028) ($ million)
      • Data Table on UK - Market size and forecast (2023-2028) ($ million)
      • Chart on UK - Year-over-year growth (2023-2028) (%)
      • Data Table on UK - Year-over-year growth (2023-2028) (%)
    • 11.16 Italy - Market size and forecast (2023-2028)
      • Chart on Italy - Market size and forecast (2023-2028) ($ million)
      • Data Table on Italy - Market size and forecast (2023-2028) ($ million)
      • Chart on Italy - Year-over-year growth (2023-2028) (%)
      • Data Table on Italy - Year-over-year growth (2023-2028) (%)
    • 11.17 Japan - Market size and forecast (2023-2028)
      • Chart on Japan - Market size and forecast (2023-2028) ($ million)
      • Data Table on Japan - Market size and forecast (2023-2028) ($ million)
      • Chart on Japan - Year-over-year growth (2023-2028) (%)
      • Data Table on Japan - Year-over-year growth (2023-2028) (%)
    • 11.18 Brazil - Market size and forecast (2023-2028)
      • Chart on Brazil - Market size and forecast (2023-2028) ($ million)
      • Data Table on Brazil - Market size and forecast (2023-2028) ($ million)
      • Chart on Brazil - Year-over-year growth (2023-2028) (%)
      • Data Table on Brazil - Year-over-year growth (2023-2028) (%)
    • 11.19 Egypt - Market size and forecast (2023-2028)
      • Chart on Egypt - Market size and forecast (2023-2028) ($ million)
      • Data Table on Egypt - Market size and forecast (2023-2028) ($ million)
      • Chart on Egypt - Year-over-year growth (2023-2028) (%)
      • Data Table on Egypt - Year-over-year growth (2023-2028) (%)
    • 11.20 UAE - Market size and forecast (2023-2028)
      • Chart on UAE - Market size and forecast (2023-2028) ($ million)
      • Data Table on UAE - Market size and forecast (2023-2028) ($ million)
      • Chart on UAE - Year-over-year growth (2023-2028) (%)
      • Data Table on UAE - Year-over-year growth (2023-2028) (%)
    • 11.21 Oman - Market size and forecast (2023-2028)
      • Chart on Oman - Market size and forecast (2023-2028) ($ million)
      • Data Table on Oman - Market size and forecast (2023-2028) ($ million)
      • Chart on Oman - Year-over-year growth (2023-2028) (%)
      • Data Table on Oman - Year-over-year growth (2023-2028) (%)
    • 11.22 Argentina - Market size and forecast (2023-2028)
      • Chart on Argentina - Market size and forecast (2023-2028) ($ million)
      • Data Table on Argentina - Market size and forecast (2023-2028) ($ million)
      • Chart on Argentina - Year-over-year growth (2023-2028) (%)
      • Data Table on Argentina - Year-over-year growth (2023-2028) (%)
    • 11.23 KSA - Market size and forecast (2023-2028)
      • Chart on KSA - Market size and forecast (2023-2028) ($ million)
      • Data Table on KSA - Market size and forecast (2023-2028) ($ million)
      • Chart on KSA - Year-over-year growth (2023-2028) (%)
      • Data Table on KSA - Year-over-year growth (2023-2028) (%)
    • 11.24 Rest of World (ROW) - Market size and forecast (2023-2028)
      • Chart on Rest of World (ROW) - Market size and forecast (2023-2028) ($ million)
      • Data Table on Rest of World (ROW) - Market size and forecast (2023-2028) ($ million)
      • Chart on Rest of World (ROW) - Year-over-year growth (2023-2028) (%)
      • Data Table on Rest of World (ROW) - Year-over-year growth (2023-2028) (%)

    12 Drivers, Challenges, and Opportunity/Restraints

    • 12.1 Market drivers
      • 12.2 Market challenges
        • 12.3 Impact of drivers and challenges
          • Impact of drivers and challenges in 2023 and 2028
        • 12.4 Market opportunities/restraints

          13 Competitive Landscape

          • 13.1 Overview
            • 13.2 Competitive Landscape
              • Overview on criticality of inputs and factors of differentiation
            • 13.3 Landscape disruption
              • Overview on factors of disruption
            • 13.4 Industry risks
              • Impact of key risks on business

            14 Competitive Analysis

            • 14.1 Companies profiled
              • Companies covered
            • 14.2 Market positioning of companies
              • Matrix on companies position and classification
            • 3M Company
              • 3M Company - Overview
              • 3M Company - Product / Service
              • 3M Company - Key offerings
            • 14.4 Ansell Ltd.
              • Ansell Ltd. - Overview
              • Ansell Ltd. - Product / Service
              • Ansell Ltd. - Key offerings
            • 14.5 Carrington Textiles Ltd.
              • Carrington Textiles Ltd. - Overview
              • Carrington Textiles Ltd. - Product / Service
              • Carrington Textiles Ltd. - Key offerings
            • 14.6 DuPont de Nemours Inc.
              • DuPont de Nemours Inc. - Overview
              • DuPont de Nemours Inc. - Product / Service
              • DuPont de Nemours Inc. - Key offerings
            • 14.7 Glen Raven Inc.
              • Glen Raven Inc. - Overview
              • Glen Raven Inc. - Product / Service
              • Glen Raven Inc. - Key offerings
            • 14.8 Gunei Chemical Industry Co. Ltd.
              • Gunei Chemical Industry Co. Ltd. - Overview
              • Gunei Chemical Industry Co. Ltd. - Product / Service
              • Gunei Chemical Industry Co. Ltd. - Key offerings
            • 14.9 Haining Jinda Textile Co. Ltd.
              • Haining Jinda Textile Co. Ltd. - Overview
              • Haining Jinda Textile Co. Ltd. - Product / Service
              • Haining Jinda Textile Co. Ltd. - Key offerings
            • 14.10 Huntsman Corporation
              • Huntsman Corporation - Overview
              • Huntsman Corporation - Product / Service
              • Huntsman Corporation - Key offerings
            • 14.11 Indorama Ventures PCL
              • Indorama Ventures PCL - Overview
              • Indorama Ventures PCL - Product / Service
              • Indorama Ventures PCL - Key offerings
            • 14.12 Kaneka Corporation
              • Kaneka Corporation - Overview
              • Kaneka Corporation - Product / Service
              • Kaneka Corporation - Key offerings
            • 14.13 Kermel
              • Kermel - Overview
              • Kermel - Product / Service
              • Kermel - Key offerings
            • 14.14 Mitsui Chemicals Inc.
              • Mitsui Chemicals Inc. - Overview
              • Mitsui Chemicals Inc. - Product / Service
              • Mitsui Chemicals Inc. - Key offerings
            • 14.15 Mount Vernon Mills Inc.
              • Mount Vernon Mills Inc. - Overview
              • Mount Vernon Mills Inc. - Product / Service
              • Mount Vernon Mills Inc. - Key offerings
            • 14.16 PBI Performance Products Inc.
              • PBI Performance Products Inc. - Overview
              • PBI Performance Products Inc. - Product / Service
              • PBI Performance Products Inc. - Key offerings
            • 14.17 Solvay S.A.
              • Solvay S.A. - Overview
              • Solvay S.A. - Product / Service
              • Solvay S.A. - Key offerings
            • 14.18 Teijin Limited
              • Teijin Limited - Overview
              • Teijin Limited - Product / Service
              • Teijin Limited - Key offerings
            • 14.19 TenCate Protective Fabrics
              • TenCate Protective Fabrics - Overview
              • TenCate Protective Fabrics - Product / Service
              • TenCate Protective Fabrics - Key offerings
            • 14.20 Toyobo Co. Ltd.
              • Toyobo Co. Ltd. - Overview
              • Toyobo Co. Ltd. - Product / Service
              • Toyobo Co. Ltd. - Key offerings
            • 14.21 W.L. Gore & Associates Inc.
              • W.L. Gore & Associates Inc. - Overview
              • W.L. Gore & Associates Inc. - Product / Service
              • W.L. Gore & Associates Inc. - Key offerings
            • 14.22 Xinxiang Xinxing Special Fabric Co. Ltd.
              • Xinxiang Xinxing Special Fabric Co. Ltd. - Overview
              • Xinxiang Xinxing Special Fabric Co. Ltd. - Product / Service
              • Xinxiang Xinxing Special Fabric Co. Ltd. - Key offerings
            • 14.23 DALETEC
              • DALETEC - Overview
              • DALETEC - Product / Service
              • DALETEC - Key offerings
            • 14.24 DuPont de Nemours Inc.
              • DuPont de Nemours Inc. - Overview
              • DuPont de Nemours Inc. - Product / Service
              • DuPont de Nemours Inc. - Key offerings
            • 14.25 Glen Raven Inc.
              • Glen Raven Inc. - Overview
              • Glen Raven Inc. - Product / Service
              • Glen Raven Inc. - Key offerings
            • 14.26 Gunei Chemical Industry Co. Ltd.
              • Gunei Chemical Industry Co. Ltd. - Overview
              • Gunei Chemical Industry Co. Ltd. - Product / Service
              • Gunei Chemical Industry Co. Ltd. - Key offerings
            • 14.27 Henan Tianyu Garment
              • Henan Tianyu Garment - Overview
              • Henan Tianyu Garment - Product / Service
              • Henan Tianyu Garment - Key offerings
            • 14.28 Huntsman Corp
              • Huntsman Corp - Overview
              • Huntsman Corp - Product / Service
              • Huntsman Corp - Key offerings
            • 14.29 Indorama Ventures Public Co. Ltd.
              • Indorama Ventures Public Co. Ltd. - Overview
              • Indorama Ventures Public Co. Ltd. - Product / Service
              • Indorama Ventures Public Co. Ltd. - Key offerings
            • 14.30 Kaneka Corp.
              • Kaneka Corp. - Overview
              • Kaneka Corp. - Product / Service
              • Kaneka Corp. - Key offerings
            • 14.31 Lenzing AG
              • Lenzing AG - Overview
              • Lenzing AG - Product / Service
              • Lenzing AG - Key offerings
            • 14.32 Marina Textil SL
              • Marina Textil SL - Overview
              • Marina Textil SL - Product / Service
              • Marina Textil SL - Key offerings
            • 14.33 Milliken and Co.
              • Milliken and Co. - Overview
              • Milliken and Co. - Product / Service
              • Milliken and Co. - Key offerings
            • 14.34 Newtex Industries Inc.
              • Newtex Industries Inc. - Overview
              • Newtex Industries Inc. - Product / Service
              • Newtex Industries Inc. - Key offerings
            • 14.35 PBI Performance Products Inc.
              • PBI Performance Products Inc. - Overview
              • PBI Performance Products Inc. - Product / Service
              • PBI Performance Products Inc. - Key offerings
            • 14.36 Safechem Solution Pvt. Ltd.
              • Safechem Solution Pvt. Ltd. - Overview
              • Safechem Solution Pvt. Ltd. - Product / Service
              • Safechem Solution Pvt. Ltd. - Key offerings
            • 14.37 Solvay SA
              • Solvay SA - Overview
              • Solvay SA - Product / Service
              • Solvay SA - Key offerings
            • 14.38 Teijin Ltd.
              • Teijin Ltd. - Overview
              • Teijin Ltd. - Product / Service
              • Teijin Ltd. - Key offerings
            • 14.39 TenCate Fabrics EU
              • TenCate Fabrics EU - Overview
              • TenCate Fabrics EU - Product / Service
              • TenCate Fabrics EU - Key offerings
            • 14.40 U Long High Tech Textile Co. Ltd.
              • U Long High Tech Textile Co. Ltd. - Overview
              • U Long High Tech Textile Co. Ltd. - Product / Service
              • U Long High Tech Textile Co. Ltd. - Key offerings
            • 14.41 W. L. Gore and Associates Inc.
              • W. L. Gore and Associates Inc. - Overview
              • W. L. Gore and Associates Inc. - Product / Service
              • W. L. Gore and Associates Inc. - Key offerings
            • 14.42 Xinxiang Harmony Textile Co. Ltd.
              • Xinxiang Harmony Textile Co. Ltd. - Overview
              • Xinxiang Harmony Textile Co. Ltd. - Product / Service
              • Xinxiang Harmony Textile Co. Ltd. - Key offerings

            15 Appendix

            • 15.1 Scope of the report
              • 15.2 Inclusions and exclusions checklist
                • Inclusions checklist
                • Exclusions checklist
              • 15.3 Currency conversion rates for US$
                • Currency conversion rates for US$
              • 15.4 Research methodology
                • Research methodology
              • 15.5 Data procurement
                • Information sources
              • 15.6 Data validation
                • Data validation
              • 15.7 Validation techniques employed for market sizing
                • Validation techniques employed for market sizing
              • 15.8 Data synthesis
                • Data synthesis
              • 15.9 360 degree market analysis
                • 360 degree market analysis
              • 15.10 List of abbreviations
                • List of abbreviations

              Research Methodology

              Technavio presents a detailed picture of the market by way of study, synthesis, and summation of data from multiple sources. The analysts have presented the various facets of the market with a particular focus on identifying the key industry influencers. The data thus presented is comprehensive, reliable, and the result of extensive research, both primary and secondary.

              INFORMATION SOURCES

              Primary sources

              • Manufacturers and suppliers
              • Channel partners
              • Industry experts
              • Strategic decision makers

              Secondary sources

              • Industry journals and periodicals
              • Government data
              • Financial reports of key industry players
              • Historical data
              • Press releases

              DATA ANALYSIS

              Data Synthesis

              • Collation of data
              • Estimation of key figures
              • Analysis of derived insights

              Data Validation

              • Triangulation with data models
              • Reference against proprietary databases
              • Corroboration with industry experts

              REPORT WRITING

              Qualitative

              • Market drivers
              • Market challenges
              • Market trends
              • Five forces analysis

              Quantitative

              • Market size and forecast
              • Market segmentation
              • Geographical insights
              • Competitive landscape

              Interested in this report?

              Get your sample now to see our research methodology and insights!

              Download Now

              Frequently Asked Questions

              Fire-Resistant Fabrics market growth will increase by $ 2120.4 mn during 2024-2028.

              The Fire-Resistant Fabrics market is expected to grow at a CAGR of 6.78% during 2024-2028.

              Fire-Resistant Fabrics market is segmented by End-user( Industrial protective and mining clothing, Transport, Defense and firefighting services, Others) Product( Apparel, Non-apparel)

              3M Company, Ansell Ltd., Carrington Textiles Ltd., DuPont de Nemours Inc., Glen Raven Inc., Gunei Chemical Industry Co. Ltd., Haining Jinda Textile Co. Ltd., Huntsman Corporation, Indorama Ventures PCL, Kaneka Corporation, Kermel, Mitsui Chemicals Inc., Mount Vernon Mills Inc., PBI Performance Products Inc., Solvay S.A., Teijin Limited, TenCate Protective Fabrics, Toyobo Co. Ltd., W.L. Gore & Associates Inc., Xinxiang Xinxing Special Fabric Co. Ltd. are a few of the key vendors in the Fire-Resistant Fabrics market.

              Europe will register the highest growth rate of 39% among the other regions. Therefore, the Fire-Resistant Fabrics market in Europe is expected to garner significant business opportunities for the vendors during the forecast period.

              US, Canada, Germany, UK, Italy, France, China, India, Japan, Brazil, Egypt, UAE, Oman, Argentina, KSA, UAE, Brazil, Rest of World (ROW)

              • Growth in chemical and oil and gas industriesWith energy consumption growing worldwide is the driving factor this market.
              • increasing growth in the chemical and oil and gas industries can be seen. The demand for energy is increasing globally. The number of people living in urban areas is more than those living in the countryside. For instance is the driving factor this market.
              • the United Nations forecasts indicate that by 2040 the global urban population will be nearly double the rural population. Therefore is the driving factor this market.
              • the rise in the population indicates a growth in energy demand is the driving factor this market.
              • which is the driving factor this market.
              • in turn is the driving factor this market.
              • is fueling the growth in the chemicals and oil and gas industry. The chemicals and oil and gas industries extensively use fire-resistant fabrics for the safety of the workers due to the high risk of fire hazards in such industries. Therefore is the driving factor this market.
              • the global fire-resistant fabrics market is anticipated to witness growth during the forecast period. is the driving factor this market.

              The Fire-Resistant Fabrics market vendors should focus on grabbing business opportunities from the Industrial protective and mining clothing segment as it accounted for the largest market share in the base year.