Fixed Asset Management Software Market Analysis North America, Europe, APAC, Middle East and Africa, South America - US, UK, China, Germany, Japan - Size and Forecast 2024-2028

Fixed Asset Management Software Market Analysis North America, Europe, APAC, Middle East and Africa, South America - US, UK, China, Germany, Japan - Size and Forecast 2024-2028

Published: Oct 2024 141 Pages SKU: IRTNTR71844

Market Overview at a Glance

$2.23 B
Market Opportunity
9.8%
CAGR
8.7
YoY growth 2023-2024(%)

Fixed Asset Management Software Market Size 2024-2028

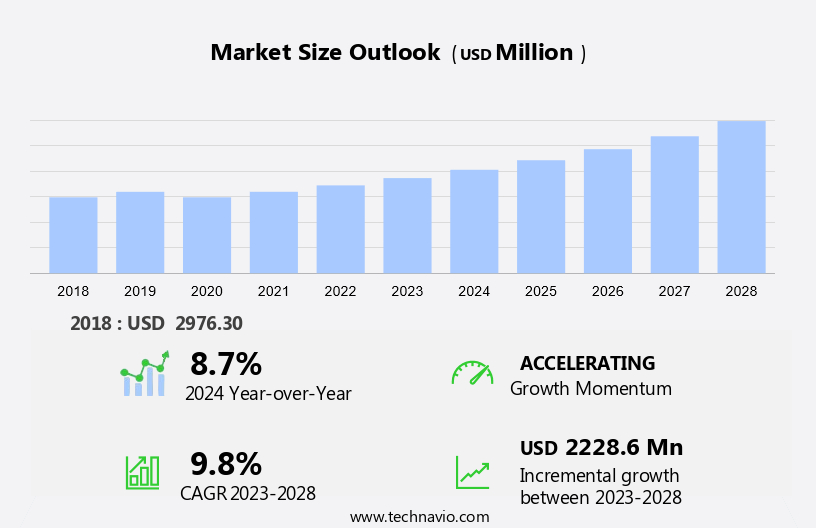
The fixed asset management software market size is forecast to increase by USD 2.23 billion at a CAGR of 9.8% between 2023 and 2028.

  • Fixed asset management software plays a crucial role in monitoring and managing a company's inventory of physical assets, including equipment and machinery. The market for this software is experiencing significant growth due to several factors. First, there is a rising trend towards the adoption of cloud-based deployment solutions, which offer greater operational efficiency and cost savings. Second, advanced technologies, such as IoT sensors and predictive maintenance algorithms, are increasingly being used to reduce maintenance costs and minimize equipment failures, leading to decreased downtime and increased lifetime value. However, data privacy and security concerns remain a challenge, as these systems contain sensitive information that must be protected. Overall, the market is expected to continue growing In the manufacturing sector and beyond, as businesses seek to optimize their operations and improve their bottom line.

What will be the Size of the Fixed Asset Management Software Market During the Forecast Period?

Fixed Asset Management Software Market Size

 Request Free Sample

  • Fixed assets are essential components of any business, including vehicles, computers, furniture, machinery, and equipment. Effective management of these assets is crucial for controlling maintenance costs, enhancing operational efficiency, and maximizing their lifetime value. In today's business environment, organizations are increasingly turning to advanced tracking technologies, such as barcodes, QR codes, and RFID, to streamline their fixed asset management processes. Barcodes, a popular technology for inventory management, offer a cost-effective solution for tracking and managing fixed assets. By assigning unique barcode labels to each asset, businesses can easily track their location, status, and maintenance history. Barcodes can be scanned quickly and efficiently using handheld devices, allowing for real-time updates to asset databases. QR codes, a more advanced form of barcodes, offer additional capabilities, such as storing larger amounts of data and supporting multiple data types. QR codes can be used to store asset information, maintenance schedules, and repair histories, providing a more comprehensive view of each asset's lifecycle. RFID technology takes asset tracking a step further by enabling automatic identification and tracking of assets without the need for line-of-sight scanning.
  • Moreover, RFID tags can be attached to assets and read by readers placed throughout a facility, allowing for real-time monitoring of asset location and status. An asset management system that incorporates these tracking technologies can significantly improve operational efficiency by reducing downtime due to equipment failures and enabling predictive maintenance. By monitoring asset performance and identifying potential issues before they become critical, businesses can minimize repairs and replacements, reducing maintenance costs and increasing productivity. Capital investment in fixed assets is a significant expense for many organizations, and accurate asset tracking is essential for maintaining an accurate record of net worth. Regulatory standards, such as the Sarbanes-Oxley Act, require businesses to maintain accurate records of their fixed assets and their associated costs.
  • An effective asset management system can help businesses meet these regulatory requirements while also providing valuable insights into their asset inventory and utilization. Asset management services that leverage these tracking technologies can help businesses optimize their fixed asset management processes. By providing predictive processes for maintenance and repairs, these services can help businesses minimize downtime and extend the lifecycle of their assets. Additionally, they can help businesses make informed decisions about asset replacement and capital investment based on real-time data and insights. In summary, the use of barcodes, QR codes, and RFID technologies in fixed asset management offers significant benefits for businesses looking to enhance operational efficiency, reduce maintenance costs, and maintain regulatory compliance. By implementing an asset management system that incorporates these technologies, businesses can gain valuable insights into their fixed asset inventory and optimize their management processes for maximum productivity and profitability.

How is this Fixed Asset Management Software Industry segmented and which is the largest segment?

The industry research report provides comprehensive data (region-wise segment analysis), with forecasts and estimates in "USD billion" for the period 2024-2028, as well as historical data from 2018-2022 for the following segments.

  • Deployment
    • On-premises
    • Cloud
  • Geography
    • North America
      • US
    • Europe
      • Germany
      • UK
    • APAC
      • China
      • Japan
    • Middle East and Africa
    • South America

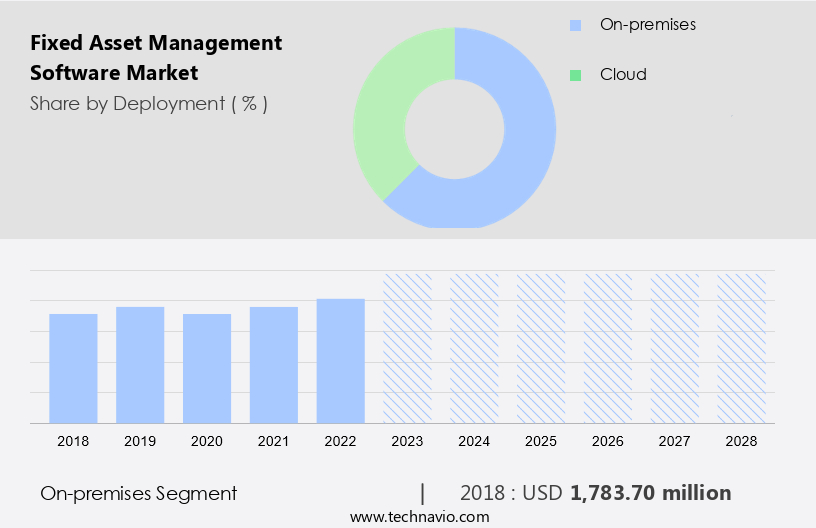
By Deployment Insights

  • The on-premises segment is estimated to witness significant growth during the forecast period.

Fixed asset management software is essential for monitoring and managing an organization's inventory of significant business assets, including equipment and machinery. This software helps businesses keep track of maintenance costs, operational efficiency, and equipment failures to minimize downtime and maximize the lifetime value of their assets. On-premises deployment is the most common approach, as it offers greater control and security over sensitive data. This method involves installing the software on a company's own servers, enabling customization and seamless integration with existing systems. Industries such as aerospace and defense, banking, financial services, and healthcare, which deal with critical information, prefer on-premises solutions due to their stringent compliance and security requirements. By implementing this, businesses can optimize their maintenance costs, improve operational efficiency, and minimize downtime, ultimately enhancing their overall profitability.

Fixed Asset Management Software Market Size

Get a glance at the  Fixed Asset Management Software Industry report of share of various segments Request Free Sample

The on-premises segment was valued at USD 1.78 billion in 2018 and showed a gradual increase during the forecast period.

Regional Analysis

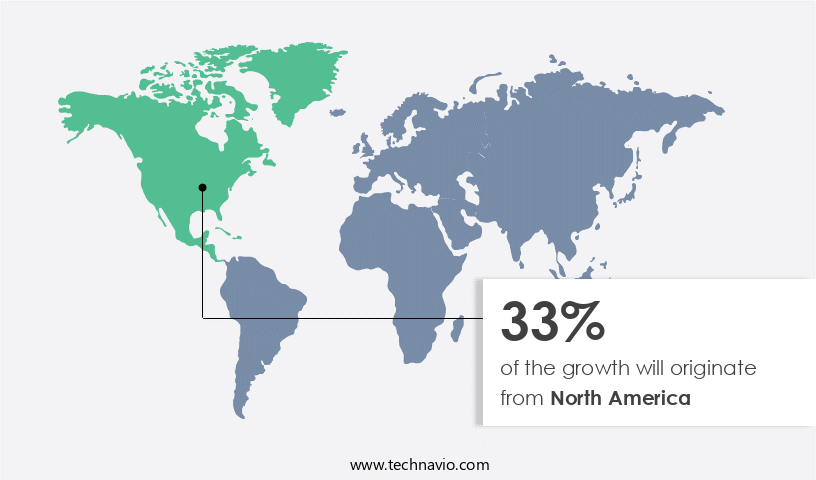
  • North America is estimated to contribute 33% to the growth of the global market during the forecast period.

Technavio's analysts have elaborately explained the regional trends and drivers that shape the market during the forecast period.

Fixed Asset Management Software Market Share by Geography

For more insights on the market share of various regions, Request Free Sample

In the North American market, fixed asset management software holds significant value for businesses due to the region's technologically advanced industrial sector. The high adoption of enterprise asset management solutions, which integrate software, systems, and services for managing and controlling assets and equipment, is a primary factor driving the market's growth. These solutions enhance asset quality and utilization throughout their lifecycle, maximizing productive uptime and minimizing operational costs. Advanced technologies, such as AI, ML, virtualization, and cloud computing, are increasingly being adopted in North America, creating numerous opportunities for the market. AI and ML enable predictive maintenance, while virtualization and cloud computing offer flexibility and scalability.

Asset disposition, scheduling, reporting, and workflows are essential management processes that these solutions automate, ensuring accurate and efficient asset tracking. Periodic audits are simplified through these software systems, ensuring regulatory compliance and reducing the risk of errors. Overall, the North American market is poised for growth due to its advanced technological landscape and the industrial sector's high adoption of enterprise asset management solutions.

Market Dynamics

Our researchers analyzed the data with 2023 as the base year, along with the key drivers, trends, and challenges. A holistic analysis of drivers will help companies refine their marketing strategies to gain a competitive advantage.

What are the key market drivers leading to the rise In the adoption of Fixed Asset Management Software Industry?

Growing adoption of cloud-based deployment solutions is the key driver of the market.

  • In today's digitally advancing business landscape, the adoption of cloud-based services is on the rise. These solutions, which are applications or software accessible remotely and hosted on companies' servers, offer numerous benefits. They provide businesses with IT resources through the Internet, accessible via public, private, or hybrid clouds. The flexibility and scalability of cloud-based services enable organizations to bypass the intricacies of managing hardware, licenses, and software. Fixed asset management software, in particular, is increasingly being offered in a cloud-based format. This shift is in response to the growing demand for streamlined asset management.
  • With cloud-based solutions, businesses can access critical asset details, monitor asset status, and manage aging and depreciation more efficiently. Additionally, rule-based alerts can be set up to notify users of important asset events, such as maintenance schedules or asset sales. A centralized repository for asset information ensures that physical records are easily accessible and up-to-date. This is crucial for accurate asset tracking and reporting. In the event of a sale or scrap, the software can facilitate the process, ensuring a seamless transition. By embracing cloud-based fixed asset management software, businesses can optimize their asset management processes and gain a competitive edge.

What are the market trends shaping the Fixed Asset Management Software Industry?

The rising adoption of advanced technologies is the upcoming market trend.

  • Fixed asset management software has seen significant advancements with the integration of technologies such as barcodes, QR codes, RFID, and hybrid cloud. These technologies enable organizations to effectively manage and track assets, including vehicles, computers, furniture, machinery, and more. Hybrid cloud environments combine on-premises networks with cloud providers, offering organizations the benefits of both private and public cloud models. This approach allows for application efficiency, enhanced security, backup, privacy, and cost savings.
  • Additionally, technologies like RFID, QR codes, and barcodes enhance asset tracking capabilities, providing real-time visibility and accurate data. Organizations can leverage these technologies to optimize their asset management systems, improve operational efficiency, and minimize risks associated with asset loss or mismanagement.

What challenges does the Fixed Asset Management Software Industry face during its growth?

Data privacy and security concerns are key challenges affecting the industry's growth.

  • Fixed asset management software In the cloud is a popular choice for businesses due to its cost-efficiency and accessibility. Cloud-based solutions offer several advantages, including configurable checklists for streamlined processes, rule-driven checklists for automated tasks, and timely reminders for maintenance and renewals. These tools are essential for managing leases, warranties, and services, ensuring seamless integration with multiple applications.
  • Government agencies, in particular, have embraced cloud solutions for their sensitive data. Cloud-based systems offer centralized data storage, high-speed networks, and improved information management, leading to increased productivity, enhanced data sharing, and collaboration. The benefits of cloud-based fixed asset management software extend to simplified software maintenance and upgrades, lower upfront costs, effective security, and high reliability. By connecting functional gaps in existing systems and processes, these solutions offer organizations significant value and agility.

Exclusive Customer Landscape

The market forecasting report includes the adoption lifecycle of the market, market growth and forecasting, covering from the innovator's stage to the laggard's stage. It focuses on adoption rates in different regions based on penetration. Furthermore, the market report also includes key purchase criteria and drivers of price sensitivity to help companies evaluate and develop their market growth analysis strategies.
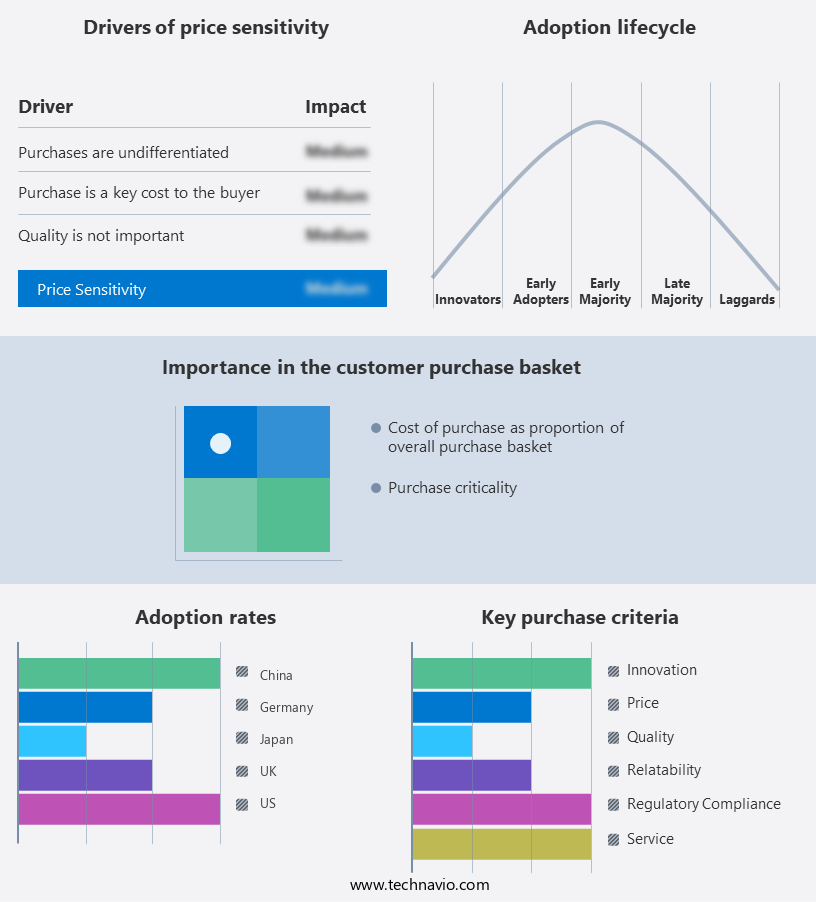
Fixed Asset Management Software Market Share by Geography

 Customer Landscape

Key Companies & Market Insights

Companies are implementing various strategies, such as strategic alliances, market forecast, partnerships, mergers and acquisitions, geographical expansion, and product/service launches, to enhance their presence In the industry.

The industry research and growth report includes detailed analyses of the competitive landscape of the market and information about key companies, including:

  • AccuFund Inc.
  • Acumatica Inc.
  • Adaequare Info Pvt. Ltd.
  • Aramex International LLC
  • Asset Panda LLC
  • AssetWorks LLC
  • Bloomberg LP
  • EAZY ERP
  • EZ Web Enterprises Inc.
  • Financial and Management Information Systems Ltd.
  • Infor Inc.
  • International Business Machines Corp.
  • Multiview Corp.
  • Mynd Integrated Solutions
  • Oracle Corp.
  • Ramco Systems Ltd.
  • Sage Group Plc
  • SAP SE
  • Tech Mahindra Ltd.
  • Xero Ltd.

Qualitative and quantitative analysis of companies has been conducted to help clients understand the wider business environment as well as the strengths and weaknesses of key industry players. Data is qualitatively analyzed to categorize companies as pure play, category-focused, industry-focused, and diversified; it is quantitatively analyzed to categorize companies as dominant, leading, strong, tentative, and weak.

Research Analyst Overview

Fixed asset management is a crucial aspect of business operations, involving the tracking, monitoring, and maintenance of various assets such as vehicles, computers, furniture, machinery, and more. Traditional methods of managing these assets using physical records and manual processes are time-consuming and prone to errors. However, the advent of advanced technologies like barcodes, QR codes, and RFID has revolutionized the way businesses manage their fixed assets. An asset management system utilizing these technologies enables businesses to automate their asset management processes, reducing manual intervention and minimizing errors. By integrating these technologies, businesses can digitize their asset details, enabling real-time tracking and monitoring of asset status, aging, and depreciation.

Moreover, predictive processes and rule-based alerts help businesses identify maintenance needs before equipment failures lead to downtime, reducing maintenance costs and enhancing operational efficiency. Asset management services provide businesses with valuable insights into their inventory, enabling them to optimize capital investment, net worth, and productivity. Regulatory standards and customer satisfaction demand accurate and timely reporting, which is made possible through automation software's scheduling, workflows, and seamless integration with multiple applications. Asset movements, disposition, lease, warranty, service, renewals, and sales are all streamlined, ensuring value for money and a positive business reputation. A centralized repository for asset details and asset movements facilitates periodical audits and rule-driven checklists, ensuring timely reminders for renewals, lease expirations, and rule-based alerts for asset replacement or repairs. Configurable checklists and rule-driven workflows further enhance the efficiency of the asset management process.

Market Scope

Report Coverage

Details

Page number

141

Base year

2023

Historic period

2018-2022

Forecast period

2024-2028

Growth momentum & CAGR

Accelerate at a CAGR of 9.8%

Market growth 2024-2028

USD 2.23 billion

Market structure

Fragmented

YoY growth 2023-2024(%)

8.7

Key countries

US, UK, China, Germany, and Japan

Competitive landscape

Leading Companies, Market Positioning of Companies, Competitive Strategies, and Industry Risks

Request Free Sample

What are the Key Data Covered in this Market Research and Growth Report?

  • CAGR of the industry during the forecast period
  • Detailed information on factors that will drive the growth and forecasting between 2024 and 2028
  • Precise estimation of the size of the market and its contribution of the industry in focus to the parent market
  • Accurate predictions about upcoming growth and trends and changes in consumer behaviour
  • Growth of the market across North America, Europe, APAC, Middle East and Africa, and South America
  • Thorough analysis of the market's competitive landscape and detailed information about companies
  • Comprehensive analysis of factors that will challenge the market growth of industry companies

We can help! Our analysts can customize this market research report to meet your requirements.

Get in touch

1 Executive Summary

  • 1.1 Market overview
    • Executive Summary - Chart on Market Overview
    • Executive Summary - Data Table on Market Overview
    • Executive Summary - Chart on Global Market Characteristics
    • Executive Summary - Chart on Market by Geography
    • Executive Summary - Chart on Market Segmentation by Deployment
    • Executive Summary - Chart on Incremental Growth
    • Executive Summary - Data Table on Incremental Growth
    • Executive Summary - Chart on Company Market Positioning

2 Market Landscape

  • 2.1 Market ecosystem
    • Parent Market
    • Data Table on - Parent Market
  • 2.2 Market characteristics
    • Market characteristics analysis
  • 2.3 Value chain analysis
    • Value Chain Analysis

3 Market Sizing

  • 3.1 Market definition
    • Offerings of companies included in the market definition
  • 3.2 Market segment analysis
    • Market segments
  • 3.3 Market size 2023
    • 3.4 Market outlook: Forecast for 2023-2028
      • Chart on Global - Market size and forecast 2023-2028 ($ million)
      • Data Table on Global - Market size and forecast 2023-2028 ($ million)
      • Chart on Global Market: Year-over-year growth 2023-2028 (%)
      • Data Table on Global Market: Year-over-year growth 2023-2028 (%)

    4 Historic Market Size

    • 4.1 Global Fixed Asset Management Software Market 2018 - 2022
      • Historic Market Size - Data Table on Global Fixed Asset Management Software Market 2018 - 2022 ($ million)
    • 4.2 Deployment segment analysis 2018 - 2022
      • Historic Market Size - Deployment Segment 2018 - 2022 ($ million)
    • 4.3 Geography segment analysis 2018 - 2022
      • Historic Market Size - Geography Segment 2018 - 2022 ($ million)
    • 4.4 Country segment analysis 2018 - 2022
      • Historic Market Size - Country Segment 2018 - 2022 ($ million)

    5 Five Forces Analysis

    • 5.1 Five forces summary
      • Five forces analysis - Comparison between 2023 and 2028
    • 5.2 Bargaining power of buyers
      • Bargaining power of buyers - Impact of key factors 2023 and 2028
    • 5.3 Bargaining power of suppliers
      • Bargaining power of suppliers - Impact of key factors in 2023 and 2028
    • 5.4 Threat of new entrants
      • Threat of new entrants - Impact of key factors in 2023 and 2028
    • 5.5 Threat of substitutes
      • Threat of substitutes - Impact of key factors in 2023 and 2028
    • 5.6 Threat of rivalry
      • Threat of rivalry - Impact of key factors in 2023 and 2028
    • 5.7 Market condition
      • Chart on Market condition - Five forces 2023 and 2028

    6 Market Segmentation by Deployment

    • 6.1 Market segments
      • Chart on Deployment - Market share 2023-2028 (%)
      • Data Table on Deployment - Market share 2023-2028 (%)
    • 6.2 Comparison by Deployment
      • Chart on Comparison by Deployment
      • Data Table on Comparison by Deployment
    • 6.3 On-premises - Market size and forecast 2023-2028
      • Chart on On-premises - Market size and forecast 2023-2028 ($ million)
      • Data Table on On-premises - Market size and forecast 2023-2028 ($ million)
      • Chart on On-premises - Year-over-year growth 2023-2028 (%)
      • Data Table on On-premises - Year-over-year growth 2023-2028 (%)
    • 6.4 Cloud - Market size and forecast 2023-2028
      • Chart on Cloud - Market size and forecast 2023-2028 ($ million)
      • Data Table on Cloud - Market size and forecast 2023-2028 ($ million)
      • Chart on Cloud - Year-over-year growth 2023-2028 (%)
      • Data Table on Cloud - Year-over-year growth 2023-2028 (%)
    • 6.5 Market opportunity by Deployment
      • Market opportunity by Deployment ($ million)
      • Data Table on Market opportunity by Deployment ($ million)

    7 Customer Landscape

    • 7.1 Customer landscape overview
      • Analysis of price sensitivity, lifecycle, customer purchase basket, adoption rates, and purchase criteria

    8 Geographic Landscape

    • 8.1 Geographic segmentation
      • Chart on Market share by geography 2023-2028 (%)
      • Data Table on Market share by geography 2023-2028 (%)
    • 8.2 Geographic comparison
      • Chart on Geographic comparison
      • Data Table on Geographic comparison
    • 8.3 North America - Market size and forecast 2023-2028
      • Chart on North America - Market size and forecast 2023-2028 ($ million)
      • Data Table on North America - Market size and forecast 2023-2028 ($ million)
      • Chart on North America - Year-over-year growth 2023-2028 (%)
      • Data Table on North America - Year-over-year growth 2023-2028 (%)
    • 8.4 Europe - Market size and forecast 2023-2028
      • Chart on Europe - Market size and forecast 2023-2028 ($ million)
      • Data Table on Europe - Market size and forecast 2023-2028 ($ million)
      • Chart on Europe - Year-over-year growth 2023-2028 (%)
      • Data Table on Europe - Year-over-year growth 2023-2028 (%)
    • 8.5 APAC - Market size and forecast 2023-2028
      • Chart on APAC - Market size and forecast 2023-2028 ($ million)
      • Data Table on APAC - Market size and forecast 2023-2028 ($ million)
      • Chart on APAC - Year-over-year growth 2023-2028 (%)
      • Data Table on APAC - Year-over-year growth 2023-2028 (%)
    • 8.6 Middle East and Africa - Market size and forecast 2023-2028
      • Chart on Middle East and Africa - Market size and forecast 2023-2028 ($ million)
      • Data Table on Middle East and Africa - Market size and forecast 2023-2028 ($ million)
      • Chart on Middle East and Africa - Year-over-year growth 2023-2028 (%)
      • Data Table on Middle East and Africa - Year-over-year growth 2023-2028 (%)
    • 8.7 South America - Market size and forecast 2023-2028
      • Chart on South America - Market size and forecast 2023-2028 ($ million)
      • Data Table on South America - Market size and forecast 2023-2028 ($ million)
      • Chart on South America - Year-over-year growth 2023-2028 (%)
      • Data Table on South America - Year-over-year growth 2023-2028 (%)
    • 8.8 US - Market size and forecast 2023-2028
      • Chart on US - Market size and forecast 2023-2028 ($ million)
      • Data Table on US - Market size and forecast 2023-2028 ($ million)
      • Chart on US - Year-over-year growth 2023-2028 (%)
      • Data Table on US - Year-over-year growth 2023-2028 (%)
    • 8.9 UK - Market size and forecast 2023-2028
      • Chart on UK - Market size and forecast 2023-2028 ($ million)
      • Data Table on UK - Market size and forecast 2023-2028 ($ million)
      • Chart on UK - Year-over-year growth 2023-2028 (%)
      • Data Table on UK - Year-over-year growth 2023-2028 (%)
    • 8.10 China - Market size and forecast 2023-2028
      • Chart on China - Market size and forecast 2023-2028 ($ million)
      • Data Table on China - Market size and forecast 2023-2028 ($ million)
      • Chart on China - Year-over-year growth 2023-2028 (%)
      • Data Table on China - Year-over-year growth 2023-2028 (%)
    • 8.11 Germany - Market size and forecast 2023-2028
      • Chart on Germany - Market size and forecast 2023-2028 ($ million)
      • Data Table on Germany - Market size and forecast 2023-2028 ($ million)
      • Chart on Germany - Year-over-year growth 2023-2028 (%)
      • Data Table on Germany - Year-over-year growth 2023-2028 (%)
    • 8.12 Japan - Market size and forecast 2023-2028
      • Chart on Japan - Market size and forecast 2023-2028 ($ million)
      • Data Table on Japan - Market size and forecast 2023-2028 ($ million)
      • Chart on Japan - Year-over-year growth 2023-2028 (%)
      • Data Table on Japan - Year-over-year growth 2023-2028 (%)
    • 8.13 Market opportunity by geography
      • Market opportunity by geography ($ million)
      • Data Tables on Market opportunity by geography ($ million)

    9 Drivers, Challenges, and Opportunity/Restraints

    • 9.1 Market drivers
      • 9.2 Market challenges
        • 9.3 Impact of drivers and challenges
          • Impact of drivers and challenges in 2023 and 2028
        • 9.4 Market opportunities/restraints

          10 Competitive Landscape

          • 10.1 Overview
            • 10.2 Competitive Landscape
              • Overview on criticality of inputs and factors of differentiation
            • 10.3 Landscape disruption
              • Overview on factors of disruption
            • 10.4 Industry risks
              • Impact of key risks on business

            11 Competitive Analysis

            • 11.1 Companies profiled
              • Companies covered
            • 11.2 Market positioning of companies
              • Matrix on companies position and classification
            • 11.3 AccuFund Inc.
              • AccuFund Inc. - Overview
              • AccuFund Inc. - Product / Service
              • AccuFund Inc. - Key offerings
            • 11.4 Acumatica Inc.
              • Acumatica Inc. - Overview
              • Acumatica Inc. - Product / Service
              • Acumatica Inc. - Key news
              • Acumatica Inc. - Key offerings
            • 11.5 Bloomberg LP
              • Bloomberg LP - Overview
              • Bloomberg LP - Product / Service
              • Bloomberg LP - Key news
              • Bloomberg LP - Key offerings
            • 11.6 EAZY ERP
              • EAZY ERP - Overview
              • EAZY ERP - Product / Service
              • EAZY ERP - Key offerings
            • 11.7 Infor Inc.
              • Infor Inc. - Overview
              • Infor Inc. - Product / Service
              • Infor Inc. - Key news
              • Infor Inc. - Key offerings
            • 11.8 International Business Machines Corp.
              • International Business Machines Corp. - Overview
              • International Business Machines Corp. - Business segments
              • International Business Machines Corp. - Key news
              • International Business Machines Corp. - Key offerings
              • International Business Machines Corp. - Segment focus
            • 11.9 Multiview Corp.
              • Multiview Corp. - Overview
              • Multiview Corp. - Product / Service
              • Multiview Corp. - Key offerings
            • 11.10 Oracle Corp.
              • Oracle Corp. - Overview
              • Oracle Corp. - Business segments
              • Oracle Corp. - Key news
              • Oracle Corp. - Key offerings
              • Oracle Corp. - Segment focus
            • 11.11 Sage Group Plc
              • Sage Group Plc - Overview
              • Sage Group Plc - Business segments
              • Sage Group Plc - Key news
              • Sage Group Plc - Key offerings
              • Sage Group Plc - Segment focus
            • 11.12 SAP SE
              • SAP SE - Overview
              • SAP SE - Business segments
              • SAP SE - Key news
              • SAP SE - Key offerings
              • SAP SE - Segment focus

            12 Appendix

            • 12.1 Scope of the report
              • 12.2 Inclusions and exclusions checklist
                • Inclusions checklist
                • Exclusions checklist
              • 12.3 Currency conversion rates for US$
                • Currency conversion rates for US$
              • 12.4 Research methodology
                • Research methodology
              • 12.5 Data procurement
                • Information sources
              • 12.6 Data validation
                • Data validation
              • 12.7 Validation techniques employed for market sizing
                • Validation techniques employed for market sizing
              • 12.8 Data synthesis
                • Data synthesis
              • 12.9 360 degree market analysis
                • 360 degree market analysis
              • 12.10 List of abbreviations
                • List of abbreviations

              Research Methodology

              Technavio presents a detailed picture of the market by way of study, synthesis, and summation of data from multiple sources. The analysts have presented the various facets of the market with a particular focus on identifying the key industry influencers. The data thus presented is comprehensive, reliable, and the result of extensive research, both primary and secondary.

              INFORMATION SOURCES

              Primary sources

              • Manufacturers and suppliers
              • Channel partners
              • Industry experts
              • Strategic decision makers

              Secondary sources

              • Industry journals and periodicals
              • Government data
              • Financial reports of key industry players
              • Historical data
              • Press releases

              DATA ANALYSIS

              Data Synthesis

              • Collation of data
              • Estimation of key figures
              • Analysis of derived insights

              Data Validation

              • Triangulation with data models
              • Reference against proprietary databases
              • Corroboration with industry experts

              REPORT WRITING

              Qualitative

              • Market drivers
              • Market challenges
              • Market trends
              • Five forces analysis

              Quantitative

              • Market size and forecast
              • Market segmentation
              • Geographical insights
              • Competitive landscape

              Interested in this report?

              Get your sample now to see our research methodology and insights!

              Download Now

              Frequently Asked Questions

              Fixed Asset Management Software market growth will increase by $ 2228.6 mn during 2024-2028.

              The Fixed Asset Management Software market is expected to grow at a CAGR of 9.8% during 2024-2028.

              Fixed Asset Management Software market is segmented by Deployment( On-premises, Cloud)

              AccuFund Inc., Acumatica Inc., Adaequare Info Pvt. Ltd., Aramex International LLC, Asset Panda LLC, AssetWorks LLC, Bloomberg LP, EAZY ERP, EZ Web Enterprises Inc., Financial and Management Information Systems Ltd., Infor Inc., International Business Machines Corp., Multiview Corp., Mynd Integrated Solutions, Oracle Corp., Ramco Systems Ltd., Sage Group Plc, SAP SE, Tech Mahindra Ltd., Xero Ltd. are a few of the key vendors in the Fixed Asset Management Software market.

              North America will register the highest growth rate of 33% among the other regions. Therefore, the Fixed Asset Management Software market in North America is expected to garner significant business opportunities for the vendors during the forecast period.

              US, UK, China, Germany, Japan

              • Growing adoption of cloud-based deployment solutionsCloud-based services are applications or software available remotely and hosted on the server of vendors on behalf of the customer. Cloud services are IT resources that are provided over the Internet. Such services can come via public clouds is the driving factor this market.
              • private clouds is the driving factor this market.
              • and hybrid clouds is the driving factor this market.
              • which are a combination of public and private clouds. Cloud-based solutions effectively deliver business agility and a scalable IT infrastructure. This feature of cloud-based services helps overcome the complexities of hardware is the driving factor this market.
              • license management is the driving factor this market.
              • and software. There has been a growing demand for cloud-based solutions such as fixed asset management is the driving factor this market.
              • and thus is the driving factor this market.
              • vendors are significantly launching cloud-based business management software. Moreover is the driving factor this market.
              • the pandemic certainly played a role in the adoption of cloud-based deployment is the driving factor this market.
              • as firms that leveraged cloud-based technology adapted to the challenges of being fully remote. As firms struggled to manage legacy in-house infrastructure is the driving factor this market.
              • they opted cloud-based approach in 2020-2021 for fixed asset management. The cloud also opens new opportunities for innovation is the driving factor this market.
              • allowing customers and providers alike to quickly embrace new technology. Thus is the driving factor this market.
              • such factors are expected to drive the growth of the market in focus during the forecast period. is the driving factor this market.

              The Fixed Asset Management Software market vendors should focus on grabbing business opportunities from the On-premises segment as it accounted for the largest market share in the base year.