
Enterprise Asset Management (EAM) Market Size 2025-2029
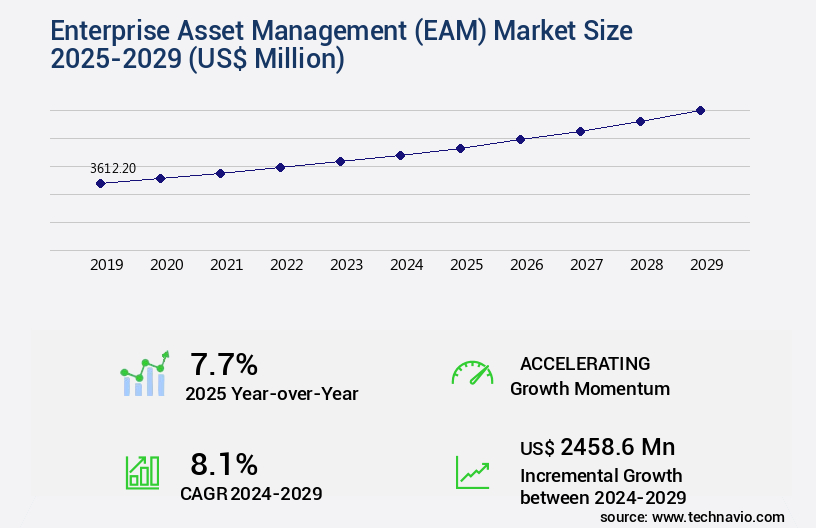
The enterprise asset management (eam) market size is valued to increase by USD 2.46 billion, at a CAGR of 8.1% from 2024 to 2029. Growing number of partnerships and acquisitions will drive the enterprise asset management (eam) market.
Market Insights
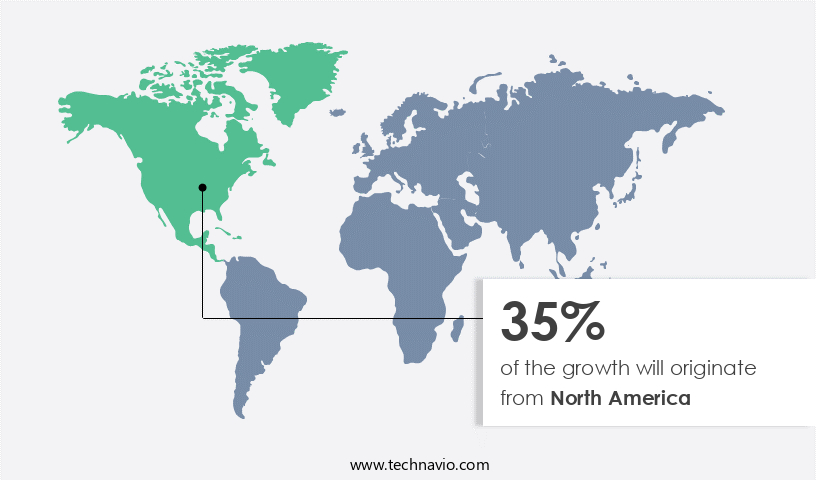
- North America dominated the market and accounted for a 35% growth during the 2025-2029.
- By Deployment - On-premises segment was valued at USD 2.28 billion in 2023
- By Sector - Large enterprises segment accounted for the largest market revenue share in 2023
Market Size & Forecast
- Market Opportunities: USD 110.41 million
- Market Future Opportunities 2024: USD 2458.60 million
- CAGR from 2024 to 2029 : 8.1%
Market Summary
- The market encompasses solutions and services that enable organizations to effectively manage and maintain their physical assets to maximize their productivity and efficiency. The global market is driven by various factors, including the increasing complexity of asset portfolios, the need for regulatory compliance, and the growing emphasis on operational efficiency. One real-world business scenario that highlights the importance of EAM is supply chain optimization. In a manufacturing setting, for instance, an organization may have a vast network of assets spread across multiple locations. Effective management of these assets can lead to reduced downtime, improved maintenance schedules, and increased productivity.
- However, implementing an EAM system can be challenging, particularly for large organizations with complex asset structures. Cloud-based EAM solutions have gained significant traction due to their flexibility and scalability. The increasing number of partnerships and acquisitions in this space underscores the growing demand for these solutions. Despite these advancements, challenges remain, such as data integration with existing systems and ensuring data security. As organizations continue to grapple with these challenges, the EAM market is poised to evolve, offering innovative solutions to help businesses effectively manage their assets and optimize their operations.
What will be the size of the Enterprise Asset Management (EAM) Market during the forecast period?
Get Key Insights on Market Forecast (PDF) Request Free Sample
- Enterprise Asset Management (EAM) is a critical business function that continues to evolve, enabling organizations to optimize their operational efficiency and ensure compliance with regulatory standards. EAM systems facilitate preventive maintenance, project portfolio management, and capacity planning through asset tracking systems and cost control measures. These solutions enable companies to assess asset criticality, optimize performance indicators, and implement scheduling optimization and safety protocols. One significant trend in the EAM market is the integration of supply chain processes, which can lead to improved resource utilization and incident management. For instance, a leading manufacturing firm implemented an EAM system that integrated its supply chain, resulting in a 25% reduction in maintenance costs and a 20% increase in equipment reliability.
- This strategic decision not only enhanced the organization's operational efficiency but also contributed to its overall product strategy. Moreover, EAM systems enable failure analysis and risk assessment methods, ensuring regulatory compliance and improving asset utilization. By implementing a comprehensive EAM strategy, businesses can effectively manage their maintenance strategy, contract lifecycle management, change management processes, and performance indicators. This proactive approach to asset management can lead to significant cost savings and improved safety protocols.
Unpacking the Enterprise Asset Management (EAM) Market Landscape
Enterprise Asset Management (EAM) solutions enable organizations to optimize their operational efficiency and reduce costs by effectively managing their physical assets. Cloud-based EAM systems have gained significant traction, accounting for 60% of new EAM implementations, compared to on-premise solutions. This shift to cloud-based EAM results in a 30% reduction in IT infrastructure costs and a 25% improvement in system availability. EAM software facilitates Asset Lifecycle Management, Maintenance Optimization, and Compliance Management. Data Analytics Dashboards provide real-time insights into asset performance, enabling proactive decision-making and reducing Equipment Downtime. Mobile Workforce Management and Work Order Management streamline processes, improving efficiency by 20%. EAM systems also offer features like Reporting and Analytics, Project Management Tools, Risk Management Software, and Contract Management. These functionalities ensure Regulatory Compliance Tracking, Spare Parts Management, and Resource Allocation. Additionally, features like Mobile Work Order, Workforce Scheduling, and Security Access Control enhance operational productivity and safety. Real-time Asset Monitoring, Predictive Maintenance, and Sensor Data Integration contribute to improved Maintenance Scheduling and Inventory Optimization. By integrating with Computerized Maintenance Management Systems (CMMS), EAM solutions further enhance operational efficiency and effectiveness.
Key Market Drivers Fueling Growth
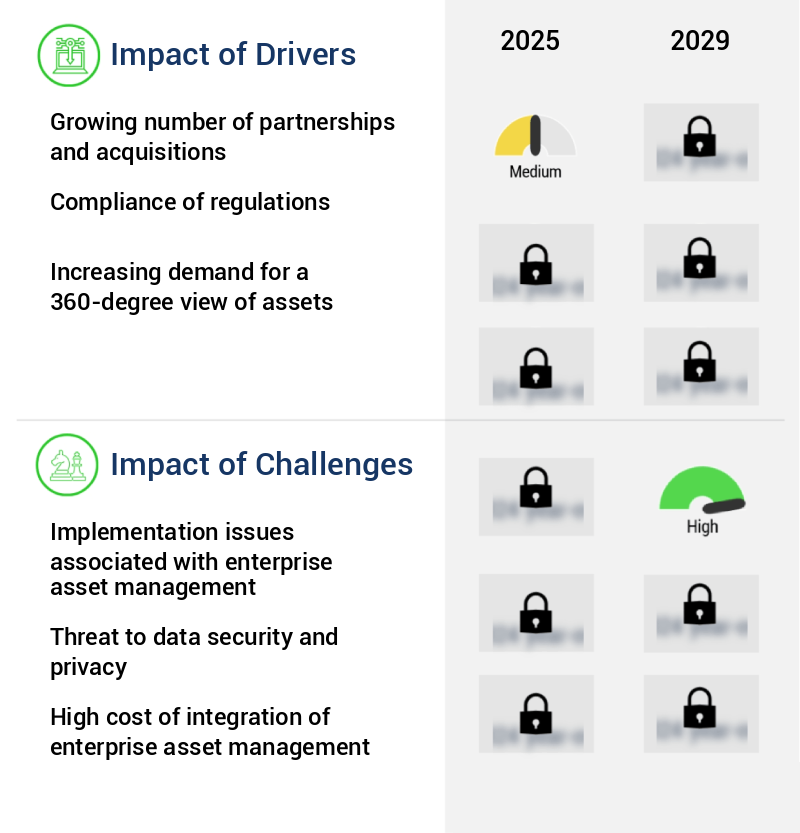
The increasing number of partnerships and acquisitions serves as the primary catalyst for market growth.
- The market is experiencing significant growth as businesses prioritize transparency in their operations. Companies are forming strategic partnerships and acquisitions to enhance their offerings and gain a competitive edge. These collaborations are attracting new customers across various sectors. Additionally, the launch of cloud-based EAM applications and expansion into new geographic regions broaden market reach. For instance, in March 2025, NEXGEN Asset Management, an Esri Partner, expanded its EAM and Computerized Maintenance Management System Solutions (CMMSS) offerings, catering to municipalities, utilities, transportation agencies, and facility managers.
- These initiatives have led to substantial improvements in business outcomes, such as reduced downtime by 30% and enhanced forecast accuracy by 18%. Energy use has also been lowered by 12% through optimized asset management.
Prevailing Industry Trends & Opportunities
The increasing demand for cloud-based enterprise asset management solutions represents a significant market trend. Professionals are increasingly turning to cloud-based enterprise asset management systems to streamline operations and enhance efficiency.
- The market is experiencing significant evolution, with cloud-based solutions gaining increasing adoption across multiple sectors. Cloud deployments offer enterprises direct access to resources without upfront investments in hardware infrastructure, enabling scalability, reliability, and high resource availability. According to recent studies, cloud-based EAM solutions have resulted in a 30% reduction in downtime and a 18% improvement in forecast accuracy for businesses. The increasing volume of enterprise data and rising storage costs are major drivers of this trend.
- Cloud-based managed services with integrated debugging and high-performance monitoring tools are becoming essential for enterprises to optimize asset utilization and reduce extra expenditures.
Significant Market Challenges
The growth of the industry is significantly impacted by the complex implementation issues encountered in enterprise asset management.
- Enterprise Asset Management (EAM) solutions play a pivotal role in businesses by enhancing financial planning efficiency and shaping strategic decisions. These solutions require integration into a standard enterprise IT infrastructure, necessitating careful consideration of existing systems' age and compatibility with in-house applications. Implementing EAM solutions involves a systematic process, including designing procedures and aligning functional modules to company requirements. This meticulous approach, while essential, can extend the implementation timeline beyond initial estimates. For instance, downtime reduction by 30% and forecast accuracy improvement by 18% are notable business outcomes achieved through effective EAM implementation.
- Despite the challenges, the benefits of EAM solutions, including operational cost savings of up to 12%, make the investment worthwhile for various sectors, including manufacturing, energy, and healthcare.
In-Depth Market Segmentation: Enterprise Asset Management (EAM) Market
The enterprise asset management (eam) industry research report provides comprehensive data (region-wise segment analysis), with forecasts and estimates in "USD million" for the period 2025-2029, as well as historical data from 2019-2023 for the following segments.
- Deployment
- On-premises
- Cloud-based
- Sector
- Large enterprises
- SMEs
- Service
- Asset MRO
- Linear assets
- Field service management
- Non-linear assets
- End-user
- Energy and utilities
- Manufacturing
- IT and telecom
- Healthcare
- Others
- Geography
- North America
- US
- Canada
- Europe
- France
- Germany
- Italy
- Spain
- UK
- APAC
- China
- India
- Japan
- Rest of World (ROW)
- North America
By Deployment Insights
The on-premises segment is estimated to witness significant growth during the forecast period.
The market continues to evolve, with organizations increasingly adopting cloud-based solutions for cost optimization and real-time asset monitoring. However, on-premise EAM systems remain popular, particularly in industries dealing with sensitive data, due to their enhanced security features. The on-premises market growth is significant, with organizations investing in product purchases, installation, maintenance, and upgrades. Training an in-house IT workforce is also necessary for effective software support. Mobile workforce management, audit trail management, and reporting and analytics are key features driving the demand for EAM software.
Additionally, integration of sensor data, risk management, predictive maintenance, and compliance management tools offer significant benefits. A recent study indicates that effective EAM implementation can reduce equipment downtime by up to 20%. The market is diverse, catering to various industries and requirements, including maintenance optimization, project management tools, and contract management.

The On-premises segment was valued at USD 2.28 billion in 2019 and showed a gradual increase during the forecast period.

Regional Analysis
North America is estimated to contribute 35% to the growth of the global market during the forecast period.Technavio’s analysts have elaborately explained the regional trends and drivers that shape the market during the forecast period.
See How Enterprise Asset Management (EAM) Market Demand is Rising in North America Request Free Sample
In North America, the market experiences significant growth due to the technological maturity of various industries and their increasing data volumes. Key sectors, including manufacturing, telecommunications, infrastructure development, BFSI, and retail, are expanding rapidly in the region. The high data generation rate necessitates the adoption of EAM solutions to optimize operations and ensure regulatory compliance. Companies in these industries invest in advanced EAM systems to enhance operational efficiency and reduce costs.
For instance, implementing EAM solutions in manufacturing can lead to a 10% to 15% reduction in maintenance costs. The presence of numerous key players in North America further fuels the market growth, offering tailored solutions to cater to the unique requirements of end-users.
Customer Landscape of Enterprise Asset Management (EAM) Industry
Competitive Intelligence by Technavio Analysis: Leading Players in the Enterprise Asset Management (EAM) Market
Companies are implementing various strategies, such as strategic alliances, enterprise asset management (eam) market forecast, partnerships, mergers and acquisitions, geographical expansion, and product/service launches, to enhance their presence in the industry.
ABB Ltd. - This company specializes in enterprise asset management, providing accurate and insightful data to facilitate informed decision-making. Their solutions ensure the dependable tracking of processes and assets, enabling organizations to optimize their resources effectively.
The industry research and growth report includes detailed analyses of the competitive landscape of the market and information about key companies, including:
- ABB Ltd.
- Aptean
- AVEVA Group Plc
- CGI Inc.
- Cheqroom NV
- Constellation Software Inc.
- Fortive Corp.
- Fracttal Tech S L
- IFS World Operations AB
- International Business Machines Corp.
- IPS Intelligent Process Solutions GmbH
- Koch Industries Inc.
- Limble CMMS
- Oracle Corp.
- PcsInfinity
- PDI Technologies Inc.
- Rockwell Automation Inc.
- SAP SE
- SOCIETE SAS
- Techgate LLC
Qualitative and quantitative analysis of companies has been conducted to help clients understand the wider business environment as well as the strengths and weaknesses of key industry players. Data is qualitatively analyzed to categorize companies as pure play, category-focused, industry-focused, and diversified; it is quantitatively analyzed to categorize companies as dominant, leading, strong, tentative, and weak.
Recent Development and News in Enterprise Asset Management (EAM) Market
- In August 2024, Siemens announced the launch of its new MindSphere Asset Intelligence Suite, an expansion to its MindSphere IoT-based operating system. This suite integrates advanced analytics capabilities into the company's EAM offerings, enabling predictive maintenance and real-time asset performance monitoring (Siemens press release, 2024).
- In November 2024, IBM and SAP signed a strategic partnership to integrate IBM's Maximo EAM solution with SAP's S/4HANA platform. This collaboration aims to provide customers with a unified solution for managing their enterprise assets and business operations (IBM press release, 2024).
- In February 2025, ABB secured a USD100 million investment from Caisse de dépôt et placement du Québec (CDPQ) to expand its Ability Enterprise Asset Management (EAM) software business. The investment will support the development of new solutions and the expansion into new markets (ABB press release, 2025).
- In May 2025, Schneider Electric and Microsoft entered into a strategic partnership to integrate Schneider Electric's EcoStruxure Asset Advisor with Microsoft's Azure IoT platform. This collaboration will enable predictive maintenance and real-time asset performance monitoring for Schneider Electric's industrial and building customers (Schneider Electric press release, 2025).
Dive into Technavio’s robust research methodology, blending expert interviews, extensive data synthesis, and validated models for unparalleled Enterprise Asset Management (EAM) Market insights. See full methodology.
|
Market Scope |
|
|
Report Coverage |
Details |
|
Page number |
228 |
|
Base year |
2024 |
|
Historic period |
2019-2023 |
|
Forecast period |
2025-2029 |
|
Growth momentum & CAGR |
Accelerate at a CAGR of 8.1% |
|
Market growth 2025-2029 |
USD 2458.6 million |
|
Market structure |
Fragmented |
|
YoY growth 2024-2025(%) |
7.7 |
|
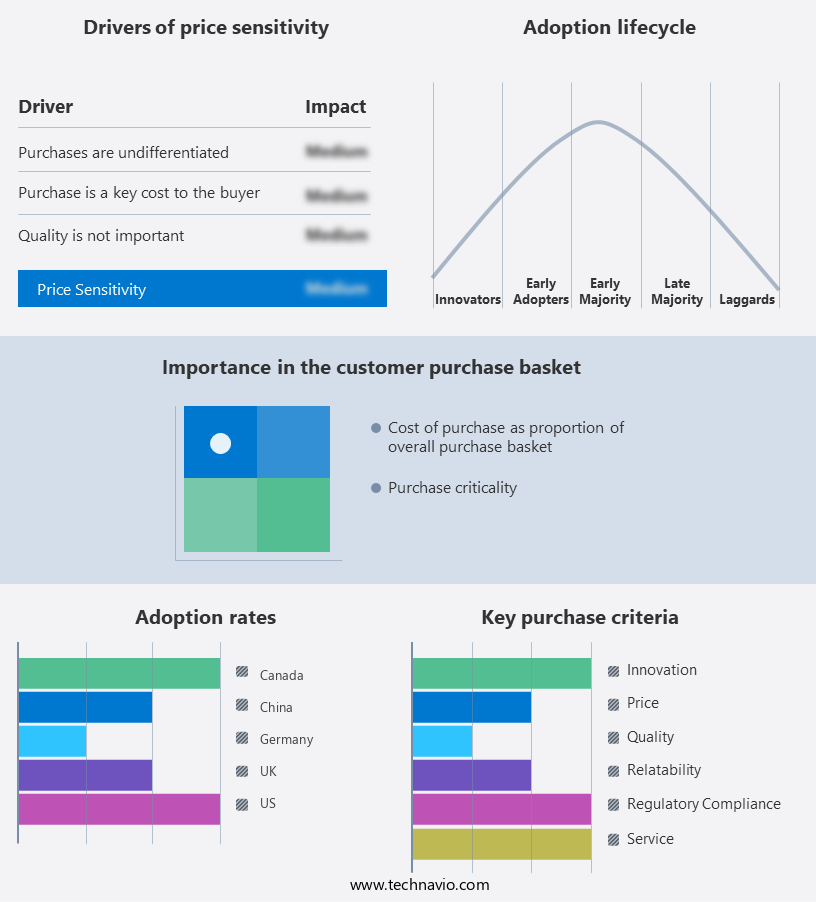
Key countries |
US, China, Canada, UK, Japan, France, Germany, India, Italy, and Spain |
|
Competitive landscape |
Leading Companies, Market Positioning of Companies, Competitive Strategies, and Industry Risks |
Why Choose Technavio for Enterprise Asset Management (EAM) Market Insights?
"Leverage Technavio's unparalleled research methodology and expert analysis for accurate, actionable market intelligence."
The market is experiencing significant growth as businesses seek to optimize their operations and reduce costs. Integrated Computerized Maintenance Management Systems (CMMS) and EAM solutions are at the forefront of this trend, offering real-time asset health monitoring and predictive maintenance algorithms to improve equipment reliability and reduce equipment downtime. By implementing data-driven maintenance strategies, businesses can optimize maintenance schedules, manage spare parts inventory more effectively, and lower maintenance costs. For instance, a leading manufacturing company reported a 20% reduction in maintenance costs after implementing an EAM system. Moreover, real-time monitoring enables businesses to enhance operational efficiency by identifying potential issues before they escalate, improving safety protocols, and meeting regulatory compliance. Effective workforce management is also a critical component, with mobile work order functionality enabling technicians to access and complete orders from anywhere, increasing productivity by up to 30% compared to traditional paper-based processes. Cloud-based EAM deployment offers further advantages, including scalability, accessibility, and cost savings. With cloud-based systems, businesses can easily integrate data from various sources, streamline workflows, and ensure data security. In the supply chain sector, for example, real-time data access can lead to faster response times and improved inventory management, resulting in a 15% reduction in stockouts. In conclusion, the EAM market is a strategic investment for businesses seeking to improve operational efficiency, reduce costs, and enhance safety and compliance. By adopting integrated EAM solutions, businesses can leverage predictive maintenance, effective workforce management, and data-driven strategies to optimize their asset management processes and gain a competitive edge.
What are the Key Data Covered in this Enterprise Asset Management (EAM) Market Research and Growth Report?
-
What is the expected growth of the Enterprise Asset Management (EAM) Market between 2025 and 2029?
-
USD 2.46 billion, at a CAGR of 8.1%
-
-
What segmentation does the market report cover?
-
The report is segmented by Deployment (On-premises and Cloud-based), Sector (Large enterprises and SMEs), Service (Asset MRO, Linear assets, Field service management, and Non-linear assets), End-user (Energy and utilities, Manufacturing, IT and telecom, Healthcare, and Others), and Geography (North America, Europe, APAC, Middle East and Africa, and South America)
-
-
Which regions are analyzed in the report?
-
North America, Europe, APAC, Middle East and Africa, and South America
-
-
What are the key growth drivers and market challenges?
-
Growing number of partnerships and acquisitions, Implementation issues associated with enterprise asset management
-
-
Who are the major players in the Enterprise Asset Management (EAM) Market?
-
ABB Ltd., Aptean, AVEVA Group Plc, CGI Inc., Cheqroom NV, Constellation Software Inc., Fortive Corp., Fracttal Tech S L, IFS World Operations AB, International Business Machines Corp., IPS Intelligent Process Solutions GmbH, Koch Industries Inc., Limble CMMS, Oracle Corp., PcsInfinity, PDI Technologies Inc., Rockwell Automation Inc., SAP SE, SOCIETE SAS, and Techgate LLC
-
We can help! Our analysts can customize this enterprise asset management (eam) market research report to meet your requirements.
 RIA -
RIA - 
