Flavonoids Market Analysis, Size, and Forecast 2026-2030: North America (US, Canada, and Mexico), Europe (Germany, UK, and France), APAC (China, Japan, and India), South America (Brazil and Argentina), Middle East and Africa (Saudi Arabia, UAE, and South Africa), and Rest of World (ROW)

Flavonoids Market Analysis, Size, and Forecast 2026-2030:
North America (US, Canada, and Mexico), Europe (Germany, UK, and France), APAC (China, Japan, and India), South America (Brazil and Argentina), Middle East and Africa (Saudi Arabia, UAE, and South Africa), and Rest of World (ROW)

Published: Dec 2025 303 Pages SKU: IRTNTR80139

Market Overview at a Glance

$549.7 Mn
Market Opportunity
6.5%
CAGR 2025 - 2030
37.3%
North America Growth
$552.2 Mn
Quercetin segment 2024

Flavonoids Market Size 2026-2030

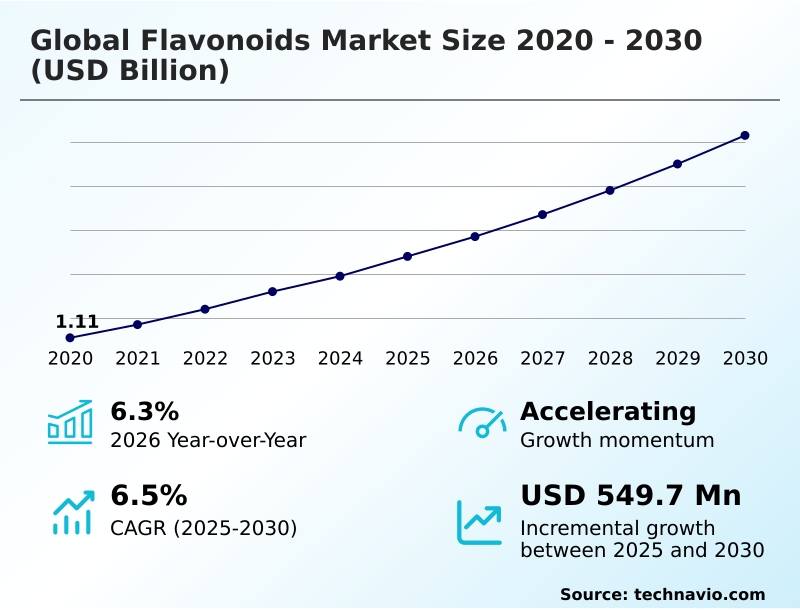
The flavonoids market size is valued to increase by USD 549.7 million, at a CAGR of 6.5% from 2025 to 2030. Rising awareness of health benefits associated with flavonoids will drive the flavonoids market.

Major Market Trends & Insights

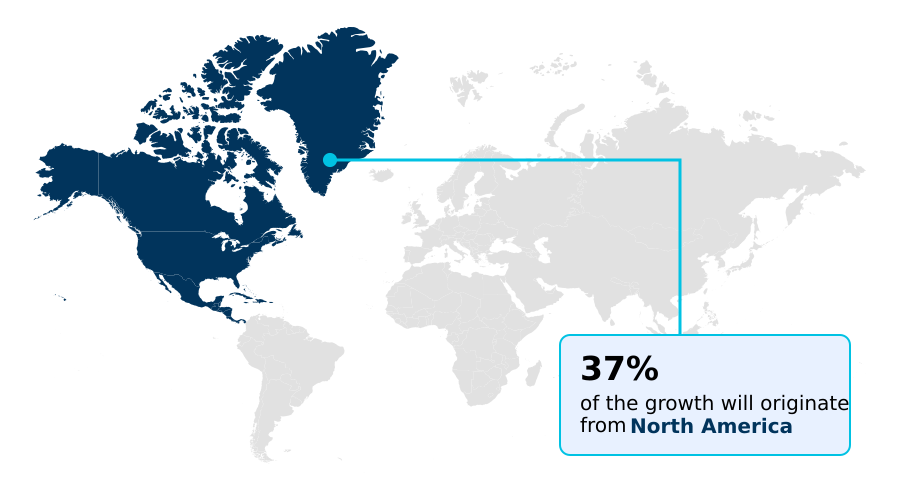
  • North America dominated the market and accounted for a 37.3% growth during the forecast period.
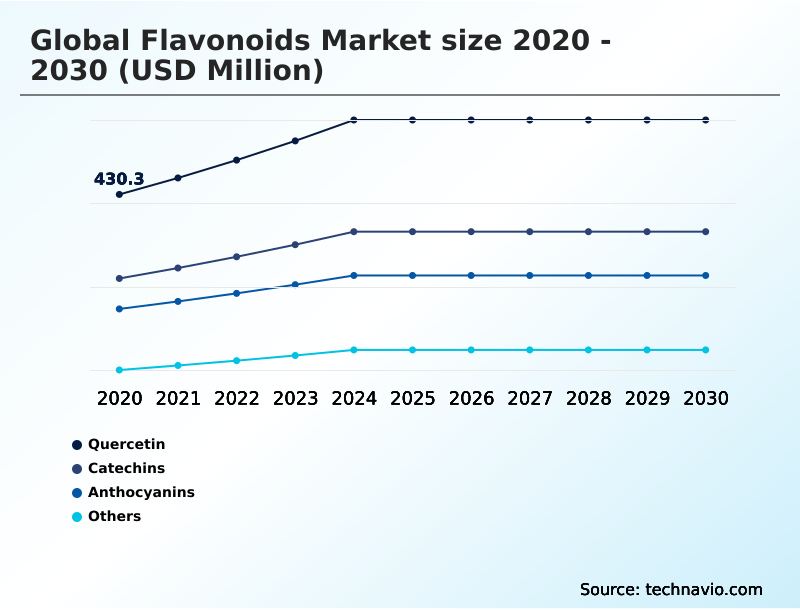
  • By Type - Quercetin segment was valued at USD 552.2 million in 2024
  • By Application - Food and beverages segment accounted for the largest market revenue share in 2024

Market Size & Forecast

  • Market Opportunities: USD 921.8 million
  • Market Future Opportunities: USD 549.7 million
  • CAGR from 2025 to 2030 : 6.5%

Market Summary

  • The flavonoids market is defined by rising consumer demand for natural, plant-based ingredients in preventive healthcare. These polyphenolic compounds are increasingly integral to nutraceutical, pharmaceutical, and cosmetic applications due to their recognized antioxidant, anti-inflammatory, and anti-carcinogenic properties. Growth is supported by an aging global population seeking functional foods and dietary supplements that aid in managing chronic conditions.
  • A significant operational consideration for manufacturers is achieving supply chain resilience. For instance, a functional beverage company must secure a consistent supply of high-quality bilberry extract standardization to ensure uniform anthocyanin content in every batch, a process complicated by climate-induced agricultural variability.
  • This requires advanced quality control protocols and strategic sourcing to maintain product efficacy and meet consumer expectations for standardized herbal extracts. Ongoing research into bioavailability enhancement techniques and new applications continues to expand the market's commercial potential, though navigating complex global regulatory frameworks for health claim substantiation remains a persistent challenge.

What will be the Size of the Flavonoids Market during the forecast period?

Get Key Insights on Market Forecast (PDF) Request Free Sample

How is the Flavonoids Market Segmented?

The flavonoids industry research report provides comprehensive data (region-wise segment analysis), with forecasts and estimates in "USD million" for the period 2026-2030, as well as historical data from 2020-2024 for the following segments.

  • Type
    • Quercetin
    • Catechins
    • Anthocyanins
    • Others
  • Application
    • Food and beverages
    • Dietary supplements
    • Others
  • Source
    • Citrus fruits
    • Tea leaves
    • Berries
    • Vegetables
    • Legumes
  • Geography
    • North America
      • US
      • Canada
      • Mexico
    • Europe
      • Germany
      • UK
      • France
    • APAC
      • China
      • Japan
      • India
    • South America
      • Brazil
      • Argentina
    • Middle East and Africa
      • Saudi Arabia
      • UAE
      • South Africa
    • Rest of World (ROW)

By Type Insights

The quercetin segment is estimated to witness significant growth during the forecast period.

The quercetin segment is pivotal, driven by its established benefits in immune support and anti-inflammatory effects. This bioflavonoid is integral to nutraceutical formulation and a primary dietary supplement ingredient for consumers focused on cardiovascular health support and oxidative stress reduction.

A key focus is quercetin bioavailability, as innovations in delivery mechanisms have demonstrated the potential to increase absorption by up to six times compared to standard forms. This advancement in bioavailability enhancement techniques allows for more effective, lower-dose products.

The demand for high-purity isolate production continues to rise, especially for applications requiring precise antioxidant capacity measurement and free-radical scavenging properties, solidifying its position within the functional foods landscape and driving further research into its neuroprotective effects.

Request Free Sample

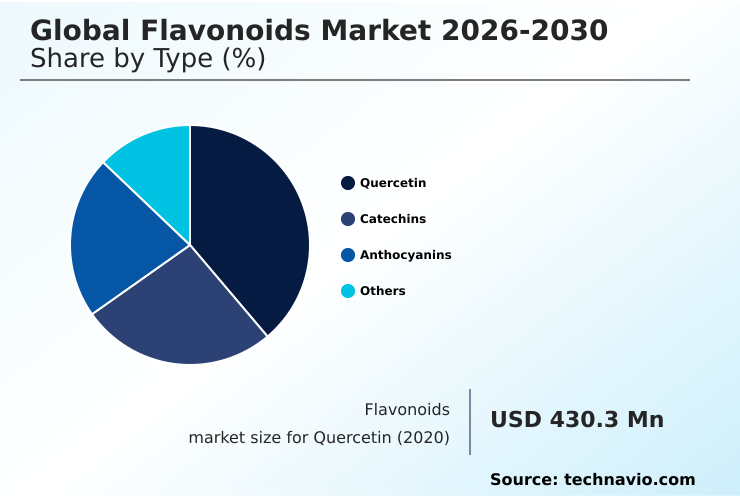
The Quercetin segment was valued at USD 552.2 million in 2024 and showed a gradual increase during the forecast period.

Request Free Sample

Regional Analysis

North America is estimated to contribute 37.3% to the growth of the global market during the forecast period.Technavio’s analysts have elaborately explained the regional trends and drivers that shape the market during the forecast period.

See How Flavonoids Market Demand is Rising in North America Request Free Sample

The geographic landscape of the flavonoids market is characterized by distinct regional dynamics. North America and Europe represent mature markets, where high consumer awareness and stringent regulatory frameworks drive demand for high-purity, scientifically validated ingredients for nutraceuticals and cosmeceuticals.

North America alone is forecast to contribute approximately 37.3% of the market's growth.

In contrast, the APAC region, led by China, serves as both a primary production hub and a rapidly growing consumer market, contributing over 27% to the market's incremental expansion.

Production facilities in this region often leverage economies of scale to achieve significant cost efficiencies. South America, particularly Brazil and Chile, is a critical supplier of unique raw materials derived from its rich biodiversity, including potent anthocyanin and proanthocyanidin sources.

This global interplay between established consumer markets, large-scale production centers, and biodiverse sourcing regions defines the industry's supply chain.

Market Dynamics

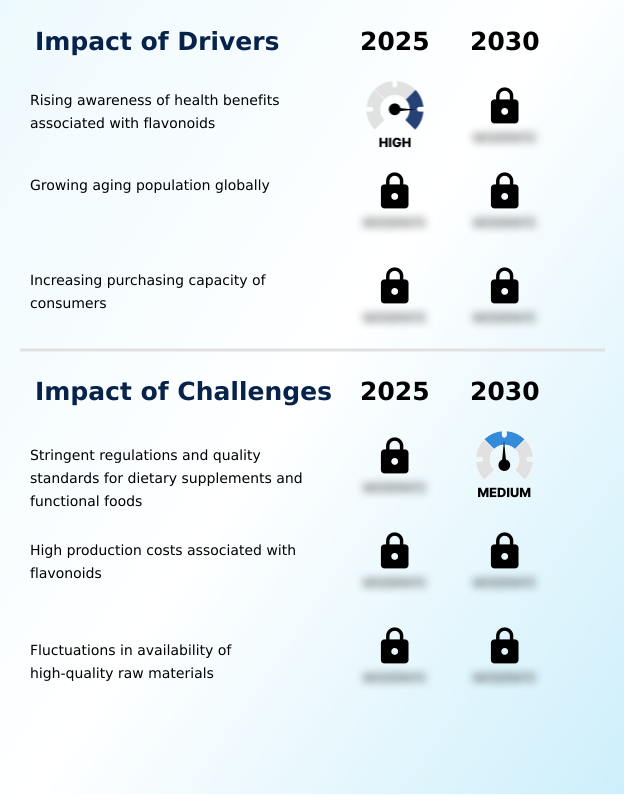
Our researchers analyzed the data with 2025 as the base year, along with the key drivers, trends, and challenges. A holistic analysis of drivers will help companies refine their marketing strategies to gain a competitive advantage.

  • The expanding application of flavonoids is rooted in a growing body of evidence supporting their functional benefits across multiple industries. In the nutraceutical sector, the role of flavonoids in animal feed nutrition and their impact of flavonoids on oxidative stress are well-documented.
  • Specific compounds are targeted for distinct health outcomes, including the role of quercetin in immune support, catechins for cardiovascular health benefits, and luteolin's role in reducing inflammation. The use of flavonoids in anti-aging cosmeceuticals is a significant driver, while anthocyanins as natural food colorants meet clean-label demands in the food industry.
  • Key research focuses on improving bioavailability of flavonoid compounds, often through the nanoparticle delivery of poorly soluble flavonoids. This technical challenge has led firms to rigorously evaluate their processes, constantly comparing plant extraction vs chemical synthesis to optimize yields and costs.
  • Consequently, sustainable extraction techniques for flavonoids are gaining traction, although navigating regulatory standards for flavonoid health claims remains a critical hurdle for commercialization. Companies that successfully implement sustainable methods have reported up to 15% greater consistency in raw material quality, directly enhancing final product reliability.
  • Demand continues to grow for products targeting specific needs, such as those leveraging isoflavones for menopausal symptom relief and the broader genistein and daidzein phytoestrogen effects. The market further benefits from research into kaempferol applications in functional foods and the exploration of flavonoids for neurodegenerative disease prevention.
  • Established ingredients like those demonstrating egcg benefits in green tea extracts, citrus bioflavonoids for vascular health, and proanthocyanidin applications in dietary supplements maintain strong market positions. Meanwhile, niche but growing areas include hesperidin extraction from citrus peels and products capitalizing on apigenin benefits for sleep and relaxation.

What are the key market drivers leading to the rise in the adoption of Flavonoids Industry?

  • The market is primarily driven by the rising awareness among consumers of the various health benefits associated with flavonoids.

  • Market growth is fundamentally driven by rising consumer demand for preventive healthcare solutions and natural ingredients. Products designed for the aging demographic that provide clear health claim substantiation backed by clinical trial validation show a 15% higher repeat purchase rate.
  • In emerging economies, a direct correlation is observed where a 10% rise in disposable income leads to a notable increase in spending on functional food enrichment and premium supplements.
  • This trend is fueling demand for standardized herbal extracts and botanical extract purification for use in plant-based therapeutics.
  • The focus on oral bioavailability improvement and clean label ingredients is compelling manufacturers to invest in research supporting the role of compounds like catechins for cardiovascular health benefits and the impact of flavonoids on oxidative stress, aligning product development with consumer wellness priorities.

What are the market trends shaping the Flavonoids Industry?

  • A prominent market trend is the increasing focus among companies on new product development. This reflects the dynamic and competitive nature of the industry as firms seek to innovate.

  • Key market trends are centered on enhancing the efficacy and sustainability of flavonoid-based products. The exploration of nanoparticle delivery of poorly soluble flavonoids is a critical focus, as this technology can increase the efficacy of certain compounds by up to 60%, enabling lower and more cost-effective dosages in nutraceutical formulation.
  • In parallel, the industry's shift toward sustainable extraction techniques for flavonoids is yielding significant operational benefits. Advanced methods such as enzyme-assisted extraction are reducing processing times by 25% compared to conventional techniques, improving throughput and margin stability. This innovation in high-purity isolate production and plant extract purification, alongside a focus on agricultural byproduct valorization, is redefining efficiency standards.
  • These advancements in bioactive compound stabilization and bioavailability enhancement techniques reflect a market moving toward more potent and environmentally responsible solutions.

What challenges does the Flavonoids Industry face during its growth?

  • A key challenge affecting industry growth involves navigating the stringent regulations and quality standards imposed on dietary supplements and functional foods.

  • The primary challenges facing the market are regulatory complexity and supply chain volatility. Navigating divergent international regulations from bodies like EFSA and FDA can extend new product launch timelines by 12-18 months, representing a significant operational delay and cost.
  • Concurrently, supply chain transparency is hampered by raw material instability; fluctuations in agricultural output have led to input cost volatility of up to 40% in a single season for some botanical sources. This makes comparing plant extraction vs chemical synthesis a continuous strategic exercise for maintaining cost control.
  • These issues, combined with the high cost of quality control standards and the need for rigorous health claim substantiation, create significant barriers to market entry and impact the profitability of existing operators specializing in polyphenolic compound analysis.

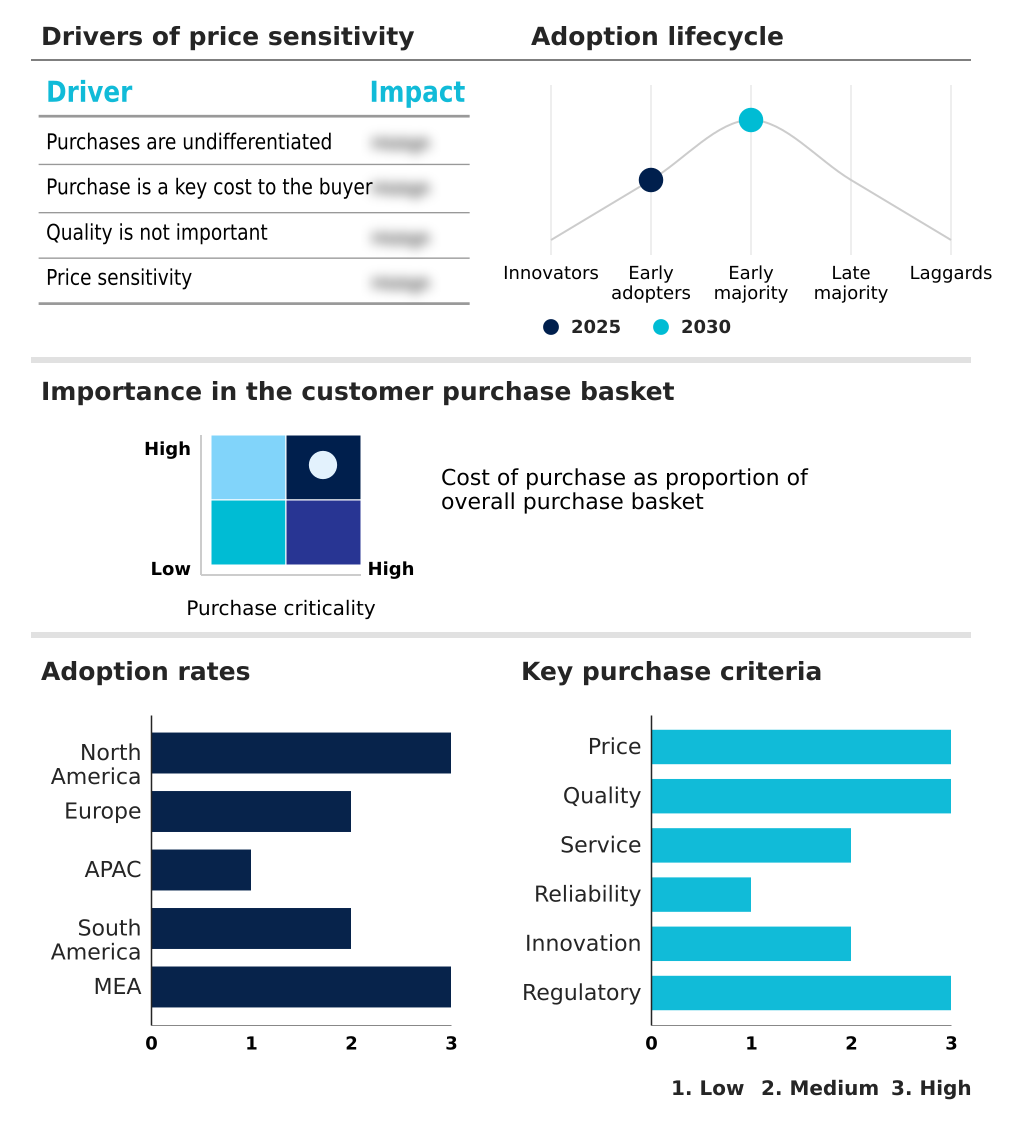
Exclusive Technavio Analysis on Customer Landscape

The flavonoids market forecasting report includes the adoption lifecycle of the market, covering from the innovator’s stage to the laggard’s stage. It focuses on adoption rates in different regions based on penetration. Furthermore, the flavonoids market report also includes key purchase criteria and drivers of price sensitivity to help companies evaluate and develop their market growth analysis strategies.

Customer Landscape of Flavonoids Industry

Competitive Landscape

Companies are implementing various strategies, such as strategic alliances, flavonoids market forecast, partnerships, mergers and acquisitions, geographical expansion, and product/service launches, to enhance their presence in the industry.

Alchem International Pvt. Ltd - The firm provides high-purity phytochemicals and standardized botanical extracts, supplying key flavonoid compounds to the pharmaceutical, nutraceutical, and cosmetic industries for various applications.

The industry research and growth report includes detailed analyses of the competitive landscape of the market and information about key companies, including:

  • Alchem International Pvt. Ltd
  • BASF SE
  • Bioriginal Food and Science
  • Biosynth Ltd.
  • Bordas SA
  • Cayman Chemical Co.
  • Conagen Inc.
  • DSM Firmenich AG
  • Extrasynthese
  • Givaudan SA
  • Guilin Layn Natural Corp.
  • Indena S.p.A.
  • Indofine Chemical Co. Inc.
  • Lianyuan Kangbiotech Co. Ltd
  • Santa Cruz Biotechnology Inc.
  • Sigma Aldrich Chemicals Ltd.
  • Taiyo Kagaku Co. Ltd.

Qualitative and quantitative analysis of companies has been conducted to help clients understand the wider business environment as well as the strengths and weaknesses of key industry players. Data is qualitatively analyzed to categorize companies as pure play, category-focused, industry-focused, and diversified; it is quantitatively analyzed to categorize companies as dominant, leading, strong, tentative, and weak.

Recent Development and News in Flavonoids market

  • In September 2024, Veracruz Bio-Extracts Consortium announced a joint venture to build a state-of-the-art extraction facility focused on producing high-purity citrus bioflavonoids for the global pharmaceutical and nutraceutical industries.
  • In November 2024, Innovate Ingredients Corp. commercially launched a new fermented soy isoflavone ingredient, demonstrating twofold greater bioavailability than standard extracts, aimed at enhancing products in the women's health sector.
  • In January 2025, a leading Chinese beverage conglomerate introduced a new line of ready-to-drink wellness teas enriched with citrus-derived flavonoids, marketing them for their potential cardiovascular health benefits to health-conscious consumers.
  • In March 2025, Clarins, a luxury cosmetics house, launched a new skincare range centered around a patented flavonoid complex from Pinot Noir grapes, highlighting its scientifically validated anti-aging and skin-protective properties.

Dive into Technavio’s robust research methodology, blending expert interviews, extensive data synthesis, and validated models for unparalleled Flavonoids Market insights. See full methodology.

Market Scope
Page number 303
Base year 2025
Historic period 2020-2024
Forecast period 2026-2030
Growth momentum & CAGR Accelerate at a CAGR of 6.5%
Market growth 2026-2030 USD 549.7 million
Market structure Fragmented
YoY growth 2025-2026(%) 6.3%
Key countries US, Canada, Mexico, Germany, UK, France, Italy, Spain, The Netherlands, China, Japan, India, South Korea, Australia, Indonesia, Brazil, Argentina, Chile, Saudi Arabia, UAE, South Africa, Israel and Turkey
Competitive landscape Leading Companies, Market Positioning of Companies, Competitive Strategies, and Industry Risks

Request Free Sample

Research Analyst Overview

  • The flavonoids market operates on a foundation of plant secondary metabolites, where scientific validation of health benefits is paramount. Key compounds such as green tea extract egcg, grape seed proanthocyanidins, and soy isoflavone genistein are central to the nutraceutical formulation sector. The industry is focused on overcoming inherent limitations of these polyphenolic compounds through advanced technologies.
  • The strategic imperative for boardroom consideration is the pivot toward novel delivery mechanisms; the rise of nanoparticle delivery systems and other methods of bioavailability enhancement directly influences R&D investment and intellectual property strategy. Firms leveraging advanced methods like supercritical fluid extraction have already demonstrated a 40% reduction in solvent waste, aligning with corporate sustainability mandates.
  • This pursuit of efficacy is evident in the development of ingredients for specific outcomes, including cardiovascular health support, immune response modulation, and neuroprotective effects. The value chain involves everything from bilberry extract standardization and olive leaf oleuropein sourcing to the final cosmeceutical ingredient or dietary supplement ingredient.
  • Success hinges on rigorous antioxidant capacity measurement, demonstrating free-radical scavenging, and proving anti-inflammatory properties, all while ensuring venotonic drug formulation and other therapeutic applications are supported by robust data.
  • From understanding phytoestrogen activity to optimizing anti-carcinogenic properties, the market's evolution depends on a deep technical understanding of quercetin bioavailability, catechin extraction, and anthocyanin stability to support skin health protection, metabolic wellness, and cognitive function enhancement.

What are the Key Data Covered in this Flavonoids Market Research and Growth Report?

  • What is the expected growth of the Flavonoids Market between 2026 and 2030?

    • USD 549.7 million, at a CAGR of 6.5%

  • What segmentation does the market report cover?

    • The report is segmented by Type (Quercetin, Catechins, Anthocyanins, and Others), Application (Food and beverages, Dietary supplements, and Others), Source (Citrus fruits, Tea leaves, Berries, Vegetables, and Legumes) and Geography (North America, Europe, APAC, South America, Middle East and Africa)

  • Which regions are analyzed in the report?

    • North America, Europe, APAC, South America and Middle East and Africa

  • What are the key growth drivers and market challenges?

    • Rising awareness of health benefits associated with flavonoids, Stringent regulations and quality standards for dietary supplements and functional foods

  • Who are the major players in the Flavonoids Market?

    • Alchem International Pvt. Ltd, BASF SE, Bioriginal Food and Science, Biosynth Ltd., Bordas SA, Cayman Chemical Co., Conagen Inc., DSM Firmenich AG, Extrasynthese, Givaudan SA, Guilin Layn Natural Corp., Indena S.p.A., Indofine Chemical Co. Inc., Lianyuan Kangbiotech Co. Ltd, Santa Cruz Biotechnology Inc., Sigma Aldrich Chemicals Ltd. and Taiyo Kagaku Co. Ltd.

Market Research Insights

  • Market dynamics are shaped by intense innovation in ingredient efficacy and production technology. The adoption of advanced bioavailability enhancement techniques has enabled formulations with up to 40% less active ingredient for equivalent physiological impact, optimizing product cost and consumer dosage.
  • Concurrently, the shift toward precision fermentation technology allows certain producers to achieve a 25% reduction in cycle times compared to traditional plant extraction, bolstering supply chain predictability. Firms championing sustainable sourcing practices are seeing a tangible return, with some reporting a 15% increase in consumer loyalty.
  • These advancements, including controlled-release formulation, standardized herbal extracts, and agricultural byproduct valorization, are redefining competitive standards. Navigating regulatory compliance, from EFSA and FDA guidelines to organic certification and non-gmo verification, remains critical for market access and necessitates robust quality control standards and transparent health claim substantiation.

We can help! Our analysts can customize this flavonoids market research report to meet your requirements.

Get in touch

1. Executive Summary

1.1 Market overview

Executive Summary - Chart on Market Overview
Executive Summary - Data Table on Market Overview
Executive Summary - Chart on Global Market Characteristics
Executive Summary - Chart on Market by Geography
Executive Summary - Chart on Market Segmentation by Type
Executive Summary - Chart on Market Segmentation by Application
Executive Summary - Chart on Market Segmentation by Source
Executive Summary - Chart on Incremental Growth
Executive Summary - Data Table on Incremental Growth
Executive Summary - Chart on Company Market Positioning

2. Technavio Analysis

2.1 Analysis of price sensitivity, lifecycle, customer purchase basket, adoption rates, and purchase criteria

2.2 Criticality of inputs and Factors of differentiation

Chart on Overview on criticality of inputs and factors of differentiation

2.3 Factors of disruption

Chart on Overview on factors of disruption

2.4 Impact of drivers and challenges

Chart on Impact of drivers and challenges in 2025 and 2030

3. Market Landscape

3.1 Market ecosystem

Chart on Parent Market
Data Table on - Parent Market

3.2 Market characteristics

Chart on Market characteristics analysis

3.3 Value chain analysis

Chart on Value chain analysis

4. Market Sizing

4.1 Market definition

Data Table on Offerings of companies included in the market definition

4.2 Market segment analysis

Market segments

4.3 Market size 2025

4.4 Market outlook: Forecast for 2025-2030

Chart on Global - Market size and forecast 2025-2030 ($ million)
Data Table on Global - Market size and forecast 2025-2030 ($ million)
Chart on Global Market: Year-over-year growth 2025-2030 (%)
Data Table on Global Market: Year-over-year growth 2025-2030 (%)

5. Historic Market Size

5.1 Global Flavonoids Market 2020 - 2024

Historic Market Size - Data Table on Global Flavonoids Market 2020 - 2024 ($ million)

5.2 Type segment analysis 2020 - 2024

Historic Market Size - Type Segment 2020 - 2024 ($ million)

5.3 Application segment analysis 2020 - 2024

Historic Market Size - Application Segment 2020 - 2024 ($ million)

5.4 Source segment analysis 2020 - 2024

Historic Market Size - Source Segment 2020 - 2024 ($ million)

5.5 Geography segment analysis 2020 - 2024

Historic Market Size - Geography Segment 2020 - 2024 ($ million)

5.6 Country segment analysis 2020 - 2024

Historic Market Size - Country Segment 2020 - 2024 ($ million)

6. Qualitative Analysis

6.1 Impact of AI on the Global Flavonoids Market

7. Five Forces Analysis

7.1 Five forces summary

Five forces analysis - Comparison between 2025 and 2030

7.2 Bargaining power of buyers

Bargaining power of buyers - Impact of key factors 2025 and 2030

7.3 Bargaining power of suppliers

Bargaining power of suppliers - Impact of key factors in 2025 and 2030

7.4 Threat of new entrants

Threat of new entrants - Impact of key factors in 2025 and 2030

7.5 Threat of substitutes

Threat of substitutes - Impact of key factors in 2025 and 2030

7.6 Threat of rivalry

Threat of rivalry - Impact of key factors in 2025 and 2030

7.7 Market condition

Chart on Market condition - Five forces 2025 and 2030

8. Market Segmentation by Type

8.1 Market segments

Chart on Type - Market share 2025-2030 (%)
Data Table on Type - Market share 2025-2030 (%)

8.2 Comparison by Type

Chart on Comparison by Type
Data Table on Comparison by Type

8.3 Quercetin - Market size and forecast 2025-2030

Chart on Quercetin - Market size and forecast 2025-2030 ($ million)
Data Table on Quercetin - Market size and forecast 2025-2030 ($ million)
Chart on Quercetin - Year-over-year growth 2025-2030 (%)
Data Table on Quercetin - Year-over-year growth 2025-2030 (%)

8.4 Catechins - Market size and forecast 2025-2030

Chart on Catechins - Market size and forecast 2025-2030 ($ million)
Data Table on Catechins - Market size and forecast 2025-2030 ($ million)
Chart on Catechins - Year-over-year growth 2025-2030 (%)
Data Table on Catechins - Year-over-year growth 2025-2030 (%)

8.5 Anthocyanins - Market size and forecast 2025-2030

Chart on Anthocyanins - Market size and forecast 2025-2030 ($ million)
Data Table on Anthocyanins - Market size and forecast 2025-2030 ($ million)
Chart on Anthocyanins - Year-over-year growth 2025-2030 (%)
Data Table on Anthocyanins - Year-over-year growth 2025-2030 (%)

8.6 Others - Market size and forecast 2025-2030

Chart on Others - Market size and forecast 2025-2030 ($ million)
Data Table on Others - Market size and forecast 2025-2030 ($ million)
Chart on Others - Year-over-year growth 2025-2030 (%)
Data Table on Others - Year-over-year growth 2025-2030 (%)

8.7 Market opportunity by Type

Market opportunity by Type ($ million)
Data Table on Market opportunity by Type ($ million)

9. Market Segmentation by Application

9.1 Market segments

Chart on Application - Market share 2025-2030 (%)
Data Table on Application - Market share 2025-2030 (%)

9.2 Comparison by Application

Chart on Comparison by Application
Data Table on Comparison by Application

9.3 Food and beverages - Market size and forecast 2025-2030

Chart on Food and beverages - Market size and forecast 2025-2030 ($ million)
Data Table on Food and beverages - Market size and forecast 2025-2030 ($ million)
Chart on Food and beverages - Year-over-year growth 2025-2030 (%)
Data Table on Food and beverages - Year-over-year growth 2025-2030 (%)

9.4 Dietary supplements - Market size and forecast 2025-2030

Chart on Dietary supplements - Market size and forecast 2025-2030 ($ million)
Data Table on Dietary supplements - Market size and forecast 2025-2030 ($ million)
Chart on Dietary supplements - Year-over-year growth 2025-2030 (%)
Data Table on Dietary supplements - Year-over-year growth 2025-2030 (%)

9.5 Others - Market size and forecast 2025-2030

Chart on Others - Market size and forecast 2025-2030 ($ million)
Data Table on Others - Market size and forecast 2025-2030 ($ million)
Chart on Others - Year-over-year growth 2025-2030 (%)
Data Table on Others - Year-over-year growth 2025-2030 (%)

9.6 Market opportunity by Application

Market opportunity by Application ($ million)
Data Table on Market opportunity by Application ($ million)

10. Market Segmentation by Source

10.1 Market segments

Chart on Source - Market share 2025-2030 (%)
Data Table on Source - Market share 2025-2030 (%)

10.2 Comparison by Source

Chart on Comparison by Source
Data Table on Comparison by Source

10.3 Citrus fruits - Market size and forecast 2025-2030

Chart on Citrus fruits - Market size and forecast 2025-2030 ($ million)
Data Table on Citrus fruits - Market size and forecast 2025-2030 ($ million)
Chart on Citrus fruits - Year-over-year growth 2025-2030 (%)
Data Table on Citrus fruits - Year-over-year growth 2025-2030 (%)

10.4 Tea leaves - Market size and forecast 2025-2030

Chart on Tea leaves - Market size and forecast 2025-2030 ($ million)
Data Table on Tea leaves - Market size and forecast 2025-2030 ($ million)
Chart on Tea leaves - Year-over-year growth 2025-2030 (%)
Data Table on Tea leaves - Year-over-year growth 2025-2030 (%)

10.5 Berries - Market size and forecast 2025-2030

Chart on Berries - Market size and forecast 2025-2030 ($ million)
Data Table on Berries - Market size and forecast 2025-2030 ($ million)
Chart on Berries - Year-over-year growth 2025-2030 (%)
Data Table on Berries - Year-over-year growth 2025-2030 (%)

10.6 Vegetables - Market size and forecast 2025-2030

Chart on Vegetables - Market size and forecast 2025-2030 ($ million)
Data Table on Vegetables - Market size and forecast 2025-2030 ($ million)
Chart on Vegetables - Year-over-year growth 2025-2030 (%)
Data Table on Vegetables - Year-over-year growth 2025-2030 (%)

10.7 Legumes - Market size and forecast 2025-2030

Chart on Legumes - Market size and forecast 2025-2030 ($ million)
Data Table on Legumes - Market size and forecast 2025-2030 ($ million)
Chart on Legumes - Year-over-year growth 2025-2030 (%)
Data Table on Legumes - Year-over-year growth 2025-2030 (%)

10.8 Market opportunity by Source

Market opportunity by Source ($ million)
Data Table on Market opportunity by Source ($ million)

11. Customer Landscape

11.1 Customer landscape overview

Analysis of price sensitivity, lifecycle, customer purchase basket, adoption rates, and purchase criteria

12. Geographic Landscape

12.1 Geographic segmentation

Chart on Market share by geography 2025-2030 (%)
Data Table on Market share by geography 2025-2030 (%)

12.2 Geographic comparison

Chart on Geographic comparison
Data Table on Geographic comparison

12.3 North America - Market size and forecast 2025-2030

Chart on North America - Market size and forecast 2025-2030 ($ million)
Data Table on North America - Market size and forecast 2025-2030 ($ million)
Chart on North America - Year-over-year growth 2025-2030 (%)
Data Table on North America - Year-over-year growth 2025-2030 (%)
Chart on Regional Comparison - North America
Data Table on Regional Comparison - North America

12.3.1 US - Market size and forecast 2025-2030

Chart on US - Market size and forecast 2025-2030 ($ million)
Data Table on US - Market size and forecast 2025-2030 ($ million)
Chart on US - Year-over-year growth 2025-2030 (%)
Data Table on US - Year-over-year growth 2025-2030 (%)

12.3.2 Canada - Market size and forecast 2025-2030

Chart on Canada - Market size and forecast 2025-2030 ($ million)
Data Table on Canada - Market size and forecast 2025-2030 ($ million)
Chart on Canada - Year-over-year growth 2025-2030 (%)
Data Table on Canada - Year-over-year growth 2025-2030 (%)

12.3.3 Mexico - Market size and forecast 2025-2030

Chart on Mexico - Market size and forecast 2025-2030 ($ million)
Data Table on Mexico - Market size and forecast 2025-2030 ($ million)
Chart on Mexico - Year-over-year growth 2025-2030 (%)
Data Table on Mexico - Year-over-year growth 2025-2030 (%)

12.4 Europe - Market size and forecast 2025-2030

Chart on Europe - Market size and forecast 2025-2030 ($ million)
Data Table on Europe - Market size and forecast 2025-2030 ($ million)
Chart on Europe - Year-over-year growth 2025-2030 (%)
Data Table on Europe - Year-over-year growth 2025-2030 (%)
Chart on Regional Comparison - Europe
Data Table on Regional Comparison - Europe

12.4.1 Germany - Market size and forecast 2025-2030

Chart on Germany - Market size and forecast 2025-2030 ($ million)
Data Table on Germany - Market size and forecast 2025-2030 ($ million)
Chart on Germany - Year-over-year growth 2025-2030 (%)
Data Table on Germany - Year-over-year growth 2025-2030 (%)

12.4.2 UK - Market size and forecast 2025-2030

Chart on UK - Market size and forecast 2025-2030 ($ million)
Data Table on UK - Market size and forecast 2025-2030 ($ million)
Chart on UK - Year-over-year growth 2025-2030 (%)
Data Table on UK - Year-over-year growth 2025-2030 (%)

12.4.3 France - Market size and forecast 2025-2030

Chart on France - Market size and forecast 2025-2030 ($ million)
Data Table on France - Market size and forecast 2025-2030 ($ million)
Chart on France - Year-over-year growth 2025-2030 (%)
Data Table on France - Year-over-year growth 2025-2030 (%)

12.4.4 Italy - Market size and forecast 2025-2030

Chart on Italy - Market size and forecast 2025-2030 ($ million)
Data Table on Italy - Market size and forecast 2025-2030 ($ million)
Chart on Italy - Year-over-year growth 2025-2030 (%)
Data Table on Italy - Year-over-year growth 2025-2030 (%)

12.4.5 Spain - Market size and forecast 2025-2030

Chart on Spain - Market size and forecast 2025-2030 ($ million)
Data Table on Spain - Market size and forecast 2025-2030 ($ million)
Chart on Spain - Year-over-year growth 2025-2030 (%)
Data Table on Spain - Year-over-year growth 2025-2030 (%)

12.4.6 The Netherlands - Market size and forecast 2025-2030

Chart on The Netherlands - Market size and forecast 2025-2030 ($ million)
Data Table on The Netherlands - Market size and forecast 2025-2030 ($ million)
Chart on The Netherlands - Year-over-year growth 2025-2030 (%)
Data Table on The Netherlands - Year-over-year growth 2025-2030 (%)

12.5 APAC - Market size and forecast 2025-2030

Chart on APAC - Market size and forecast 2025-2030 ($ million)
Data Table on APAC - Market size and forecast 2025-2030 ($ million)
Chart on APAC - Year-over-year growth 2025-2030 (%)
Data Table on APAC - Year-over-year growth 2025-2030 (%)
Chart on Regional Comparison - APAC
Data Table on Regional Comparison - APAC

12.5.1 China - Market size and forecast 2025-2030

Chart on China - Market size and forecast 2025-2030 ($ million)
Data Table on China - Market size and forecast 2025-2030 ($ million)
Chart on China - Year-over-year growth 2025-2030 (%)
Data Table on China - Year-over-year growth 2025-2030 (%)

12.5.2 Japan - Market size and forecast 2025-2030

Chart on Japan - Market size and forecast 2025-2030 ($ million)
Data Table on Japan - Market size and forecast 2025-2030 ($ million)
Chart on Japan - Year-over-year growth 2025-2030 (%)
Data Table on Japan - Year-over-year growth 2025-2030 (%)

12.5.3 India - Market size and forecast 2025-2030

Chart on India - Market size and forecast 2025-2030 ($ million)
Data Table on India - Market size and forecast 2025-2030 ($ million)
Chart on India - Year-over-year growth 2025-2030 (%)
Data Table on India - Year-over-year growth 2025-2030 (%)

12.5.4 South Korea - Market size and forecast 2025-2030

Chart on South Korea - Market size and forecast 2025-2030 ($ million)
Data Table on South Korea - Market size and forecast 2025-2030 ($ million)
Chart on South Korea - Year-over-year growth 2025-2030 (%)
Data Table on South Korea - Year-over-year growth 2025-2030 (%)

12.5.5 Australia - Market size and forecast 2025-2030

Chart on Australia - Market size and forecast 2025-2030 ($ million)
Data Table on Australia - Market size and forecast 2025-2030 ($ million)
Chart on Australia - Year-over-year growth 2025-2030 (%)
Data Table on Australia - Year-over-year growth 2025-2030 (%)

12.5.6 Indonesia - Market size and forecast 2025-2030

Chart on Indonesia - Market size and forecast 2025-2030 ($ million)
Data Table on Indonesia - Market size and forecast 2025-2030 ($ million)
Chart on Indonesia - Year-over-year growth 2025-2030 (%)
Data Table on Indonesia - Year-over-year growth 2025-2030 (%)

12.6 South America - Market size and forecast 2025-2030

Chart on South America - Market size and forecast 2025-2030 ($ million)
Data Table on South America - Market size and forecast 2025-2030 ($ million)
Chart on South America - Year-over-year growth 2025-2030 (%)
Data Table on South America - Year-over-year growth 2025-2030 (%)
Chart on Regional Comparison - South America
Data Table on Regional Comparison - South America

12.6.1 Brazil - Market size and forecast 2025-2030

Chart on Brazil - Market size and forecast 2025-2030 ($ million)
Data Table on Brazil - Market size and forecast 2025-2030 ($ million)
Chart on Brazil - Year-over-year growth 2025-2030 (%)
Data Table on Brazil - Year-over-year growth 2025-2030 (%)

12.6.2 Argentina - Market size and forecast 2025-2030

Chart on Argentina - Market size and forecast 2025-2030 ($ million)
Data Table on Argentina - Market size and forecast 2025-2030 ($ million)
Chart on Argentina - Year-over-year growth 2025-2030 (%)
Data Table on Argentina - Year-over-year growth 2025-2030 (%)

12.6.3 Chile - Market size and forecast 2025-2030

Chart on Chile - Market size and forecast 2025-2030 ($ million)
Data Table on Chile - Market size and forecast 2025-2030 ($ million)
Chart on Chile - Year-over-year growth 2025-2030 (%)
Data Table on Chile - Year-over-year growth 2025-2030 (%)

12.7 Middle East and Africa - Market size and forecast 2025-2030

Chart on Middle East and Africa - Market size and forecast 2025-2030 ($ million)
Data Table on Middle East and Africa - Market size and forecast 2025-2030 ($ million)
Chart on Middle East and Africa - Year-over-year growth 2025-2030 (%)
Data Table on Middle East and Africa - Year-over-year growth 2025-2030 (%)
Chart on Regional Comparison - Middle East and Africa
Data Table on Regional Comparison - Middle East and Africa

12.7.1 Saudi Arabia - Market size and forecast 2025-2030

Chart on Saudi Arabia - Market size and forecast 2025-2030 ($ million)
Data Table on Saudi Arabia - Market size and forecast 2025-2030 ($ million)
Chart on Saudi Arabia - Year-over-year growth 2025-2030 (%)
Data Table on Saudi Arabia - Year-over-year growth 2025-2030 (%)

12.7.2 UAE - Market size and forecast 2025-2030

Chart on UAE - Market size and forecast 2025-2030 ($ million)
Data Table on UAE - Market size and forecast 2025-2030 ($ million)
Chart on UAE - Year-over-year growth 2025-2030 (%)
Data Table on UAE - Year-over-year growth 2025-2030 (%)

12.7.3 South Africa - Market size and forecast 2025-2030

Chart on South Africa - Market size and forecast 2025-2030 ($ million)
Data Table on South Africa - Market size and forecast 2025-2030 ($ million)
Chart on South Africa - Year-over-year growth 2025-2030 (%)
Data Table on South Africa - Year-over-year growth 2025-2030 (%)

12.7.4 Israel - Market size and forecast 2025-2030

Chart on Israel - Market size and forecast 2025-2030 ($ million)
Data Table on Israel - Market size and forecast 2025-2030 ($ million)
Chart on Israel - Year-over-year growth 2025-2030 (%)
Data Table on Israel - Year-over-year growth 2025-2030 (%)

12.7.5 Turkey - Market size and forecast 2025-2030

Chart on Turkey - Market size and forecast 2025-2030 ($ million)
Data Table on Turkey - Market size and forecast 2025-2030 ($ million)
Chart on Turkey - Year-over-year growth 2025-2030 (%)
Data Table on Turkey - Year-over-year growth 2025-2030 (%)

12.8 Market opportunity by geography

Market opportunity by geography ($ million)
Data Tables on Market opportunity by geography ($ million)

13. Drivers, Challenges, and Opportunity

13.1 Market drivers

Rising awareness of health benefits associated with flavonoids
Growing aging population globally
Increasing purchasing capacity of consumers

13.2 Market challenges

Stringent regulations and quality standards for dietary supplements and functional foods
High production costs associated with flavonoids
Fluctuations in availability of high-quality raw materials

13.3 Impact of drivers and challenges

Impact of drivers and challenges in 2025 and 2030

13.4 Market opportunities

Increasing focus of companies on new product development
Exploration of more sustainable and efficient extraction techniques for flavonoids
Increasing focus on nanoparticle-mediated delivery of flavonoids

14. Competitive Landscape

14.1 Overview

14.2

Overview on criticality of inputs and factors of differentiation

14.3 Landscape disruption

Overview on factors of disruption

14.4 Industry risks

Impact of key risks on business

15. Competitive Analysis

15.1 Companies profiled

Companies covered

15.2 Company ranking index

15.3 Market positioning of companies

Matrix on companies position and classification

15.4 Alchem International Pvt. Ltd

Alchem International Pvt. Ltd - Overview
Alchem International Pvt. Ltd - Product / Service
Alchem International Pvt. Ltd - Key offerings
SWOT

15.5 BASF SE

BASF SE - Overview
BASF SE - Business segments
BASF SE - Key news
BASF SE - Key offerings
BASF SE - Segment focus
SWOT

15.6 Bioriginal Food and Science

Bioriginal Food and Science - Overview
Bioriginal Food and Science - Product / Service
Bioriginal Food and Science - Key offerings
SWOT

15.7 Biosynth Ltd.

Biosynth Ltd. - Overview
Biosynth Ltd. - Product / Service
Biosynth Ltd. - Key offerings
SWOT

15.8 Bordas SA

Bordas SA - Overview
Bordas SA - Product / Service
Bordas SA - Key offerings
SWOT

15.9 Cayman Chemical Co.

Cayman Chemical Co. - Overview
Cayman Chemical Co. - Product / Service
Cayman Chemical Co. - Key offerings
SWOT

15.10 Conagen Inc.

Conagen Inc. - Overview
Conagen Inc. - Product / Service
Conagen Inc. - Key offerings
SWOT

15.11 DSM Firmenich AG

DSM Firmenich AG - Overview
DSM Firmenich AG - Business segments
DSM Firmenich AG - Key news
DSM Firmenich AG - Key offerings
DSM Firmenich AG - Segment focus
SWOT

15.12 Givaudan SA

Givaudan SA - Overview
Givaudan SA - Business segments
Givaudan SA - Key news
Givaudan SA - Key offerings
Givaudan SA - Segment focus
SWOT

15.13 Guilin Layn Natural Corp.

Guilin Layn Natural Corp. - Overview
Guilin Layn Natural Corp. - Product / Service
Guilin Layn Natural Corp. - Key offerings
SWOT

15.14 Indena S.p.A.

Indena S.p.A. - Overview
Indena S.p.A. - Product / Service
Indena S.p.A. - Key offerings
SWOT

15.15 Indofine Chemical Co. Inc.

Indofine Chemical Co. Inc. - Overview
Indofine Chemical Co. Inc. - Product / Service
Indofine Chemical Co. Inc. - Key offerings
SWOT

15.16 Lianyuan Kangbiotech Co. Ltd

Lianyuan Kangbiotech Co. Ltd - Overview
Lianyuan Kangbiotech Co. Ltd - Product / Service
Lianyuan Kangbiotech Co. Ltd - Key offerings
SWOT

15.17 Santa Cruz Biotechnology Inc.

Santa Cruz Biotechnology Inc. - Overview
Santa Cruz Biotechnology Inc. - Product / Service
Santa Cruz Biotechnology Inc. - Key offerings
SWOT

15.18 Sigma Aldrich Chemicals Ltd.

Sigma Aldrich Chemicals Ltd. - Overview
Sigma Aldrich Chemicals Ltd. - Product / Service
Sigma Aldrich Chemicals Ltd. - Key offerings
SWOT

16. Appendix

16.1 Scope of the report

Market definition
Objectives
Notes and caveats

16.2 Inclusions and exclusions checklist

Inclusions checklist
Exclusions checklist

16.3 Currency conversion rates for US$

16.4 Research methodology

16.5 Data procurement

Information sources

16.6 Data validation

16.7 Validation techniques employed for market sizing

16.8 Data synthesis

16.9 360 degree market analysis

16.10 List of abbreviations

Research Methodology

Technavio presents a detailed picture of the market by way of study, synthesis, and summation of data from multiple sources. The analysts have presented the various facets of the market with a particular focus on identifying the key industry influencers. The data thus presented is comprehensive, reliable, and the result of extensive research, both primary and secondary.

INFORMATION SOURCES

Primary sources

  • Manufacturers and suppliers
  • Channel partners
  • Industry experts
  • Strategic decision makers

Secondary sources

  • Industry journals and periodicals
  • Government data
  • Financial reports of key industry players
  • Historical data
  • Press releases

DATA ANALYSIS

Data Synthesis

  • Collation of data
  • Estimation of key figures
  • Analysis of derived insights

Data Validation

  • Triangulation with data models
  • Reference against proprietary databases
  • Corroboration with industry experts

REPORT WRITING

Qualitative

  • Market drivers
  • Market challenges
  • Market trends
  • Five forces analysis

Quantitative

  • Market size and forecast
  • Market segmentation
  • Geographical insights
  • Competitive landscape

Interested in this report?

Get your sample now to see our research methodology and insights!

Download Now

Frequently Asked Questions

Flavonoids market growth will increase by USD 549.7 million during 2026-2030.

The Flavonoids market is expected to grow at a CAGR of 6.5% during 2026-2030.

Flavonoids market is segmented by Type (Quercetin, Catechins, Anthocyanins, Others) Application (Food and beverages, Dietary supplements, Others) Source (Citrus fruits, Tea leaves, Berries, Vegetables, Legumes)

Alchem International Pvt. Ltd, BASF SE, Bioriginal Food and Science, Biosynth Ltd., Bordas SA, Cayman Chemical Co., Conagen Inc., DSM Firmenich AG, Extrasynthese, Givaudan SA, Guilin Layn Natural Corp., Indena S.p.A., Indofine Chemical Co. Inc., Lianyuan Kangbiotech Co. Ltd, Santa Cruz Biotechnology Inc., Sigma Aldrich Chemicals Ltd., Taiyo Kagaku Co. Ltd. are a few of the key vendors in the Flavonoids market.

North America will register the highest growth rate of 37.3% among the other regions. Therefore, the Flavonoids market in North America is expected to garner significant business opportunities for the vendors during the forecast period.

US, Canada, Mexico, Germany, UK, France, Italy, Spain, The Netherlands, China, Japan, India, South Korea, Australia, Indonesia, Brazil, Argentina, Chile, Saudi Arabia, UAE, South Africa, Israel, Turkey

  • Rising awareness of health benefits associated with flavonoids is the driving factor this market.

The Flavonoids market vendors should focus on grabbing business opportunities from the Type segment as it accounted for the largest market share in the base year.