Flexible Shaft Couplings Market Size 2026-2030
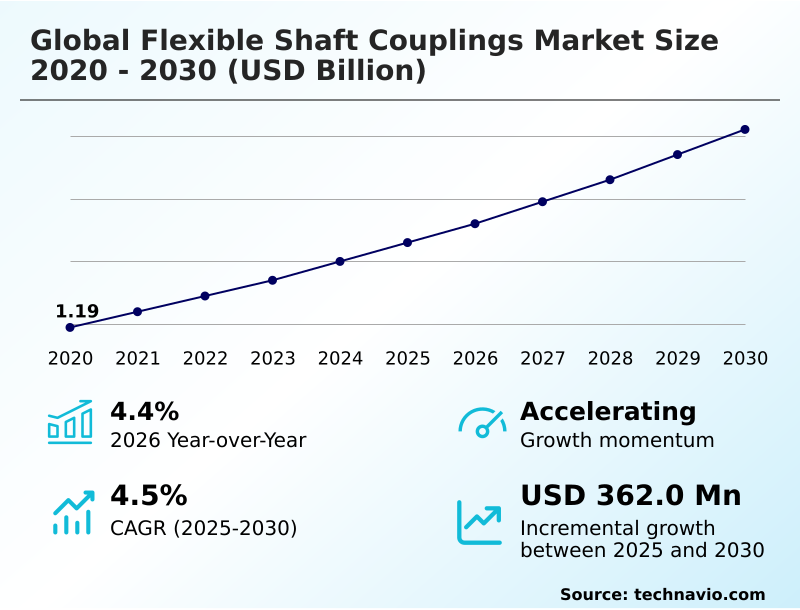
The flexible shaft couplings market size is valued to increase by USD 362 million, at a CAGR of 4.5% from 2025 to 2030. Industrial automation and precision engineering will drive the flexible shaft couplings market.
Major Market Trends & Insights
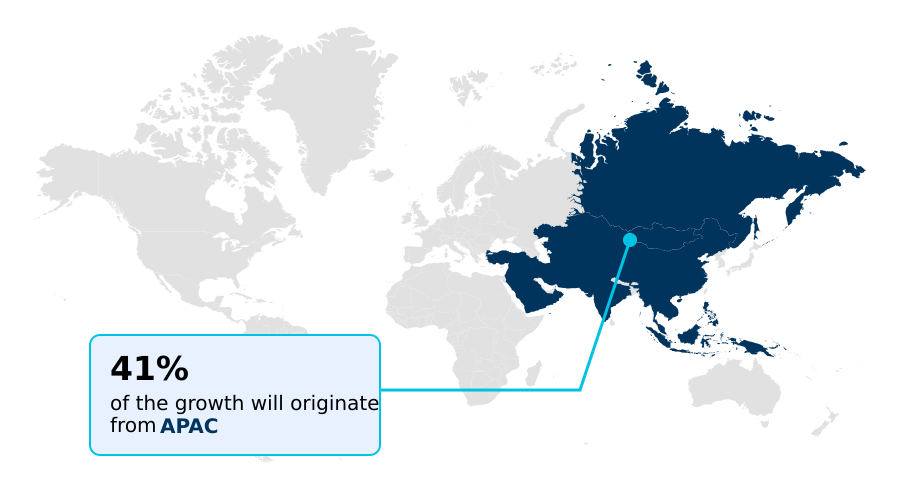
- APAC dominated the market and accounted for a 40.7% growth during the forecast period.
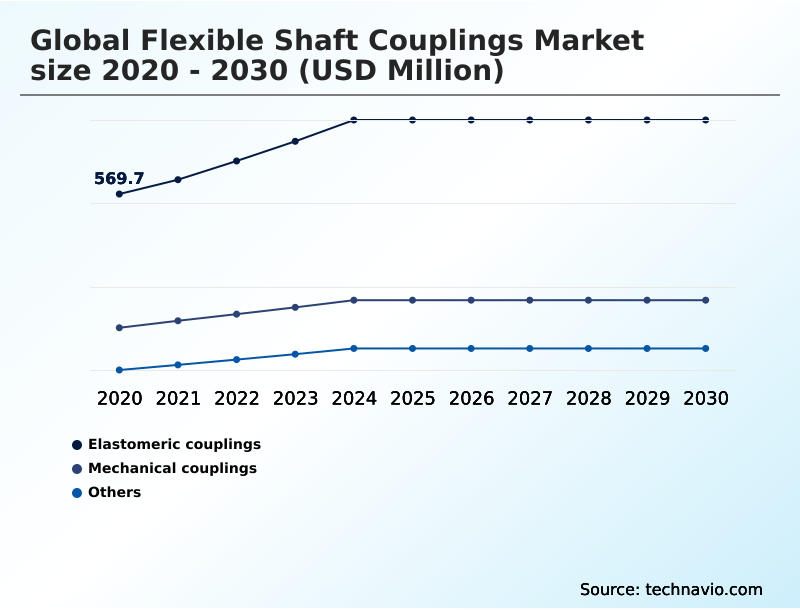
- By Product - Elastomeric couplings segment was valued at USD 692.7 million in 2024
- By Application - Oil and gas industry segment accounted for the largest market revenue share in 2024
Market Size & Forecast
- Market Opportunities: USD 627.5 million
- Market Future Opportunities: USD 362 million
- CAGR from 2025 to 2030 : 4.5%
Market Summary
- The flexible shaft couplings market is undergoing a significant transformation, driven by the dual imperatives of mechanical precision and digital integration. These components are fundamental to power transmission systems, ensuring the reliable transfer of torque while compensating for shaft misalignment and dampening vibrations.
- The evolution from passive mechanical links to intelligent components is a defining characteristic of the market's current trajectory. In sectors like renewable energy, specialized couplings in wind turbine drivetrains are essential for managing variable torque loads and protecting gearboxes, contributing to greater grid stability. A prime business scenario involves a large-scale power generation facility implementing smart couplings with embedded sensors.
- This allows for real-time condition monitoring, enabling a shift from scheduled maintenance to a predictive model. By analyzing data on vibration and temperature, operators can anticipate component fatigue and intervene proactively, preventing catastrophic failures and minimizing costly, unplanned downtime, ultimately enhancing overall equipment effectiveness and extending asset lifespan.
What will be the Size of the Flexible Shaft Couplings Market during the forecast period?
Get Key Insights on Market Forecast (PDF) Get Free Sample
How is the Flexible Shaft Couplings Market Segmented?
The flexible shaft couplings industry research report provides comprehensive data (region-wise segment analysis), with forecasts and estimates in "USD million" for the period 2026-2030, as well as historical data from 2020-2024 for the following segments.
- Product
- Elastomeric couplings
- Mechanical couplings
- Others
- Application
- Oil and gas industry
- Power plants
- Mining and metal industry
- Others
- End-user
- Tire manufacturing
- Steel industry
- Power and energy
- Automotive industry
- Others
- Type
- Compensating
- Stepper and servo motors
- Fans and blowers
- Geography
- APAC
- China
- Japan
- India
- Europe
- Germany
- UK
- France
- North America
- US
- Canada
- Mexico
- South America
- Brazil
- Argentina
- Middle East and Africa
- Saudi Arabia
- UAE
- South Africa
- Rest of World (ROW)
- APAC
By Product Insights
The elastomeric couplings segment is estimated to witness significant growth during the forecast period.
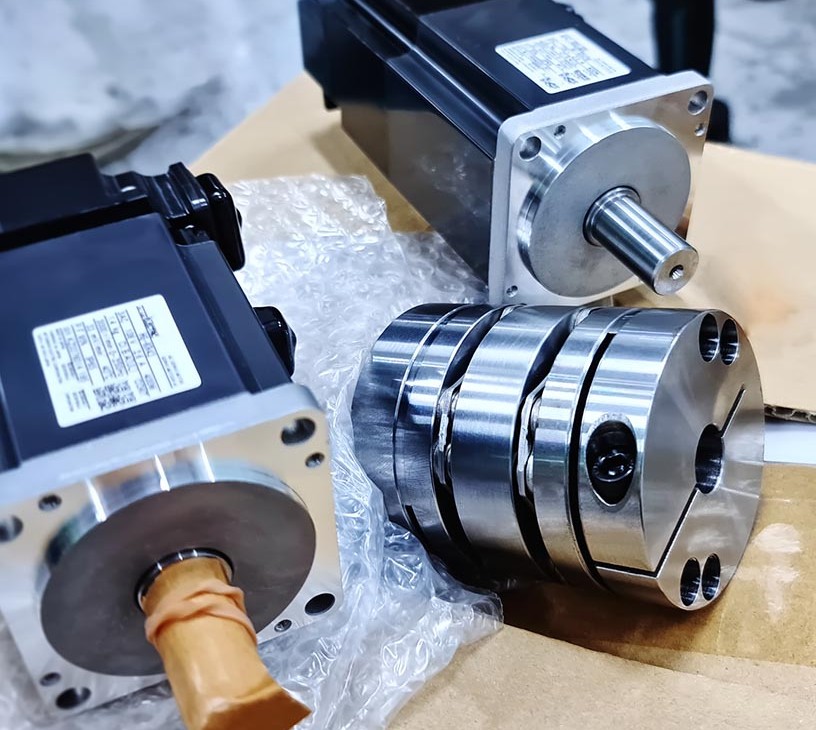
Elastomeric couplings are vital for enhancing system integrity in modern electromechanical systems by providing superior vibration dampening and shock absorption.
These components, including variants like jaw couplings, are engineered to manage misalignment compensation, effectively protecting rotating equipment from damaging shock loads and extending operational life.
Their design focuses on maximizing power density in a compact form, which is crucial for applications where space is limited but performance cannot be compromised.
By utilizing advanced polymers, these couplings deliver a favorable total cost ofownership through reduced maintenance needs.
Strategic implementation of these components has been shown to improve operational efficiency by up to 12% in high-cycle industrial machinery, directly impacting mechanical longevity and the smooth transfer of rotational power.
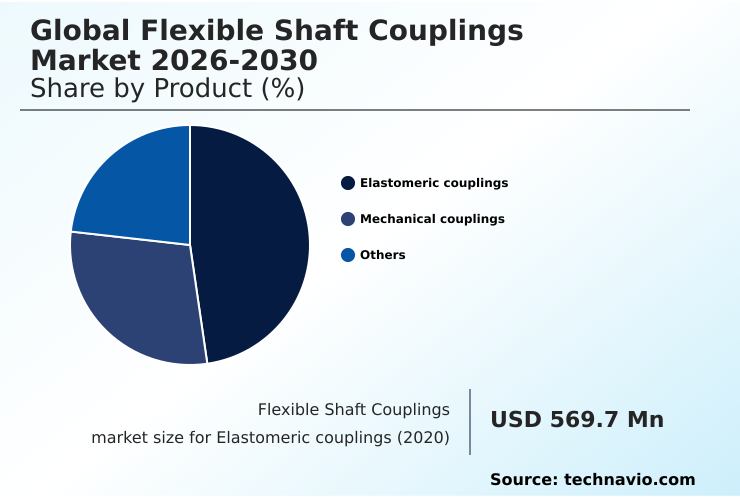
The Elastomeric couplings segment was valued at USD 692.7 million in 2024 and showed a gradual increase during the forecast period.
Regional Analysis
APAC is estimated to contribute 40.7% to the growth of the global market during the forecast period.Technavio’s analysts have elaborately explained the regional trends and drivers that shape the market during the forecast period.
See How Flexible Shaft Couplings Market Demand is Rising in APAC Get Free Sample
The geographic landscape is dominated by APAC, which accounts for over 40% of the market's incremental growth, driven by rapid industrialization in the oil and gas industry and mining and metal industry in countries like China and India.
This region's demand centers on robust mechanical couplings and grid couplings capable of withstanding harsh conditions and significant shaft misalignment.
In contrast, Europe and North America, which collectively represent more than 50% of the market opportunity, are mature regions focused on high-precision, zero-backlash components for servo motor applications.
In these markets, there is a strong emphasis on achieving high torsional rigidity and superior mechanical longevity through the use of advanced chain couplings and lubrication-free designs.
The North American market contributes nearly 24% of growth, underscoring its focus on high-value power generation sector upgrades and specialized axle-to-axle transmission systems.
Market Dynamics
Our researchers analyzed the data with 2025 as the base year, along with the key drivers, trends, and challenges. A holistic analysis of drivers will help companies refine their marketing strategies to gain a competitive advantage.
- Selecting the appropriate component requires a detailed analysis of application-specific demands, balancing flexibility and torsional stiffness. For instance, the benefits of composite flexible shaft couplings are most apparent in applications where weight and inertia are critical, whereas high-torque gear couplings for mining are chosen for their sheer robustness.
- The rise of IIoT-enabled smart coupling systems is transforming maintenance paradigms, allowing for effective predictive maintenance with smart couplings that can prevent failures before they occur. These systems offer sophisticated vibration analysis for flexible couplings, helping in reducing component fatigue in flexible couplings.
- Simultaneously, material science advancements in couplings are enabling new possibilities, from miniaturized couplings for precision robotics to specialized flexible couplings for renewable energy. In industries like food processing, non-lubricated couplings for clean environments are becoming standard. This trend is also seen with the development of alternative technologies to mechanical couplings, such as magnetic drives.
- However, for many, managing shaft misalignment in industrial automation remains a primary function. In electric vehicles, flexible shaft couplings in EV drivetrains are crucial for performance, while in other power transmission systems, the focus is on shock absorption.
- The ongoing challenge for manufacturers is mitigating the impact of raw material costs on couplings while optimizing the total cost of ownership with couplings for end-users. Businesses that successfully navigate these complexities, often see a twofold improvement in equipment reliability compared to those using outdated components.
What are the key market drivers leading to the rise in the adoption of Flexible Shaft Couplings Industry?
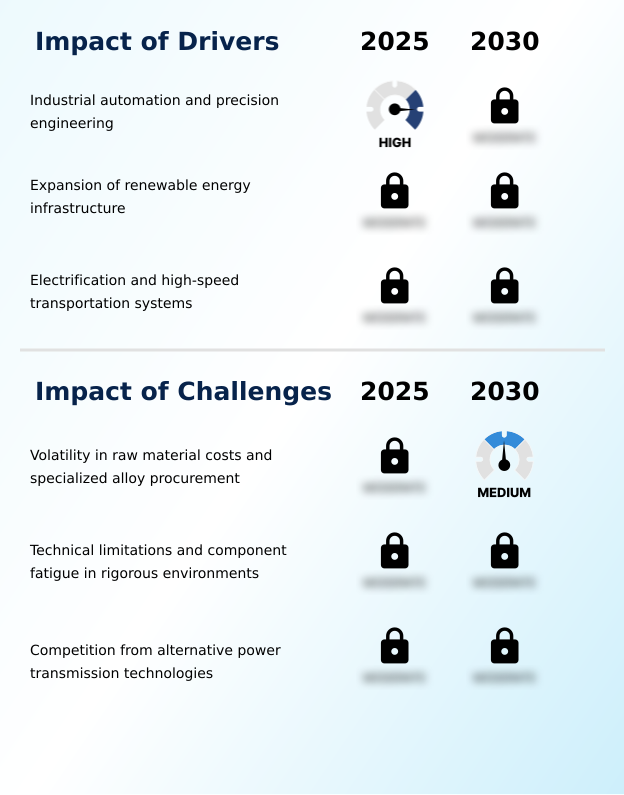
- The increasing adoption of industrial automation and the growing demand for precision engineering are key drivers propelling the growth of the flexible shaft couplings market.
- The market's growth is fundamentally driven by the expansion of industrial automation and the global transition toward electrification and renewable energy infrastructure.
- In automated manufacturing and motion control systems, the necessity for precise power transmission and torque transmission has led to a 20% increase in the adoption of high-performance couplings over the last three years.
- The burgeoning electric vehicle market requires specialized electric vehicle drivetrains that can handle high speeds and instantaneous torque, while the aerospace applications sector demands lightweight yet robust solutions.
- In the renewable energy sector, wind turbine drivetrains depend on advanced couplings to manage variable loads, improving gearbox longevity by an estimated 15%.
- This convergence of high-torque applications and the need for greater energy efficiency solidifies the role of advanced drive technology in modern industry.
What are the market trends shaping the Flexible Shaft Couplings Industry?
- The integration of intelligent condition monitoring and the Industrial Internet of Things (IIoT) is an emerging trend. This development is reshaping predictive maintenance strategies and enhancing operational efficiency within the market.
- Key trends are reshaping the market, driven by advancements in advanced material science and the demand for smarter, more efficient components. The integration of IIoT integration for predictive maintenance is paramount, with systems utilizing embedded condition monitoring sensors improving diagnostic accuracy by up to 35%. This move towards maintenance-free operation is enabling higher uptime in critical mechatronics systems.
- Simultaneously, the trend of miniaturization, fueled by the medical device industry and precision robotics, is pushing the development of compact bellows couplings. The use of high-performance composites in driveline components has resulted in solutions that are 25% lighter than traditional metallic counterparts, enhancing precision engineering.
- These innovations collectively allow for more sophisticated and reliable motion control, extending the application of flexible couplings into new high-tech domains.
What challenges does the Flexible Shaft Couplings Industry face during its growth?
- Volatility in raw material costs and logistical challenges in the procurement of specialized alloys present a significant restraint on the flexible shaft couplings market's growth.
- The market faces considerable headwinds from raw material procurement volatility and the threat of alternative power transmission technologies. Unpredictable price fluctuations for specialized alloys have increased manufacturing costs by as much as 15% for certain gear couplings and disc couplings, impacting profit margins.
- Furthermore, technical limitations related to component fatigue and the need for robust fail-safe design in heavy industrial applications remain a persistent engineering challenge. The increasing adoption of direct-drive motors in precision applications poses a significant challenge, as these systems can offer a 10% improvement in energy efficiency by eliminating mechanical linkages entirely.
- In sectors requiring hygienic design, such as food processing, the higher initial cost of specialized wash-down environment couplings can also deter adoption, despite their long-term benefits.
Exclusive Technavio Analysis on Customer Landscape
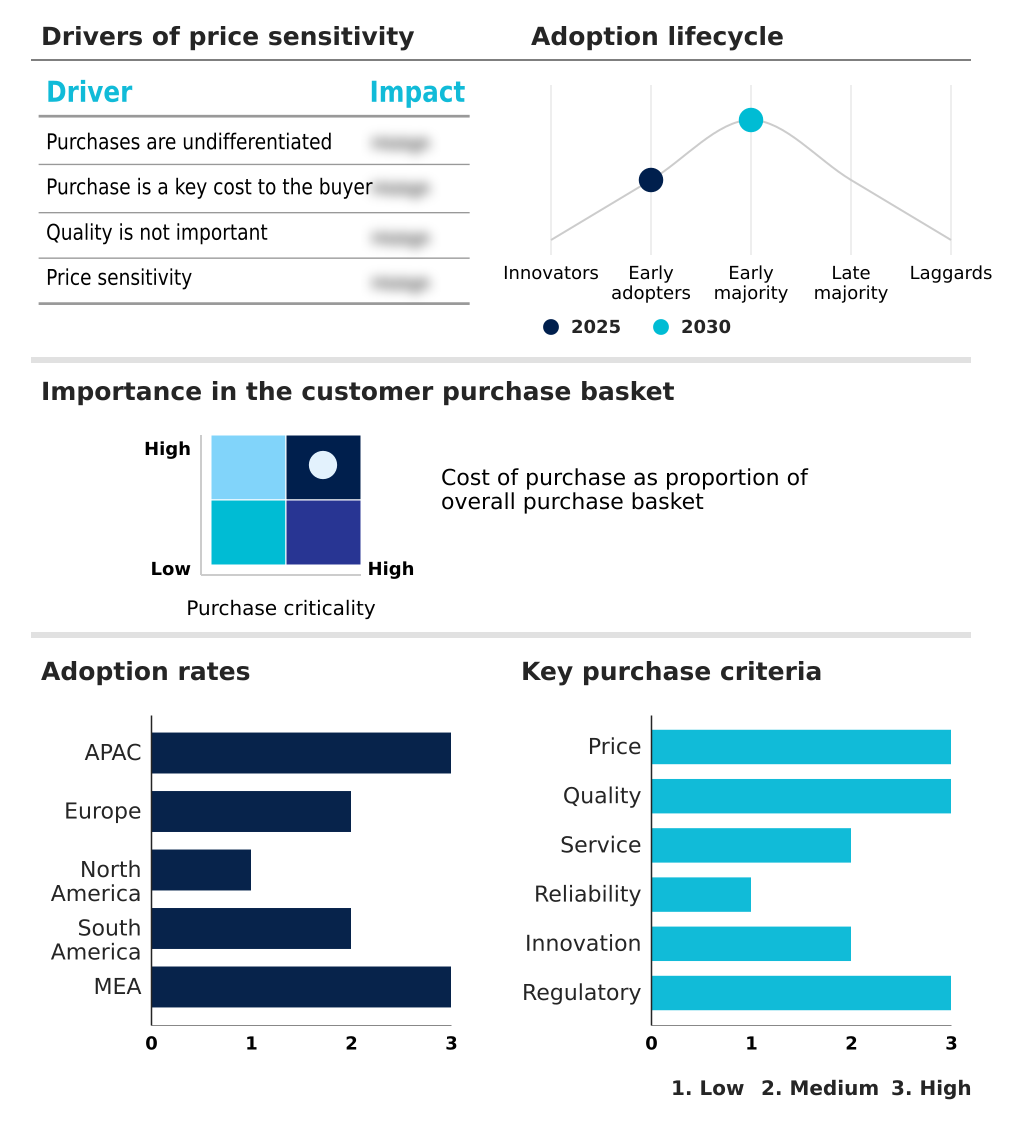
The flexible shaft couplings market forecasting report includes the adoption lifecycle of the market, covering from the innovator’s stage to the laggard’s stage. It focuses on adoption rates in different regions based on penetration. Furthermore, the flexible shaft couplings market report also includes key purchase criteria and drivers of price sensitivity to help companies evaluate and develop their market growth analysis strategies.
Customer Landscape of Flexible Shaft Couplings Industry
Competitive Landscape
Companies are implementing various strategies, such as strategic alliances, flexible shaft couplings market forecast, partnerships, mergers and acquisitions, geographical expansion, and product/service launches, to enhance their presence in the industry.
ABB Ltd. - The portfolio includes a diverse range of flexible shaft couplings, such as dodge grid, gear, and elastomeric variants, designed for various industrial power transmission needs.
The industry research and growth report includes detailed analyses of the competitive landscape of the market and information about key companies, including:
- ABB Ltd.
- Cross Morse
- GAM Enterprises Inc.
- Huco Dynatork
- JAKOB Antriebstechnik GmbH
- John Crane Inc.
- KTR Systems GmbH
- Lenze SE
- Lovejoy Inc
- R W Antriebselemente GmbH
- Regal Rexnord Corp.
- Renold Plc
- Siemens AG
- SKF AB
- Stafford Manufacturing Corp
- The Timken Co.
- Tsubakimoto Chain Co.
- Voith GmbH and Co. KGaA
- VULKAN Group
- Zero Max Inc.
Qualitative and quantitative analysis of companies has been conducted to help clients understand the wider business environment as well as the strengths and weaknesses of key industry players. Data is qualitatively analyzed to categorize companies as pure play, category-focused, industry-focused, and diversified; it is quantitatively analyzed to categorize companies as dominant, leading, strong, tentative, and weak.
Recent Development and News in Flexible shaft couplings market
- In August, 2025, Regal Rexnord and ABB Robotics collaborated to simplify the integration of GoFa cobots into 7th Axis Cobot Transfer Units, incorporating Huco couplings and other Regal Rexnord components to enhance automation.
- In May, 2025, The International Energy Agency's Global EV Outlook projected that global electric car sales would exceed 20 million units, driving demand for high-speed flexible couplings in e-mobility.
- In March, 2025, Regal Rexnord introduced the CENTAFLEX-TIR, a new roller coupling designed to address increased torsional vibrations in modern, lower-emission industrial machinery engines.
- In February, 2025, KTR Systems GmbH launched the VAROLASTIC, a highly flexible flange coupling with progressive torsion spring stiffness, targeting variable load requirements in construction and agricultural machinery.
Dive into Technavio’s robust research methodology, blending expert interviews, extensive data synthesis, and validated models for unparalleled Flexible Shaft Couplings Market insights. See full methodology.
| Market Scope | |
|---|---|
| Page number | 328 |
| Base year | 2025 |
| Historic period | 2020-2024 |
| Forecast period | 2026-2030 |
| Growth momentum & CAGR | Accelerate at a CAGR of 4.5% |
| Market growth 2026-2030 | USD 362.0 million |
| Market structure | Fragmented |
| YoY growth 2025-2026(%) | 4.4% |
| Key countries | China, Japan, India, South Korea, Indonesia, Australia, Germany, UK, France, Italy, Russia, Spain, US, Canada, Mexico, Brazil, Argentina, Chile, Saudi Arabia, UAE, South Africa, Turkey and Egypt |
| Competitive landscape | Leading Companies, Market Positioning of Companies, Competitive Strategies, and Industry Risks |
Research Analyst Overview
- The market is advancing beyond its traditional role in power transmission, evolving into a critical enabler of intelligent and efficient industrial operations. The integration of IIoT integration and predictive maintenance capabilities is redefining the value proposition, shifting the focus from simple mechanical functionality to data-driven asset management.
- Components like bellows couplings and disc couplings are being engineered with greater precision, achieving higher power density and superior misalignment compensation. This push for performance is evident in the development of high-performance composites and specialized metallic membrane couplings.
- For executive leadership, the decision to invest in this new generation of smart rotating equipment represents a strategic move toward enhancing operational resilience. By leveraging real-time condition monitoring, firms can transition from a reactive to a proactive maintenance posture, with some achieving over a 25% reduction in unplanned downtime.
- This directly impacts the bottom line by improving equipment uptime and extending the lifecycle of critical machinery, making the adoption of advanced jaw couplings and fail-safe designs a key competitive differentiator in a landscape focused on optimization.
What are the Key Data Covered in this Flexible Shaft Couplings Market Research and Growth Report?
-
What is the expected growth of the Flexible Shaft Couplings Market between 2026 and 2030?
-
USD 362 million, at a CAGR of 4.5%
-
-
What segmentation does the market report cover?
-
The report is segmented by Product (Elastomeric couplings, Mechanical couplings, and Others), Application (Oil and gas industry, Power plants, Mining and metal industry, and Others), End-user (Tire manufacturing, Steel industry, Power and energy, Automotive industry, and Others), Type (Compensating, Stepper and servo motors, and Fans and blowers) and Geography (APAC, Europe, North America, South America, Middle East and Africa)
-
-
Which regions are analyzed in the report?
-
APAC, Europe, North America, South America and Middle East and Africa
-
-
What are the key growth drivers and market challenges?
-
Industrial automation and precision engineering, Volatility in raw material costs and specialized alloy procurement
-
-
Who are the major players in the Flexible Shaft Couplings Market?
-
ABB Ltd., Cross Morse, GAM Enterprises Inc., Huco Dynatork, JAKOB Antriebstechnik GmbH, John Crane Inc., KTR Systems GmbH, Lenze SE, Lovejoy Inc, R W Antriebselemente GmbH, Regal Rexnord Corp., Renold Plc, Siemens AG, SKF AB, Stafford Manufacturing Corp, The Timken Co., Tsubakimoto Chain Co., Voith GmbH and Co. KGaA, VULKAN Group and Zero Max Inc.
-
Market Research Insights
- Market dynamics are shaped by a convergence of advanced material science and the persistent demand for enhanced operational efficiency. The adoption of innovative driveline components that promise maintenance-free operation is a key consideration for industries seeking to optimize their total cost of ownership. For instance, facilities that upgrade to lubrication-free designs have reported a 15% reduction in associated maintenance expenditures.
- Simultaneously, the push for greater energy efficiency in electromechanical systems is compelling manufacturers to produce lightweight yet robust solutions. In high-torque applications, the use of specialized alloys has been shown to improve mechanical longevity by over 20% compared to conventional materials.
- This balance between durability and performance is critical as industries from automotive manufacturing to the power generation sector increasingly rely on precision-engineered solutions to maintain system integrity and competitive advantage in a rapidly evolving industrial landscape.
We can help! Our analysts can customize this flexible shaft couplings market research report to meet your requirements.
 RIA -
RIA - 
