
Australia Foodservice Market Size 2025-2029
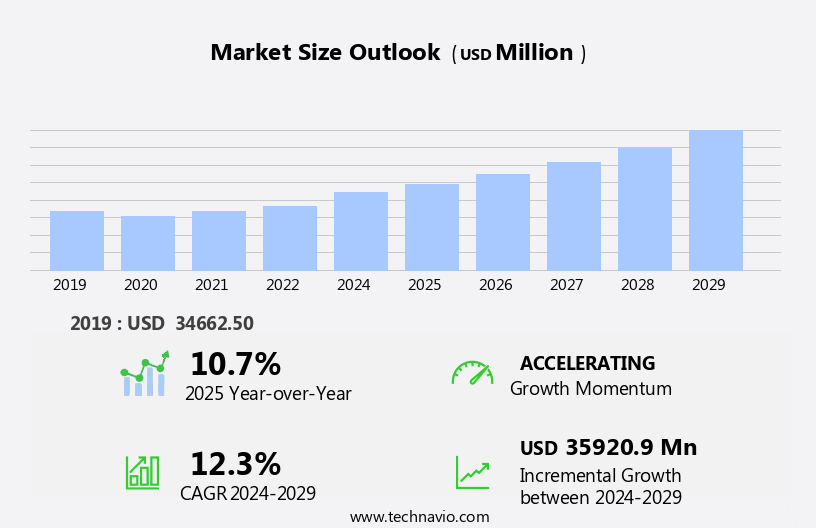
The Australia foodservice market size is forecast to increase by USD 35.92 billion at a CAGR of 12.3% between 2024 and 2029.
- The Foodservice Market is experiencing significant growth driven by changing consumer lifestyles and the increasing demand for convenient food solutions. With more individuals leading busy lives, the need for quick and easy meal options has increased, leading to the expansion of the foodservice industry. Another key trend shaping the market is the rising preference for gluten-free fast foods. This demand is being fueled by an increasing number of people diagnosed with celiac disease or gluten intolerance, as well as those following gluten-free diets for health reasons. However, the market faces challenges as well. Regulatory hurdles impact adoption due to stringent food safety regulations and the need for compliance.
- Supply chain inconsistencies also temper growth potential, as maintaining a steady supply of raw materials and ingredients is crucial for businesses to meet customer demand. Companies seeking to capitalize on market opportunities must focus on innovation, ensuring they offer a diverse range of convenient and health-conscious food options, while also addressing the challenges of regulatory compliance and supply chain management effectively. By doing so, they can position themselves as industry leaders and meet the evolving needs of their customers.
What will be the size of the Australia Foodservice Market during the forecast period?
- In the dynamic foodservice market, local sourcing and supply chain transparency are gaining traction, enabling restaurants to offer fresher, more sustainable menu items. Subscription services and personalized dining experiences are also on the rise, with food tech startups leveraging technology to deliver customized recommendations based on food allergies, intolerances, and nutritional preferences. Employee engagement is a key focus for corporate catering, with brands building loyalty through personalized menus and nutrition information. Smart kitchens are revolutionizing foodservice operations through automation and kitchen technology, including voice ordering, kitchen automation, and biometric authentication. Food waste recycling and sustainable food practices are essential for businesses seeking to reduce their environmental footprint and enhance their customer experience.
- Food sourcing and traceability are critical components of brand building, with blockchain technology providing a secure and transparent solution. Augmented reality (AR) and virtual reality (VR) are transforming event planning and menu customization, offering experiences for customers. Mobile payments and food delivery drones streamline the ordering and delivery process, ensuring customer retention and convenience. Personalized recommendations and sustainable practices are shaping the future of foodservice, with food tech startups at the forefront of innovation. Corporate catering and brand building require a focus on employee engagement and nutrition information, while smart kitchens and food traceability offer operational efficiencies and transparency.
- The foodservice market is constantly evolving, with technology playing a pivotal role in enhancing the customer experience and driving growth.
How is this market segmented?
The market research report provides comprehensive data (region-wise segment analysis), with forecasts and estimates in "USD million" for the period 2025-2029, as well as historical data from 2019-2023 for the following segments.
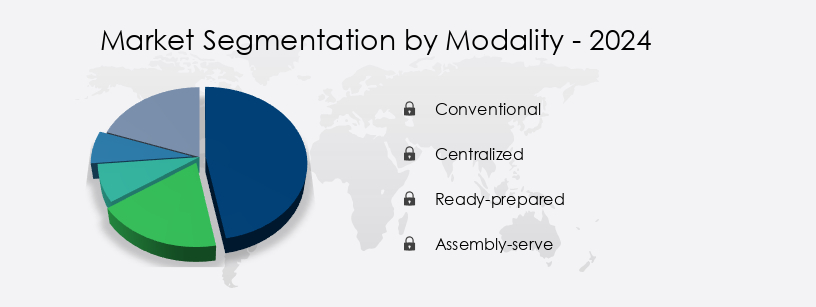
- Modality
- Conventional
- Centralized
- Ready-prepared
- Assembly-serve
- Sector
- Commercial
- Non-commercial
- Type
- Fast foodservice
- Cafes and bars
- Restaurants
- Delivery and takeaway
- Others
- Geography
- APAC
- Australia
- APAC
By Modality Insights
The conventional segment is estimated to witness significant growth during the forecast period.
The foodservice market encompasses various segments, with the conventional system being the most prevalent. In this system, ingredients are prepared and served on the same premises, ensuring freshness and customization for customers. Food is maintained at appropriate temperatures before serving and may be quickly heated prior. This system is commonly utilized in schools, universities, restaurants, and cafeterias, with the food being distributed to dining areas or lunch counters. Digital marketing plays a significant role in foodservice businesses, enabling targeted campaigns and brand loyalty programs. Food labeling, a crucial aspect of food safety and regulation compliance, is streamlined through digital technologies.
Restaurant chains leverage digital menu boards for real-time menu engineering and pricing strategies. Food trucks and cloud kitchens offer alternative business models, focusing on delivery services and operational efficiency. Review management and online reputation are essential for maintaining a competitive advantage. Social media marketing and employee training are vital components of a robust marketing strategy. Restaurant technology includes automation, inventory management, and kitchen equipment. Predictive analytics and data analytics help optimize revenue growth and cost savings. Franchise models and food safety regulations govern the industry, while independent restaurants and healthcare foodservice cater to specific markets. Catering services, meal kits, and prepared meals cater to diverse customer needs.
Fine dining and casual dining establishments prioritize culinary innovation and customer service. Energy efficiency and supply chain management are essential for sustainable operations. Food waste reduction and food safety are ongoing concerns, addressed through various strategies such as menu engineering, food storage, and dishwashing equipment. Self-service kiosks and cashless payments offer convenience and streamlined operations. In the hospitality industry, table management systems and customer service are crucial for enhancing the dining experience. Pricing strategies and foodservice equipment are essential for operational efficiency. Food trends and cost optimization are ongoing considerations for businesses in this sector.
Get a glance at the market share of various segments Request Free Sample
The Conventional segment was valued at USD 11343.00 million in 2019 and showed a gradual increase during the forecast period.
Market Dynamics
Our researchers analyzed the data with 2024 as the base year, along with the key drivers, trends, and challenges. A holistic analysis of drivers will help companies refine their marketing strategies to gain a competitive advantage.
What are the key market drivers leading to the rise in the adoption of Foodservice in Australia Industry?
- The increasing preference for convenient food options and shifting lifestyles are primary factors fueling market growth. The foodservice market is experiencing significant growth due to consumers' increasing preference for convenience and quick meals. In North America and various Asian countries, including Australia, the popularity of quick service restaurants (QSRs) is on the rise. This trend can be attributed to the hectic lifestyles and responsibilities of consumers, leaving them with limited time for cooking. The demand for on-the-go food is increasing, driven by the growing purchasing power of consumers and their desire for convenience. Energy efficiency, supply chain management, and allergen management are crucial aspects of the foodservice industry. In the healthcare foodservice sector, pricing strategies and food trends are essential factors influencing consumer choices.
- The hospitality industry, including fine dining and casual dining establishments, is focusing on culinary innovation and customer service to differentiate themselves. Foodservice equipment and table management systems are essential tools for optimizing inventory management and cost savings. The hospitality industry is also emphasizing cost optimization and sustainability to remain competitive. Overall, the foodservice market is dynamic and constantly evolving, with a focus on meeting the changing needs and preferences of consumers.
What are the market trends shaping the Foodservice in Australia Industry?
- The trend in the food industry is shifting towards an increased demand for gluten-free options in fast food. This emerging market trend reflects the growing awareness and concern for dietary restrictions among consumers. The foodservice market in various regions is experiencing a shift towards healthier food options. In Australia, there is a growing trend towards using ingredients such as aluminum-free baking powder, gluten-free flour, and organic flour in fast food production. Although gluten-free fast foods are more expensive due to higher manufacturing costs and raw material prices, their popularity among health-conscious consumers is driving market growth. Gluten, a protein found in wheat, barley, and rye, is commonly used in fast food manufacturing for items like pizzas, burgers, and sandwiches. It provides dough with pliability, shape retention, and softness.
- However, the increasing demand for gluten-free alternatives is compelling foodservice providers to invest in new technologies and equipment, such as digital marketing strategies, food labeling systems, and digital menu boards, to cater to this market segment. Additionally, restaurant chains are focusing on menu engineering, restaurant automation, and food safety to enhance the dining experience and gain a competitive advantage. The emergence of food trucks, delivery services, cloud kitchens, and baking and cooking equipment is further transforming the foodservice landscape. These trends underscore the importance of staying informed about market dynamics and consumer preferences to maintain a strong brand loyalty and remain competitive in the industry.
What challenges does the Foodservice in Australia Industry face during its growth?
- The increasing trend toward home-cooked meals poses a significant challenge to the expansion of the food industry. The foodservice market faces challenges from the growing preference for home-cooked meals among consumers, particularly Millennials and Baby Boomers. This trend is driven by increasing health consciousness and economic considerations. Home-cooked food is perceived to be healthier as it uses fresh, hygienic, and uncontaminated ingredients. In contrast, restaurant food, including fast-casual options, is often criticized for containing large amounts of unhealthy additives and high calorie counts. Additionally, home-cooked meals can be more cost-effective than dining out or ordering takeaway food. Restaurants are responding to these challenges by investing in technology to improve quality control, enhance the customer experience, and reduce food waste.
- This includes the use of review management systems, food delivery apps, mobile ordering, kitchen equipment, and dishwashing equipment. Predictive analytics and data analytics are also being used to optimize inventory management and menu planning. Moreover, some restaurants are exploring new business models such as ghost kitchens and hotel restaurants to reach new customer segments and expand their revenue streams. Franchise models are also being adopted to scale operations and improve efficiency. Loyalty programs are being used to retain customers and incentivize repeat business. Overall, the foodservice industry is undergoing significant transformation as it adapts to changing consumer preferences and competitive pressures.
Exclusive Customer Landscape
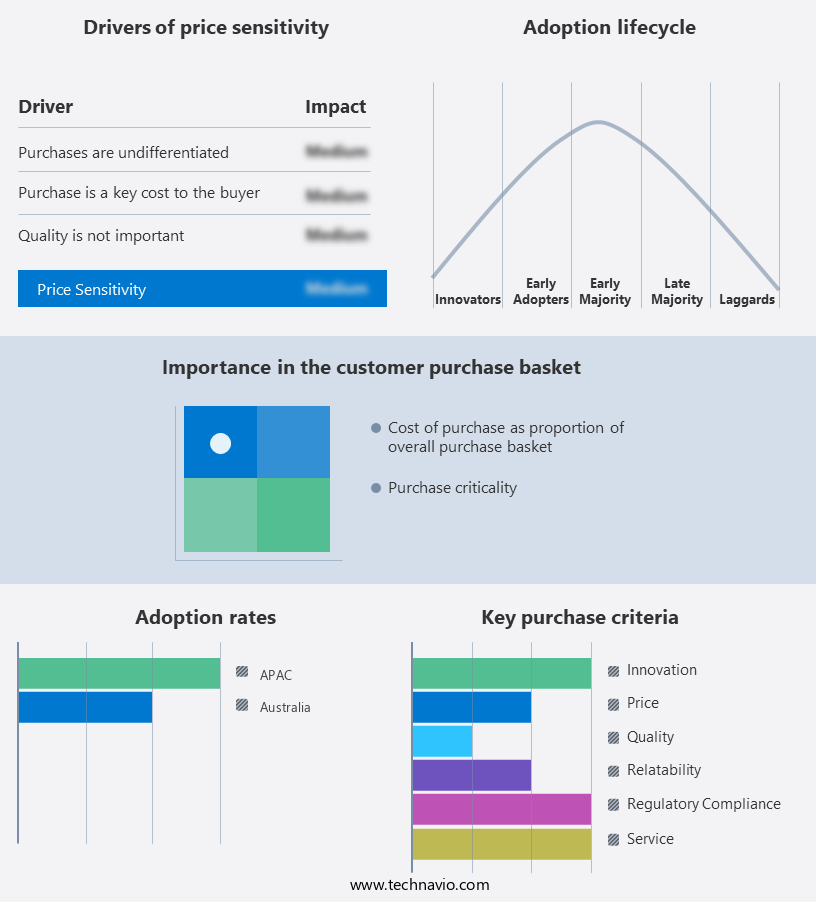
The foodservice market in Australia forecasting report includes the adoption lifecycle of the market, covering from the innovator’s stage to the laggard’s stage. It focuses on adoption rates in different regions based on penetration. Furthermore, the foodservice market in Australia report also includes key purchase criteria and drivers of price sensitivity to help companies evaluate and develop their market growth analysis strategies.
Customer Landscape
Key Companies & Market Insights
Companies are implementing various strategies, such as strategic alliances, foodservice market in Australia forecast, partnerships, mergers and acquisitions, geographical expansion, and product/service launches, to enhance their presence in the industry.
Bucking Bull - This company specializes in providing a diverse foodservice selection, featuring burgers, steaks, and salads.
The industry research and growth report includes detailed analyses of the competitive landscape of the market and information about key companies, including:
- Bucking Bull
- Craveable Brands
- Dominos Pizza Inc.
- Guzman Y Gomez Ltd
- Hungry Jacks Pty Ltd.
- Inspire Brands Inc.
- Krispy Kreme Inc.
- McDonald Corp.
- Nandos Group
- Pie Face
- Ribs and Burgers
- Starbucks Corp.
- The Subway Group
- YUM Brands Inc.
- Zambrero Group
Qualitative and quantitative analysis of companies has been conducted to help clients understand the wider business environment as well as the strengths and weaknesses of key industry players. Data is qualitatively analyzed to categorize companies as pure play, category-focused, industry-focused, and diversified; it is quantitatively analyzed to categorize companies as dominant, leading, strong, tentative, and weak.
Recent Development and News in Foodservice Market In Australia
- In February 2023, McDonald's announced the global rollout of its plant-based Beyond Meat McPlant burger, marking a significant strategic partnership and new product launch in the foodservice sector (McDonald's Corporation, 2023). This move follows the success of similar offerings from competitors, such as Burger King's Impossible Whopper and Starbucks' plant-based breakfast sandwiches.
- In October 2024, Grubhub and DoorDash merged, creating a leading on-demand food delivery platform, consolidating their market positions and enhancing their capabilities to compete against Uber Eats and other competitors (Grubhub, 2024). The combined entity will serve over 300,000 restaurant partners and reach approximately 70 million active diners.
- In March 2025, Amazon Go, Amazon's cashier-less convenience store concept, expanded its foodservice offerings by partnering with major food brands like PepsiCo, Nestle, and General Mills to sell their products in its stores (Amazon, 2025). This strategic collaboration allows Amazon to offer a wider variety of food options and attract a larger customer base, while providing food brands with valuable exposure and sales opportunities.
Research Analyst Overview
The foodservice market continues to evolve, with digital marketing playing a pivotal role in connecting restaurants and consumers. Food labeling, a crucial aspect of food safety and transparency, is increasingly digitized through QR codes and mobile apps. Digital menu boards offer real-time menu updates and customization, enhancing the dining experience. Restaurant chains leverage marketing campaigns and brand loyalty programs to engage customers, while school foodservice adapts to meet nutritional standards and student preferences. Baking equipment and menu engineering optimize offerings for revenue growth, and restaurant automation streamlines operations. Food safety remains a top priority, with technology enabling predictive analytics and real-time monitoring.
Food trucks and cloud kitchens disrupt traditional dining models, and delivery services cater to evolving consumer preferences. Dining experience is enhanced through technology, from table management systems to self-service kiosks. Competitive advantage lies in operational efficiency, achieved through kitchen equipment, inventory management, and labor management. Food waste reduction and energy efficiency are key concerns, addressed through innovative solutions and regulations. Catering services, hotel restaurants, and corporate dining adapt to the digital age, while independent restaurants leverage social media marketing and online reputation management. Machine learning and artificial intelligence enable personalized customer experiences and staff scheduling. Cashless payments, meal kits, and prepared meals cater to changing consumer behaviors and preferences. Pricing strategies, foodservice equipment, and hospitality industry trends continue to evolve, driven by culinary innovation and customer service.
Dive into Technavio’s robust research methodology, blending expert interviews, extensive data synthesis, and validated models for unparalleled Foodservice Market in Australia insights. See full methodology.
|
Market Scope |
|
|
Report Coverage |
Details |
|
Page number |
168 |
|
Base year |
2024 |
|
Historic period |
2019-2023 |
|
Forecast period |
2025-2029 |
|
Growth momentum & CAGR |
Accelerate at a CAGR of 12.3% |
|
Market growth 2025-2029 |
USD 35.92 billion |
|
Market structure |
Concentrated |
|
YoY growth 2024-2025(%) |
10.7 |
|
Key countries |
Australia |
|
Competitive landscape |
Leading Companies, Market Positioning of Companies, Competitive Strategies, and Industry Risks |
What are the Key Data Covered in this Foodservice Market in Australia Research and Growth Report?
- CAGR of the Foodservice in Australia industry during the forecast period
- Detailed information on factors that will drive the growth and forecasting between 2025 and 2029
- Precise estimation of the size of the market and its contribution of the industry in focus to the parent market
- Accurate predictions about upcoming growth and trends and changes in consumer behaviour
- Growth of the market across Australia
- Thorough analysis of the market’s competitive landscape and detailed information about companies
- Comprehensive analysis of factors that will challenge the foodservice market in Australia growth of industry companies
We can help! Our analysts can customize this foodservice market in Australia research report to meet your requirements.
 RIA -
RIA - 
