Forage Machinery Market Analysis Europe, North America, APAC, South America, Middle East and Africa - US, China, France, Germany, Italy - Size and Forecast 2024-2028

Forage Machinery Market Analysis Europe, North America, APAC, South America, Middle East and Africa - US, China, France, Germany, Italy - Size and Forecast 2024-2028

Published: May 2024 167 Pages SKU: IRTNTR77894

Market Overview at a Glance

$1.13 B
Market Opportunity
5.26%
CAGR
5.08
YoY growth 2023-2024(%)

Forage Machinery Market Size 2024-2028 

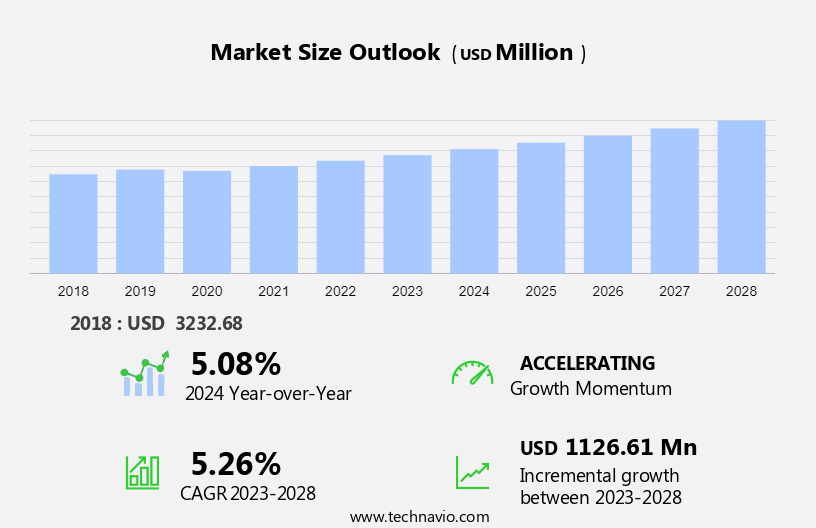
The forage machinery market size is forecast to increase by USD 1.13 billion at a CAGR of 5.26% between 2023 and 2028. The market is experiencing significant growth due to the increasing focus on food security and the adoption of precision farming techniques. Advanced technology, such as high-capacity product variants and conditioners, is driving innovation in the market. One notable trend is the emergence of autonomous forage machinery, which offers increased efficiency and productivity. Raw materials, such as grasses, legumes, and other vegetation, are harvested using disc mowers and mower conditioners. However, the high initial investments required for forage machinery can be a challenge for some farmers. Despite this, the benefits of improved forage harvesting technology are compelling, making it an essential investment for many agricultural operations. This market analysis report provides a comprehensive examination of the key growth factors, trends, and challenges shaping the market.

What will be the Size of the Market During the Forecast Period?

Forage Machinery Market Size

 Request Free Sample

The market plays a pivotal role in the agricultural sector of an agriculture-based country, facilitating the efficient production and processing of forage crops for livestock feed. Forage machinery, which includes mowers, balers, forage harvesters, rakes, tedders, feed mills, and related equipment, is integral to various farming activities. These machines ensure optimal cutting and conditioning of the crop, enhancing the overall quality of the forage. Balers and forage harvesters are then employed to collect and process the harvested material into bales or silage.

Furthermore, blowers and storage boxes facilitate the efficient transfer and storage of the forage, while moisture sensors help monitor the moisture content to ensure optimal storage conditions. Tires are an essential component of forage machinery, ensuring mobility and durability during various agricultural activities. Farmers in the commercial agriculture sector rely on forage machinery to maintain a foothold in their operations. The machines enable them to meet the demand for livestock feed and contribute to the overall productivity of their farms. Crop insurance and farm machinery are essential investments for farmers, and forage machinery is a significant portion of their farm equipment arsenal.

Moreover, the agricultural activities that involve forage machinery are diverse, ranging from dairy farming to beef cattle operations. The market growth is driven by the increasing demand for livestock products and the need for efficient farm operations. The market is expected to continue its importance in the agricultural sector, providing farmers with the tools they need to optimize their operations and maintain a competitive edge. In conclusion, the market is a crucial component of the agricultural sector, providing farmers with the necessary equipment to produce and process forage crops for livestock feed. The market includes various machines such as mowers, balers, forage harvesters, rakes, tedders, feed mills, and related equipment, all of which contribute to the overall efficiency and productivity of farming operations.

Market Segmentation

The market research report provides comprehensive data (region-wise segment analysis), with forecasts and estimates in "USD billion" for the period 2024-2028, as well as historical data from 2018-2022 for the following segments.

  • Product
    • Self-propelled forage harvester
    • Mounted-type forage harvester
  • End-user
    • Large farm
    • Small
    • medium farm
  • Geography
    • Europe
      • Germany
      • France
      • Italy
    • North America
      • US
    • APAC
      • China
    • South America
    • Middle East and Africa

By Product Insights

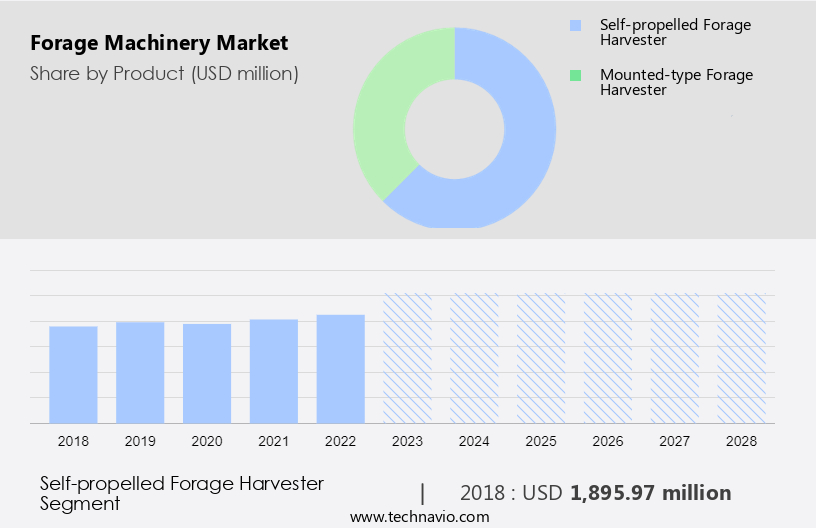
The self-propelled forage harvester segment is estimated to witness significant growth during the forecast period. Self-propelled forage harvesters play a significant role in the efficient and productive harvesting of forage crops on farms. These machines are engineered for speed, enabling farmers to process large quantities of raw materials in a short time. By automating harvesting tasks such as cutting, chopping, and loading, self-propelled forage harvesters reduce the need for manual labor, making farming operations more streamlined. Advancements in technology continue to drive demand for modern forage machinery. Features like precision farming capabilities, GPS guidance systems, auto-steering, and onboard diagnostics enhance performance, accuracy, and ease of use. Self-propelled forage harvesters are increasingly popular among farmers seeking advanced machinery solutions to optimize their operations.

Moreover, self-propelled forage harvesters are essential for feed mills, ensuring a consistent supply of high-quality forage materials. By investing in these machines, farmers can improve their overall productivity and competitiveness in the market. With the continuous advancements in technology, self-propelled forage harvesters are expected to maintain their foothold in the farming industry.

Forage Machinery Market Size

Get a glance at the market share of various segments Request Free Sample

The self-propelled forage harvester segment was valued at USD 1.9 billion in 2018 and showed a gradual increase during the forecast period.

Regional Insights

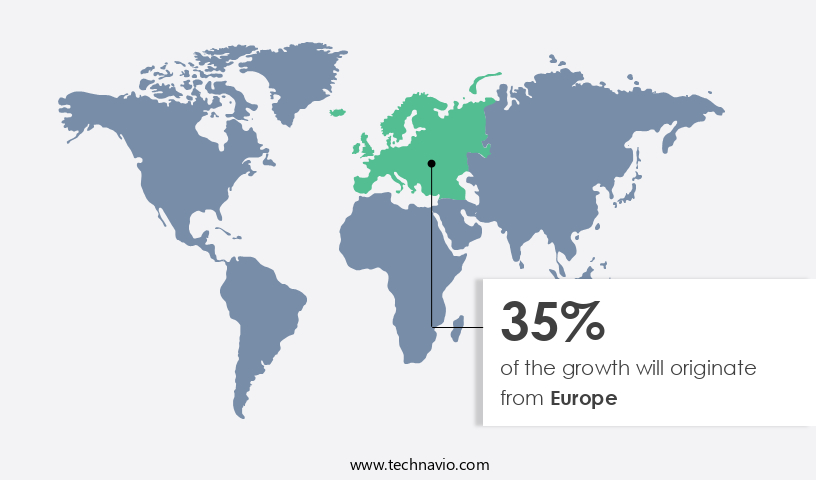
Europe is estimated to contribute 35% to the growth of the global market during the forecast period. Technavio's analysts have elaborately explained the regional trends and drivers that shape the market during the forecast period.

Forage Machinery Market Share by Geography

For more insights on the market share of various regions Request Free Sample

In agriculture-based countries like the United States, the commercial agriculture sector relies heavily on forage crops, such as grasses and legumes, for livestock feed. The efficiency of harvesting, processing, and storing these crops is essential to meet the nutritional demands of livestock and maximize productivity. Intensive farming practices are common in the US, where farmers aim to optimize yields on limited land. Forage machinery, including self-propelled balers and self-propelled forage harvesters, plays a vital role in managing forage crops, improving feed quality, and enhancing feed utilization for livestock. The demand for advanced harvesting, processing, and storage equipment continues to grow as farmers seek to streamline their operations and increase efficiency.

Our researchers analyzed the data with 2023 as the base year, along with the key drivers, trends, and challenges. A holistic analysis of drivers will help companies refine their marketing strategies to gain a competitive advantage.

Market Driver

Advancements in forage harvesting technology are the key drivers of the market. The market experiences continuous advancements, boosting productivity and innovation. Notable advancements include the integration of precision chopping technology in modern forage harvesters. This technology ensures accurate and uniform cutting of forage crops, enhancing forage quality, digestibility, and reducing feed wastage.

Also, another significant development is Variable Rate Technology (VRT), which allows forage machinery to adjust cutting parameters based on real-time conditions and crop characteristics. VRT optimizes efficiency in forage harvesting, minimizes fuel consumption, and maximizes yield, contributing to enhanced profitability for farmers. Additionally, advanced features such as disc mowers, mower conditioners, blowers, and storage boxes equipped with moisture sensors improve overall forage handling and storage efficiency. These advancements underscore the importance of technology in the market and its role in driving sustainable agricultural practices.

Market Trends

The emergence of autonomous forage machinery is the upcoming trend in the market. Autonomous forage machinery, including self-driving tractors, harvesters, and balers, brings about significant advancements in forage production and harvesting processes. These machines operate continuously without human intervention, optimizing forage production and streamlining operations.

Moreover, by minimizing the requirement for manual labor, farmers can address labor shortages and decrease labor expenses. The automation of repetitive tasks allows farmers to reallocate human resources to more complex and strategic activities, ultimately increasing overall farm productivity. Furthermore, autonomous forage machinery is typically outfitted with advanced farming technologies, such as GPS guidance systems, sensors, and data analytics capabilities. These technologies facilitate precise field mapping, real-time monitoring, and data-driven decision-making, leading to enhanced accuracy, efficiency, and yield in forage production.

Market Challenge

High initial investments associated with forage machinery are key challenges affecting the market growth. Advanced forage machinery development necessitates substantial investments in research, engineering, and testing to enhance product attributes, performance, and productivity. Manufacturing these machines involves considerable capital expenditures on facilities, equipment, and materials. The cost structure includes raw material procurement, fabrication, assembly, quality control, and logistics.

However, high upfront investments pose a significant financial challenge for farmers, particularly those in regions like Africa and Latin America, who may have limited access to financing. This financial burden can result in delayed purchases, lower adoption rates, or continued use of outdated machinery. To address this challenge, it's crucial for manufacturers to collaborate with financial institutions and governments to provide affordable financing options for farmers.

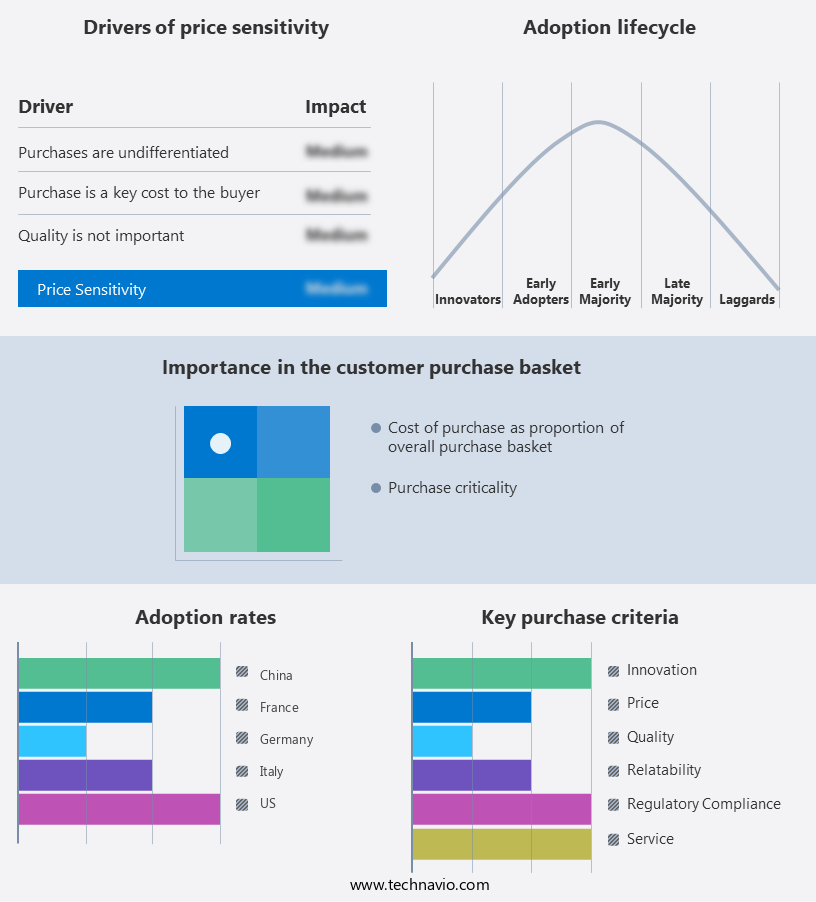
Exclusive Customer Landscape

The market forecasting report includes the adoption lifecycle of the market, covering from the innovator's stage to the laggard's stage. It focuses on adoption rates in different regions based on penetration. Furthermore, the report also includes key purchase criteria and drivers of price sensitivity to help companies evaluate and develop their market growth analysis strategies.

Forage Machinery Market Share by Geography

 Customer Landscape

Key Companies & Market Insights

Companies are implementing various strategies, such as strategic alliances, partnerships, mergers and acquisitions, geographical expansion, and product/service launches, to enhance their presence in the market.

Bucher Industries AG: The company offers forage machinery solutions such as forage harvesting, livestock bedding and feeding as well as landscape maintenance.

The market research and growth report includes detailed analyses of the competitive landscape of the market and information about key companies, including:

  • AGCO Corp.
  • ARGO HYTOS Group AG
  • Buhler Industries Inc.
  • Caterpillar Inc.
  • CLAAS KGaA mBH
  • CNH Industrial N.V.
  • Deere and Co.
  • Farmking
  • Gomselmash India Pvt Ltd.
  • ISEKI and Co. Ltd.
  • Kubota Corp.
  • Lely International NV
  • Mahindra and Mahindra Ltd.
  • Maschinenfabrik Bernard KRONE GmbH and Co.KG
  • POTTINGER Landtechnik GmbH
  • Rostselmash
  • SDF SpA
  • Vermeer Corp.
  • Yanmar Holdings Co. Ltd.

Qualitative and quantitative analysis of companies has been conducted to help clients understand the wider business environment as well as the strengths and weaknesses of key market players. Data is qualitatively analyzed to categorize companies as pure play, category-focused, industry-focused, and diversified; it is quantitatively analyzed to categorize companies as dominant, leading, strong, tentative, and weak.

Research Analyst Overview

The market plays a significant role in the agricultural sector of an agriculture-based country, catering to the needs of farmers in commercial agriculture and small-scale farming activities. Forage machinery includes various types of machines such as mowers, balers, forage harvesters, rakes, tedders, feed mills, and related equipment. These machines help in the production, processing, and storage of forage crops like hay, silage, and straw. Farmers rely on these machines to optimize their yields and improve farm mechanization. Raw materials like grasses, legumes, and cereals are harvested using disc mowers, mower conditioners, and self-propelled mowers. Self-propelled balers and self-propelled forage harvesters are used for baling and processing forage crops into silage or hay.

Additionally, forage machinery includes auxiliary equipment like blowers, storage boxes, moisture sensors, and tires. These machines enhance the efficiency and productivity of forage production. Farmers also use crop insurance to mitigate risks associated with unpredictable weather conditions and market prices. Precision farming techniques and high-capacity product variants are gaining popularity in the market, offering farmers better control over their agricultural activities and improved food security.

Market Scope

Report Coverage

Details

Page number

167

Base year

2023

Historic period

2018-2022

Forecast period

2024-2028

Growth momentum & CAGR

Accelerate at a CAGR of 5.26%

Market growth 2024-2028

USD 1.13 billion

Market structure

Fragmented

YoY growth 2023-2024(%)

5.08

Regional analysis

Europe, North America, APAC, South America, and Middle East and Africa

Performing market contribution

Europe at 35%

Key countries

US, China, France, Germany, and Italy

Competitive landscape

Leading Companies, Market Positioning of Companies, Competitive Strategies, and Industry Risks

Key companies profiled

AGCO Corp., ARGO HYTOS Group AG, Bucher Industries AG, Buhler Industries Inc., Caterpillar Inc., CLAAS KGaA mBH, CNH Industrial N.V., Deere and Co., Farmking, Gomselmash India Pvt Ltd., ISEKI and Co. Ltd., Kubota Corp., Lely International NV, Mahindra and Mahindra Ltd., Maschinenfabrik Bernard KRONE GmbH and Co.KG, POTTINGER Landtechnik GmbH, Rostselmash, SDF SpA, Vermeer Corp., and Yanmar Holdings Co. Ltd.

Market dynamics

Parent market analysis, market growth inducers and obstacles, market forecast, fast-growing and slow-growing segment analysis, COVID-19 impact and recovery analysis and future consumer dynamics, market condition analysis for the forecast period

Customization purview

If our market report has not included the data that you are looking for, you can reach out to our analysts and get segments customized.

Request Free Sample

What are the Key Data Covered in this Market Research and Growth Report?

  • CAGR of the market during the forecast period
  • Detailed information on factors that will drive the market growth and forecasting between 2024 and 2028
  • Precise estimation of the size of the market  and its contribution of the market in focus to the parent market
  • Accurate predictions about upcoming market growth and trends and changes in consumer behaviour
  • Growth of the market across Europe, North America, APAC, South America, and Middle East and Africa
  • Thorough analysis of the market's competitive landscape and detailed information about companies
  • Comprehensive analysis of factors that will challenge the growth of market companies

We can help! Our analysts can customize this market research report to meet your requirements. Get in touch

1 Executive Summary

  • 1.1 Market overview
    • Exhibit 01: Executive Summary – Chart on Market Overview
    • Exhibit 02: Executive Summary – Data Table on Market Overview
    • Exhibit 03: Executive Summary – Chart on Global Market Characteristics
    • Exhibit 04: Executive Summary – Chart on Market by Geography
    • Exhibit 05: Executive Summary – Chart on Market Segmentation by Product
    • Exhibit 06: Executive Summary – Chart on Market Segmentation by End-user
    • Exhibit 07: Executive Summary – Chart on Incremental Growth
    • Exhibit 08: Executive Summary – Data Table on Incremental Growth
    • Exhibit 09: Executive Summary – Chart on Vendor Market Positioning

2 Market Landscape

  • 2.1 Market ecosystem
    • Exhibit 10: Parent market
    • Exhibit 11: Market Characteristics

3 Market Sizing

  • 3.1 Market definition
    • Exhibit 12: Offerings of vendors included in the market definition
  • 3.2 Market segment analysis
    • Exhibit 13: Market segments
  • 3.3 Market size 2023
    • 3.4 Market outlook: Forecast for 2023-2028
      • Exhibit 14: Chart on Global - Market size and forecast 2023-2028 ($ million)
      • Exhibit 15: Data Table on Global - Market size and forecast 2023-2028 ($ million)
      • Exhibit 16: Chart on Global Market: Year-over-year growth 2023-2028 (%)
      • Exhibit 17: Data Table on Global Market: Year-over-year growth 2023-2028 (%)

    4 Historic Market Size

    • 4.1 Global forage machinery market 2018 - 2022
      • Exhibit 18: Historic Market Size – Data Table on global forage machinery market 2018 - 2022 ($ million)
    • 4.2 Product Segment Analysis 2018 - 2022
      • Exhibit 19: Historic Market Size – Product Segment 2018 - 2022 ($ million)
    • 4.3 End-user Segment Analysis 2018 - 2022
      • Exhibit 20: Historic Market Size – End-user Segment 2018 - 2022 ($ million)
    • 4.4 Geography Segment Analysis 2018 - 2022
      • Exhibit 21: Historic Market Size – Geography Segment 2018 - 2022 ($ million)
    • 4.5 Country Segment Analysis 2018 - 2022
      • Exhibit 22: Historic Market Size – Country Segment 2018 - 2022 ($ million)

    5 Five Forces Analysis

    • 5.1 Five forces summary
      • Exhibit 23: Five forces analysis - Comparison between 2023 and 2028
    • 5.2 Bargaining power of buyers
      • Exhibit 24: Chart on Bargaining power of buyers – Impact of key factors 2023 and 2028
    • 5.3 Bargaining power of suppliers
      • Exhibit 25: Bargaining power of suppliers – Impact of key factors in 2023 and 2028
    • 5.4 Threat of new entrants
      • Exhibit 26: Threat of new entrants – Impact of key factors in 2023 and 2028
    • 5.5 Threat of substitutes
      • Exhibit 27: Threat of substitutes – Impact of key factors in 2023 and 2028
    • 5.6 Threat of rivalry
      • Exhibit 28: Threat of rivalry – Impact of key factors in 2023 and 2028
    • 5.7 Market condition
      • Exhibit 29: Chart on Market condition - Five forces 2023 and 2028

    6 Market Segmentation by Product

    • 6.1 Market segments
      • Exhibit 30: Chart on Product - Market share 2023-2028 (%)
      • Exhibit 31: Data Table on Product - Market share 2023-2028 (%)
    • 6.2 Comparison by Product
      • Exhibit 32: Chart on Comparison by Product
      • Exhibit 33: Data Table on Comparison by Product
    • 6.3 Self-propelled forage harvester - Market size and forecast 2023-2028
      • Exhibit 34: Chart on Self-propelled forage harvester - Market size and forecast 2023-2028 ($ million)
      • Exhibit 35: Data Table on Self-propelled forage harvester - Market size and forecast 2023-2028 ($ million)
      • Exhibit 36: Chart on Self-propelled forage harvester - Year-over-year growth 2023-2028 (%)
      • Exhibit 37: Data Table on Self-propelled forage harvester - Year-over-year growth 2023-2028 (%)
    • 6.4 Mounted-type forage harvester - Market size and forecast 2023-2028
      • Exhibit 38: Chart on Mounted-type forage harvester - Market size and forecast 2023-2028 ($ million)
      • Exhibit 39: Data Table on Mounted-type forage harvester - Market size and forecast 2023-2028 ($ million)
      • Exhibit 40: Chart on Mounted-type forage harvester - Year-over-year growth 2023-2028 (%)
      • Exhibit 41: Data Table on Mounted-type forage harvester - Year-over-year growth 2023-2028 (%)
    • 6.5 Market opportunity by Product
      • Exhibit 42: Market opportunity by Product ($ million)
      • Exhibit 43: Data Table on Market opportunity by Product ($ million)

    7 Market Segmentation by End-user

    • 7.1 Market segments
      • Exhibit 44: Chart on End-user - Market share 2023-2028 (%)
      • Exhibit 45: Data Table on End-user - Market share 2023-2028 (%)
    • 7.2 Comparison by End-user
      • Exhibit 46: Chart on Comparison by End-user
      • Exhibit 47: Data Table on Comparison by End-user
    • 7.3 Large farm - Market size and forecast 2023-2028
      • Exhibit 48: Chart on Large farm - Market size and forecast 2023-2028 ($ million)
      • Exhibit 49: Data Table on Large farm - Market size and forecast 2023-2028 ($ million)
      • Exhibit 50: Chart on Large farm - Year-over-year growth 2023-2028 (%)
      • Exhibit 51: Data Table on Large farm - Year-over-year growth 2023-2028 (%)
    • 7.4 Small and medium farm - Market size and forecast 2023-2028
      • Exhibit 52: Chart on Small and medium farm - Market size and forecast 2023-2028 ($ million)
      • Exhibit 53: Data Table on Small and medium farm - Market size and forecast 2023-2028 ($ million)
      • Exhibit 54: Chart on Small and medium farm - Year-over-year growth 2023-2028 (%)
      • Exhibit 55: Data Table on Small and medium farm - Year-over-year growth 2023-2028 (%)
    • 7.5 Market opportunity by End-user
      • Exhibit 56: Market opportunity by End-user ($ million)
      • Exhibit 57: Data Table on Market opportunity by End-user ($ million)

    8 Customer Landscape

    • 8.1 Customer landscape overview
      • Exhibit 58: Analysis of price sensitivity, lifecycle, customer purchase basket, adoption rates, and purchase criteria

    9 Geographic Landscape

    • 9.1 Geographic segmentation
      • Exhibit 59: Chart on Market share by geography 2023-2028 (%)
      • Exhibit 60: Data Table on Market share by geography 2023-2028 (%)
    • 9.2 Geographic comparison
      • Exhibit 61: Chart on Geographic comparison
      • Exhibit 62: Data Table on Geographic comparison
    • 9.3 Europe - Market size and forecast 2023-2028
      • Exhibit 63: Chart on Europe - Market size and forecast 2023-2028 ($ million)
      • Exhibit 64: Data Table on Europe - Market size and forecast 2023-2028 ($ million)
      • Exhibit 65: Chart on Europe - Year-over-year growth 2023-2028 (%)
      • Exhibit 66: Data Table on Europe - Year-over-year growth 2023-2028 (%)
    • 9.4 North America - Market size and forecast 2023-2028
      • Exhibit 67: Chart on North America - Market size and forecast 2023-2028 ($ million)
      • Exhibit 68: Data Table on North America - Market size and forecast 2023-2028 ($ million)
      • Exhibit 69: Chart on North America - Year-over-year growth 2023-2028 (%)
      • Exhibit 70: Data Table on North America - Year-over-year growth 2023-2028 (%)
    • 9.5 APAC - Market size and forecast 2023-2028
      • Exhibit 71: Chart on APAC - Market size and forecast 2023-2028 ($ million)
      • Exhibit 72: Data Table on APAC - Market size and forecast 2023-2028 ($ million)
      • Exhibit 73: Chart on APAC - Year-over-year growth 2023-2028 (%)
      • Exhibit 74: Data Table on APAC - Year-over-year growth 2023-2028 (%)
    • 9.6 South America - Market size and forecast 2023-2028
      • Exhibit 75: Chart on South America - Market size and forecast 2023-2028 ($ million)
      • Exhibit 76: Data Table on South America - Market size and forecast 2023-2028 ($ million)
      • Exhibit 77: Chart on South America - Year-over-year growth 2023-2028 (%)
      • Exhibit 78: Data Table on South America - Year-over-year growth 2023-2028 (%)
    • 9.7 Middle East and Africa - Market size and forecast 2023-2028
      • Exhibit 79: Chart on Middle East and Africa - Market size and forecast 2023-2028 ($ million)
      • Exhibit 80: Data Table on Middle East and Africa - Market size and forecast 2023-2028 ($ million)
      • Exhibit 81: Chart on Middle East and Africa - Year-over-year growth 2023-2028 (%)
      • Exhibit 82: Data Table on Middle East and Africa - Year-over-year growth 2023-2028 (%)
    • 9.8 US - Market size and forecast 2023-2028
      • Exhibit 83: Chart on US - Market size and forecast 2023-2028 ($ million)
      • Exhibit 84: Data Table on US - Market size and forecast 2023-2028 ($ million)
      • Exhibit 85: Chart on US - Year-over-year growth 2023-2028 (%)
      • Exhibit 86: Data Table on US - Year-over-year growth 2023-2028 (%)
    • 9.9 France - Market size and forecast 2023-2028
      • Exhibit 87: Chart on France - Market size and forecast 2023-2028 ($ million)
      • Exhibit 88: Data Table on France - Market size and forecast 2023-2028 ($ million)
      • Exhibit 89: Chart on France - Year-over-year growth 2023-2028 (%)
      • Exhibit 90: Data Table on France - Year-over-year growth 2023-2028 (%)
    • 9.10 China - Market size and forecast 2023-2028
      • Exhibit 91: Chart on China - Market size and forecast 2023-2028 ($ million)
      • Exhibit 92: Data Table on China - Market size and forecast 2023-2028 ($ million)
      • Exhibit 93: Chart on China - Year-over-year growth 2023-2028 (%)
      • Exhibit 94: Data Table on China - Year-over-year growth 2023-2028 (%)
    • 9.11 Germany - Market size and forecast 2023-2028
      • Exhibit 95: Chart on Germany - Market size and forecast 2023-2028 ($ million)
      • Exhibit 96: Data Table on Germany - Market size and forecast 2023-2028 ($ million)
      • Exhibit 97: Chart on Germany - Year-over-year growth 2023-2028 (%)
      • Exhibit 98: Data Table on Germany - Year-over-year growth 2023-2028 (%)
    • 9.12 Italy - Market size and forecast 2023-2028
      • Exhibit 99: Chart on Italy - Market size and forecast 2023-2028 ($ million)
      • Exhibit 100: Data Table on Italy - Market size and forecast 2023-2028 ($ million)
      • Exhibit 101: Chart on Italy - Year-over-year growth 2023-2028 (%)
      • Exhibit 102: Data Table on Italy - Year-over-year growth 2023-2028 (%)
    • 9.13 Market opportunity by geography
      • Exhibit 103: Market opportunity by geography ($ million)
      • Exhibit 104: Data Tables on Market opportunity by geography ($ million)

    10 Drivers, Challenges, and Trends

    • 10.1 Market drivers
      • 10.2 Market challenges
        • 10.3 Impact of drivers and challenges
          • Exhibit 105: Impact of drivers and challenges in 2023 and 2028
        • 10.4 Market trends

          11 Vendor Landscape

          • 11.1 Overview
            • 11.2 Vendor landscape
              • Exhibit 106: Overview on Criticality of inputs and Factors of differentiation
            • 11.3 Landscape disruption
              • Exhibit 107: Overview on factors of disruption
            • 11.4 Industry risks
              • Exhibit 108: Impact of key risks on business

            12 Vendor Analysis

            • 12.1 Vendors covered
              • Exhibit 109: Vendors covered
            • 12.2 Market positioning of vendors
              • Exhibit 110: Matrix on vendor position and classification
            • 12.3 AGCO Corp.
              • Exhibit 111: AGCO Corp. - Overview
              • Exhibit 112: AGCO Corp. - Business segments
              • Exhibit 113: AGCO Corp. - Key news
              • Exhibit 114: AGCO Corp. - Key offerings
              • Exhibit 115: AGCO Corp. - Segment focus
            • 12.4 ARGO HYTOS Group AG
              • Exhibit 116: ARGO HYTOS Group AG - Overview
              • Exhibit 117: ARGO HYTOS Group AG - Product / Service
              • Exhibit 118: ARGO HYTOS Group AG - Key offerings
            • 12.5 Bucher Industries AG
              • Exhibit 119: Bucher Industries AG - Overview
              • Exhibit 120: Bucher Industries AG - Business segments
              • Exhibit 121: Bucher Industries AG - Key offerings
              • Exhibit 122: Bucher Industries AG - Segment focus
            • 12.6 Buhler Industries Inc.
              • Exhibit 123: Buhler Industries Inc. - Overview
              • Exhibit 124: Buhler Industries Inc. - Business segments
              • Exhibit 125: Buhler Industries Inc. - Key news
              • Exhibit 126: Buhler Industries Inc. - Key offerings
              • Exhibit 127: Buhler Industries Inc. - Segment focus
            • 12.7 Caterpillar Inc.
              • Exhibit 128: Caterpillar Inc. - Overview
              • Exhibit 129: Caterpillar Inc. - Business segments
              • Exhibit 130: Caterpillar Inc. - Key news
              • Exhibit 131: Caterpillar Inc. - Key offerings
              • Exhibit 132: Caterpillar Inc. - Segment focus
            • 12.8 CLAAS KGaA mBH
              • Exhibit 133: CLAAS KGaA mBH - Overview
              • Exhibit 134: CLAAS KGaA mBH - Product / Service
              • Exhibit 135: CLAAS KGaA mBH - Key offerings
            • 12.9 CNH Industrial N.V.
              • Exhibit 136: CNH Industrial N.V. - Overview
              • Exhibit 137: CNH Industrial N.V. - Product / Service
              • Exhibit 138: CNH Industrial N.V. - Key news
              • Exhibit 139: CNH Industrial N.V. - Key offerings
            • 12.10 Deere and Co.
              • Exhibit 140: Deere and Co. - Overview
              • Exhibit 141: Deere and Co. - Business segments
              • Exhibit 142: Deere and Co. - Key news
              • Exhibit 143: Deere and Co. - Key offerings
              • Exhibit 144: Deere and Co. - Segment focus
            • 12.11 Farmking
              • Exhibit 145: Farmking - Overview
              • Exhibit 146: Farmking - Product / Service
              • Exhibit 147: Farmking - Key offerings
            • 12.12 Gomselmash India Pvt Ltd.
              • Exhibit 148: Gomselmash India Pvt Ltd. - Overview
              • Exhibit 149: Gomselmash India Pvt Ltd. - Product / Service
              • Exhibit 150: Gomselmash India Pvt Ltd. - Key offerings
            • 12.13 Kubota Corp.
              • Exhibit 151: Kubota Corp. - Overview
              • Exhibit 152: Kubota Corp. - Business segments
              • Exhibit 153: Kubota Corp. - Key news
              • Exhibit 154: Kubota Corp. - Key offerings
              • Exhibit 155: Kubota Corp. - Segment focus
            • 12.14 Mahindra and Mahindra Ltd.
              • Exhibit 156: Mahindra and Mahindra Ltd. - Overview
              • Exhibit 157: Mahindra and Mahindra Ltd. - Business segments
              • Exhibit 158: Mahindra and Mahindra Ltd. - Key news
              • Exhibit 159: Mahindra and Mahindra Ltd. - Key offerings
              • Exhibit 160: Mahindra and Mahindra Ltd. - Segment focus
            • 12.15 Maschinenfabrik Bernard KRONE GmbH and Co.KG
              • Exhibit 161: Maschinenfabrik Bernard KRONE GmbH and Co.KG - Overview
              • Exhibit 162: Maschinenfabrik Bernard KRONE GmbH and Co.KG - Product / Service
              • Exhibit 163: Maschinenfabrik Bernard KRONE GmbH and Co.KG - Key offerings
            • 12.16 POTTINGER Landtechnik GmbH
              • Exhibit 164: POTTINGER Landtechnik GmbH - Overview
              • Exhibit 165: POTTINGER Landtechnik GmbH - Product / Service
              • Exhibit 166: POTTINGER Landtechnik GmbH - Key offerings
            • 12.17 Yanmar Holdings Co. Ltd.
              • Exhibit 167: Yanmar Holdings Co. Ltd. - Overview
              • Exhibit 168: Yanmar Holdings Co. Ltd. - Product / Service
              • Exhibit 169: Yanmar Holdings Co. Ltd. - Key news
              • Exhibit 170: Yanmar Holdings Co. Ltd. - Key offerings

            13 Appendix

            • 13.1 Scope of the report
              • 13.2 Inclusions and exclusions checklist
                • Exhibit 171: Inclusions checklist
                • Exhibit 172: Exclusions checklist
              • 13.3 Currency conversion rates for US$
                • Exhibit 173: Currency conversion rates for US$
              • 13.4 Research methodology
                • Exhibit 174: Research methodology
                • Exhibit 175: Validation techniques employed for market sizing
                • Exhibit 176: Information sources
              • 13.5 List of abbreviations
                • Exhibit 177: List of abbreviations

              Research Methodology

              Technavio presents a detailed picture of the market by way of study, synthesis, and summation of data from multiple sources. The analysts have presented the various facets of the market with a particular focus on identifying the key industry influencers. The data thus presented is comprehensive, reliable, and the result of extensive research, both primary and secondary.

              INFORMATION SOURCES

              Primary sources

              • Manufacturers and suppliers
              • Channel partners
              • Industry experts
              • Strategic decision makers

              Secondary sources

              • Industry journals and periodicals
              • Government data
              • Financial reports of key industry players
              • Historical data
              • Press releases

              DATA ANALYSIS

              Data Synthesis

              • Collation of data
              • Estimation of key figures
              • Analysis of derived insights

              Data Validation

              • Triangulation with data models
              • Reference against proprietary databases
              • Corroboration with industry experts

              REPORT WRITING

              Qualitative

              • Market drivers
              • Market challenges
              • Market trends
              • Five forces analysis

              Quantitative

              • Market size and forecast
              • Market segmentation
              • Geographical insights
              • Competitive landscape

              Interested in this report?

              Get your sample now to see our research methodology and insights!

              Download Now

              Frequently Asked Questions

              Forage Machinery market growth will increase by $ 1126.61 mn during 2024-2028.

              The Forage Machinery market is expected to grow at a CAGR of 5.26% during 2024-2028.

              Forage Machinery market is segmented by Product( Self-propelled forage harvester, Mounted-type forage harvester) End-user( Large farm, Small, medium farm)

              AGCO Corp., ARGO HYTOS Group AG, Bucher Industries AG, Buhler Industries Inc., Caterpillar Inc., CLAAS KGaA mBH, CNH Industrial N.V., Deere and Co., Farmking, Gomselmash India Pvt Ltd., ISEKI and Co. Ltd., Kubota Corp., Lely International NV, Mahindra and Mahindra Ltd., Maschinenfabrik Bernard KRONE GmbH and Co.KG, POTTINGER Landtechnik GmbH, Rostselmash, SDF SpA, Vermeer Corp., Yanmar Holdings Co. Ltd. are a few of the key vendors in the Forage Machinery market.

              Europe will register the highest growth rate of 35% among the other regions. Therefore, the Forage Machinery market in Europe is expected to garner significant business opportunities for the vendors during the forecast period.

              US, China, France, Germany, Italy

              • Advancements in forage harvesting technologyAdvancements in forage harvesting technology play a significant role in driving growth and innovation within the global forage machinery market. Some key advancements are as follows: Modern forage harvesters are equipped with precision chopping technology is the driving factor this market.
              • which enables the precise and uniform cutting of forage crops. This technology enables farmers to optimize forage quality is the driving factor this market.
              • improve digestibility is the driving factor this market.
              • and reduce wastage of feed is the driving factor this market.
              • ultimately enhancing the overall efficiency of livestock production. Variable Rate Technology (VRT) enables forage machinery to adjust the cutting parameters is the driving factor this market.
              • such as the cutting length and chop quality is the driving factor this market.
              • based on real-time conditions and crop characteristics. This technology optimizes efficiency in forage harvesting is the driving factor this market.
              • minimizes fuel consumption is the driving factor this market.
              • and maximizes yield is the driving factor this market.
              • contributing to improved profitability for farmers. Advancements in baling technology have led to the development of high-capacity balers that can produce denser and more uniform bales. Additionally is the driving factor this market.
              • features such as automatic bale weighing is the driving factor this market.
              • density control is the driving factor this market.
              • and moisture monitoring enhance the quality and consistency of the baled forage is the driving factor this market.
              • meeting the demands of modern livestock operations. Integrated sensors and monitoring systems enable the real-time assessment of forage quality parameters is the driving factor this market.
              • such as moisture content is the driving factor this market.
              • protein levels is the driving factor this market.
              • and fiber digestibility. This data helps farmers make informed decisions regarding harvest timing is the driving factor this market.
              • storage conditions is the driving factor this market.
              • and feed management practices is the driving factor this market.
              • ultimately improving animal nutrition and performance. Forage harvesting equipment is becoming more connected and data-driven is the driving factor this market.
              • enabling farmers to collect is the driving factor this market.
              • analyze is the driving factor this market.
              • and leverage vast amounts of operational data. Cloud-based platforms and telemetry systems facilitate remote monitoring is the driving factor this market.
              • fleet management is the driving factor this market.
              • and predictive maintenance is the driving factor this market.
              • thereby enhancing productivity and decision-making in forage production. Thus is the driving factor this market.
              • these advancements in forage harvesting technology improve operational efficiency and the productivity of forage harvesting is the driving factor this market.
              • which is the driving factor this market.
              • in turn is the driving factor this market.
              • will strengthen the growth of the global forage machinery market during the forecast period. is the driving factor this market.

              The Forage Machinery market vendors should focus on grabbing business opportunities from the Self-propelled forage harvester segment as it accounted for the largest market share in the base year.