Frac Sand Logistics Market Size 2025-2029
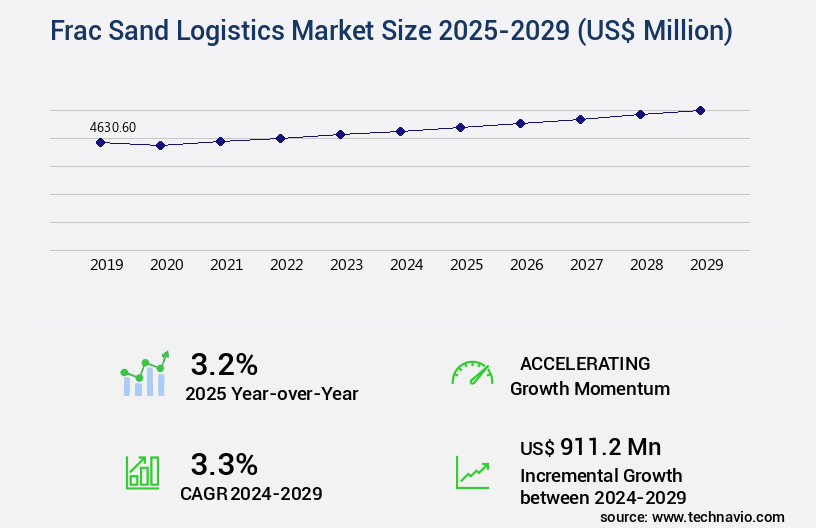
The frac sand logistics market size is valued to increase by USD 911.2 million, at a CAGR of 3.3% from 2024 to 2029. Presence of diverse delivery modes will drive the frac sand logistics market.
Major Market Trends & Insights
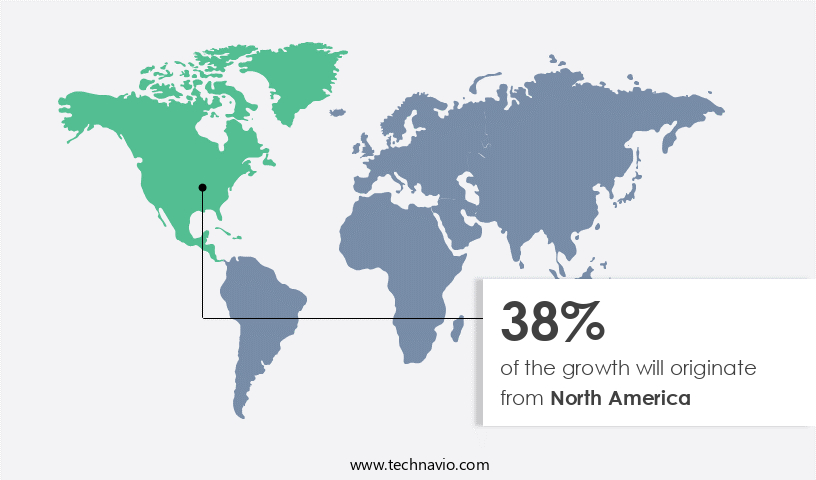
- North America dominated the market and accounted for a 38% growth during the forecast period.
- By Application - Sourcing and mining segment was valued at USD 1898.60 million in 2023
- By Type - 3PL segment accounted for the largest market revenue share in 2023
Market Size & Forecast
- Market Opportunities: USD 29.67 million
- Market Future Opportunities: USD 911.20 million
- CAGR from 2024 to 2029 : 3.3%
Market Summary
- The market plays a pivotal role in the oil and gas industry's production process, supplying prolific quantities of frac sand to drilling sites in close proximity to shale basins. According to market intelligence, the global frac sand market was valued at USD19.6 billion in 2020, underscoring its significance. This market's growth is driven by the increasing demand for hydraulic fracturing, which relies on frac sand as a critical component. Frac sand logistics companies employ diverse delivery modes, including rail, truck, and barge, to transport the sand from mines to well sites efficiently. However, the market faces challenges, such as the high costs associated with labor and equipment for sand transportation.
- Despite these hurdles, the frac sand logistics sector continues to evolve, with advancements in technology and operational strategies aimed at reducing costs and improving efficiency. For instance, some companies are exploring the use of automated loading and unloading systems, while others are optimizing their logistics networks to minimize transportation distances. In summary, the market is a vital component of the oil and gas industry, with a significant market value and a continuous demand for innovation to address challenges and improve efficiency.
What will be the Size of the Frac Sand Logistics Market during the forecast period?
Get Key Insights on Market Forecast (PDF) Request Free Sample
How is the Frac Sand Logistics Market Segmented ?
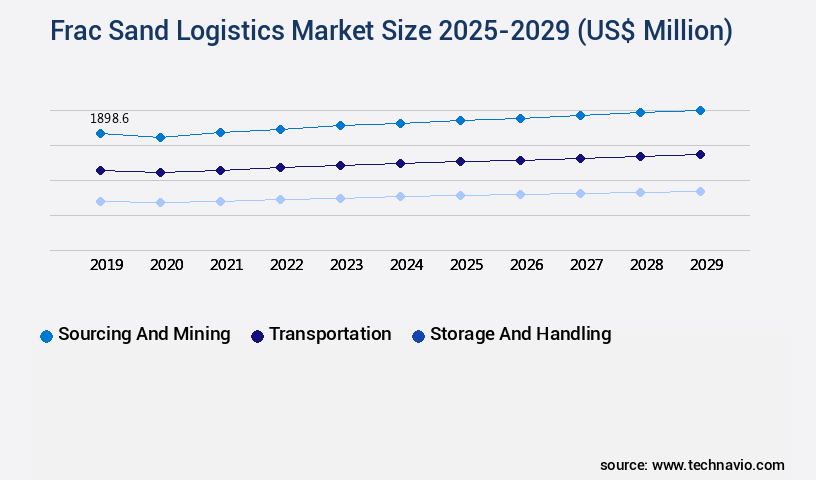
The frac sand logistics industry research report provides comprehensive data (region-wise segment analysis), with forecasts and estimates in "USD million" for the period 2025-2029, as well as historical data from 2019-2023 for the following segments.
- Application
- Sourcing and mining
- Transportation
- Storage and handling
- Others
- Type
- 3PL
- 4PL
- Others
- End-user
- Oil exploration
- Natural gas extraction
- Shale gas development
- Geography
- North America
- US
- Canada
- Mexico
- Europe
- France
- Germany
- Italy
- UK
- APAC
- China
- India
- Japan
- Rest of World (ROW)
- North America
By Application Insights
The sourcing and mining segment is estimated to witness significant growth during the forecast period.
The market is a dynamic and evolving sector that plays a crucial role in the oil and gas industry, specifically in the context of hydraulic fracturing (fracking) operations. This market encompasses various aspects of proppant sourcing strategies, with a focus on identifying, evaluating, and securing a consistent supply of high-quality frac sand. The process begins with geological assessments, employing techniques such as geological surveys, core sampling, drilling, and laboratory testing to evaluate potential sources. Quality assessment is paramount, ensuring the sourced sand meets specific requirements, including grain size, roundness, sphericity, crush resistance, and the absence of impurities. Transportation cost modeling, railcar loading efficiency, and safety compliance standards are essential components of the logistics network design.
Waste reduction initiatives, sustainability efforts, and supply chain optimization further contribute to the market's evolution. Real-time tracking systems, route optimization software, maintenance scheduling protocols, and performance tracking metrics are integral to operational efficiency gains and on-time delivery performance. Moreover, the market prioritizes loss prevention strategies, such as risk management protocols and accident prevention measures, to mitigate potential hazards. Demand forecasting models and inventory management systems enable effective freight pricing strategies and emission reduction targets. Bulk material logistics relies on advanced fleet management technology and driver scheduling algorithms to optimize throughput and equipment utilization rates. A single sand mine in Wisconsin, for instance, produces approximately 20 million tons of sand annually, underscoring the market's significant scale and importance.
The ongoing activities and evolving patterns in the market offer factual, authoritative insights into this critical sector.
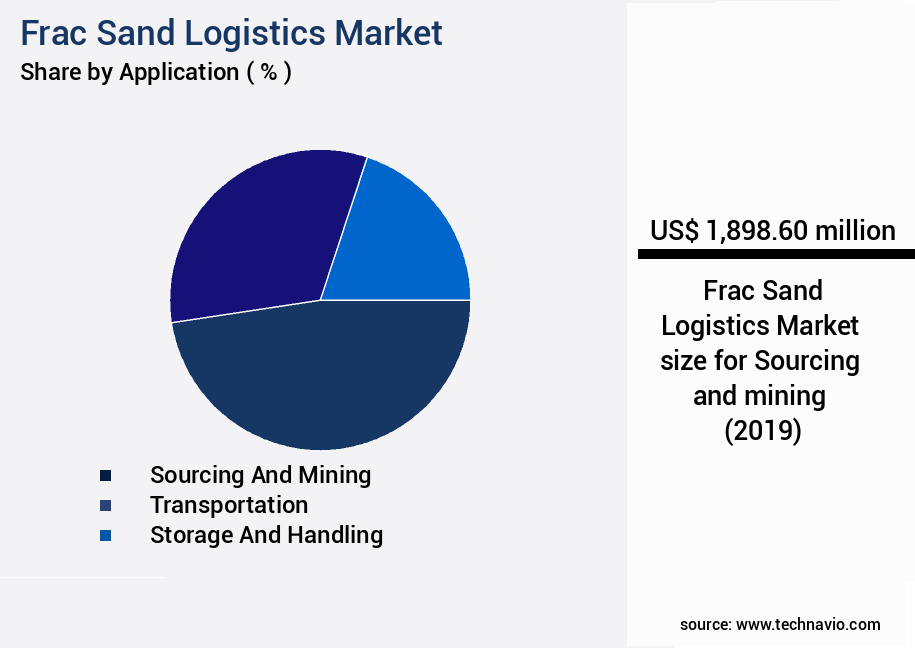
The Sourcing and mining segment was valued at USD 1898.60 million in 2019 and showed a gradual increase during the forecast period.
Regional Analysis
North America is estimated to contribute 38% to the growth of the global market during the forecast period.Technavio’s analysts have elaborately explained the regional trends and drivers that shape the market during the forecast period.
See How Frac Sand Logistics Market Demand is Rising in North America Request Free Sample
The market in North America is experiencing notable growth due to the expanding hydraulic fracturing activities, particularly in major shale basins like the Permian Basin and the Eagle Ford Shale. The demand for frac sand is directly linked to the drilling operations' expansion, necessitating efficient logistics for transporting and delivering sand to well sites. Strategically located facilities and distribution centers near shale reserves are a key strategy for logistics providers to minimize transportation costs and ensure a consistent frac sand supply.
Well-established transportation infrastructure, including road networks, railroads, and shipping terminals, plays a crucial role in moving frac sand from mines to end-users efficiently. According to recent studies, the North American the market is projected to grow substantially, with the rail transportation segment accounting for a significant market share due to its ability to transport large volumes of sand over long distances.
Market Dynamics
Our researchers analyzed the data with 2024 as the base year, along with the key drivers, trends, and challenges. A holistic analysis of drivers will help companies refine their marketing strategies to gain a competitive advantage.
The market is a critical component of the shale gas and oil industry, with the efficient and cost-effective delivery of proppant being a key driver for enhanced drilling performance. To optimize railcar unloading and improve proppant handling equipment maintenance, companies are investing in advanced techniques to reduce transportation costs in frac sand. Real-time tracking systems for proppant are being implemented to ensure effective supply chain risk management and improve the efficiency of sand delivery systems. Effective strategies for proppant supply chain visibility and sustainable practices for frac sand transportation are essential for minimizing environmental impact. Enhancing safety protocols in proppant transport and implementing data-driven decision-making in proppant logistics are also crucial for ensuring on-time delivery performance and reducing operational inefficiencies. Integrated logistics management systems for proppant are increasingly being adopted to optimize proppant inventory management and improve operational efficiency in frac sand logistics. Advanced analytics for frac sand logistics optimization and effective strategies for proppant transportation routing are also gaining popularity. Technology is having a significant impact on frac sand logistics efficiency, with the use of real-time data and predictive analytics enabling more effective management of sand delivery networks. Key performance indicators for sand delivery, such as delivery time, cost, and quality, are being closely monitored to ensure optimal performance. In conclusion, the market is undergoing significant transformation, with a focus on reducing costs, improving efficiency, enhancing safety, and minimizing environmental impact. Effective strategies for proppant supply chain visibility, sustainable practices for frac sand transportation, and data-driven decision-making are all key to ensuring the long-term success of frac sand logistics operations.
What are the key market drivers leading to the rise in the adoption of Frac Sand Logistics Industry?
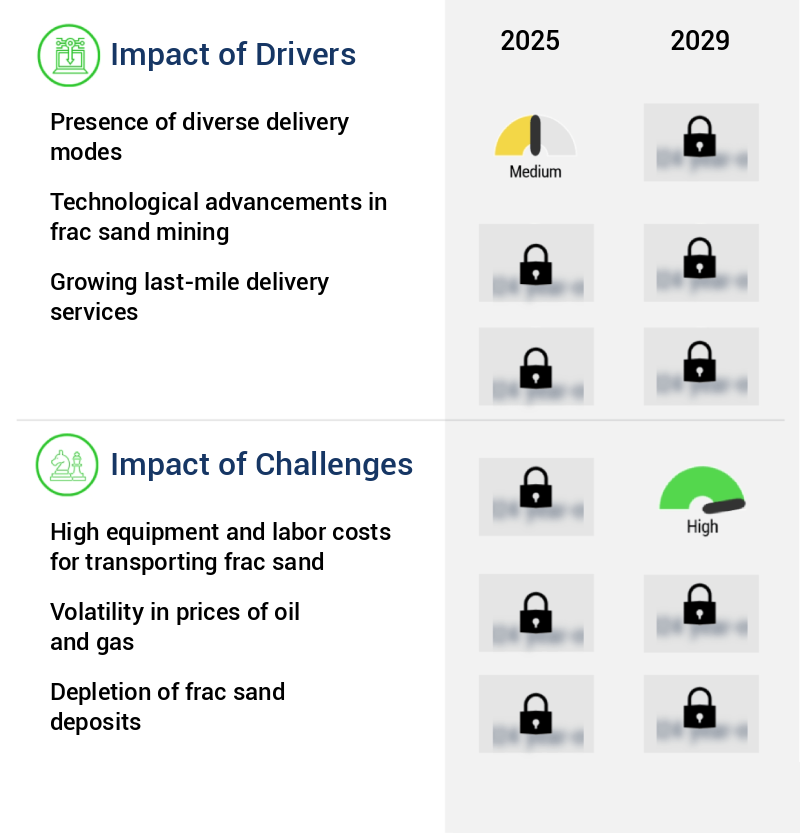
- The presence of various delivery modes is a crucial factor in driving market growth. This diversity in delivery methods caters to the distinct preferences and needs of consumers, thereby expanding the market's reach and appeal.
- The market demonstrates a dynamic and adaptive nature, catering to the diverse needs of the oil and gas sector. Logistics providers offer various delivery modes to accommodate the unique requirements of producers. Rail transport, for instance, is an efficient choice for long-distance hauls due to its capacity to transport large volumes. Conversely, trucking or conveyor systems are more suitable for shorter hauls and last-mile delivery. By strategically employing different delivery modes, logistics providers optimize transportation routes and reduce costs. For instance, a producer may save costs by using rail for long-distance transportation and trucking for last-mile delivery.
- The flexibility to choose the most cost-effective delivery mode for a specific transport route or location is essential in an industry where efficiency and cost control are paramount.
What are the market trends shaping the Frac Sand Logistics Industry?
- The proximity to shale basins is emerging as a significant market trend. Shale basins are becoming increasingly important in the energy sector.
- Frac sand logistics plays a pivotal role in the oil and gas industry, particularly in shale basins where hydraulic fracturing (fracking) activities are prevalent. The proximity of frac sand mines, processing facilities, and logistics centers to these basins is crucial for efficiency and cost-effectiveness. Being situated near shale basins significantly reduces transportation costs due to shorter distances, leading to savings on fuel, labor, and maintenance expenses. Moreover, timely deliveries are ensured, allowing for uninterrupted drilling operations. For instance, a study revealed that frac sand transported from a nearby source can save up to 30% in logistics costs compared to sand sourced from distant locations.
- The strategic placement of frac sand logistics infrastructure is a key factor in the industry's continued growth and success.
What challenges does the Frac Sand Logistics Industry face during its growth?
- The escalating costs of equipment and labor for transporting frac sand represent a significant challenge to the growth of the industry. This issue, which is mandated for attention due to its impact on the sector's expansion, stems from the increasing expenses associated with moving large quantities of frac sand over long distances to drilling sites.
- Frac sand logistics is a critical component of the hydraulic fracturing process in the oil and gas industry. The market for frac sand logistics has evolved significantly due to the increasing demand for sand in the extraction process. The transportation of frac sand involves high equipment costs, including the purchase, maintenance, and fuel expenses for trucks, railcars, and transportation vehicles. These costs can negatively impact the competitiveness of logistics providers. Additionally, labor costs for drivers, equipment operators, and other personnel involved in frac sand logistics can be substantial operational expenses. High labor costs may lead to the need for increased service fees or charges.
- Equipment used for frac sand logistics, such as trucks and conveyor systems, require regular maintenance and occasional repairs. The costs associated with maintenance and repairs can impact the profitability of logistics companies. According to recent research, the global frac sand market size was valued at over USD10 billion in 2020 and is expected to grow at a robust pace. Another study estimates that the North American frac sand market accounted for over 70% of the global market share in 2019. These figures underscore the importance and scale of the market.
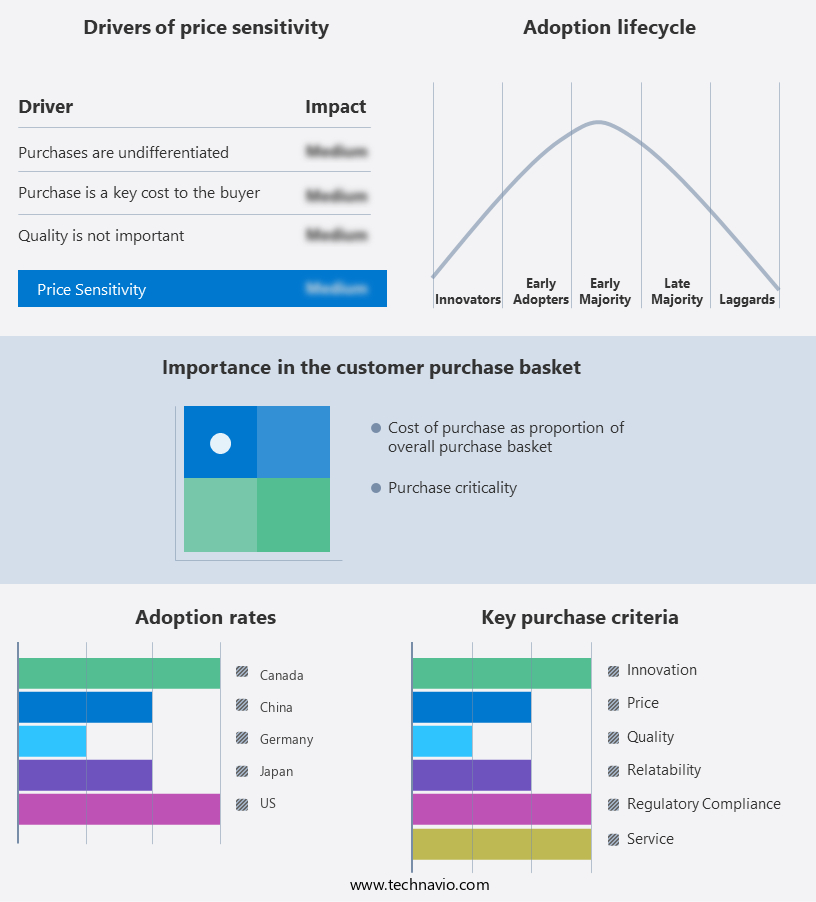
Exclusive Technavio Analysis on Customer Landscape
The frac sand logistics market forecasting report includes the adoption lifecycle of the market, covering from the innovator’s stage to the laggard’s stage. It focuses on adoption rates in different regions based on penetration. Furthermore, the frac sand logistics market report also includes key purchase criteria and drivers of price sensitivity to help companies evaluate and develop their market growth analysis strategies.
Customer Landscape of Frac Sand Logistics Industry
Competitive Landscape
Companies are implementing various strategies, such as strategic alliances, frac sand logistics market forecast, partnerships, mergers and acquisitions, geographical expansion, and product/service launches, to enhance their presence in the industry.
Atlas Energy Solutions Inc. - This company specializes in frac sand logistics, offering customizable on-site storage solutions and advanced technology-driven last mile delivery services for optimized frac sand management.
The industry research and growth report includes detailed analyses of the competitive landscape of the market and information about key companies, including:
- Atlas Energy Solutions Inc.
- BelCon Logistics
- CIG Logistics
- Detmar Logistics LLC
- FilaMar Energy Service
- ForeSite Logistics
- Halliburton Co.
- OmniTRAX Inc.
- Permian Frac Sand LLC
- Pontotoc Sand and Stone
- R L Global Logistics Inc.
- Sand Revolution
- STAAR Logistics
- Tidewater Logistics
- Twin Eagle
- Union Pacific Corp.
- US Silica Holdings Inc.
Qualitative and quantitative analysis of companies has been conducted to help clients understand the wider business environment as well as the strengths and weaknesses of key industry players. Data is qualitatively analyzed to categorize companies as pure play, category-focused, industry-focused, and diversified; it is quantitatively analyzed to categorize companies as dominant, leading, strong, tentative, and weak.
Recent Development and News in Frac Sand Logistics Market
- In January 2024, Hi-Crush Partners, a leading frac sand supplier, announced the expansion of its Mine-to-Market logistics system with the acquisition of a 135-mile railroad line in Texas from Kansas City Southern (KCS). This strategic move aimed to enhance the company's ability to transport frac sand more efficiently to its customers in the Permian Basin (Source: Hi-Crush Partners Press Release).
- In March 2024, Silica Services, a frac sand logistics provider, entered into a partnership with Cargill to develop a new frac sand terminal in the Marcellus Shale region. This collaboration enabled Silica Services to expand its footprint in the region and strengthen its position as a key player in the Marcellus Shale market (Source: Silica Services Press Release).
- In May 2024, Fairmount Santrol Holdings, a leading frac sand provider, completed the acquisition of Proppants Plus, a privately-held frac sand company. This acquisition significantly expanded Fairmount Santrol's production capacity and market presence, particularly in the Eagle Ford Shale and Permian Basin regions (Source: Fairmount Santrol Holdings SEC Filing).
- In April 2025, US Silica, a leading frac sand supplier, announced the successful deployment of its proprietary SABS (Silica Aerodynamic Ballistic System) technology at its new frac sand mine in Wisconsin. This technological advancement aimed to improve the efficiency and effectiveness of frac sand delivery to customers by reducing dust emissions and improving the shape and size consistency of the sand particles (Source: US Silica Press Release).
Dive into Technavio’s robust research methodology, blending expert interviews, extensive data synthesis, and validated models for unparalleled Frac Sand Logistics Market insights. See full methodology.
|
Market Scope |
|
|
Report Coverage |
Details |
|
Page number |
204 |
|
Base year |
2024 |
|
Historic period |
2019-2023 |
|
Forecast period |
2025-2029 |
|
Growth momentum & CAGR |
Accelerate at a CAGR of 3.3% |
|
Market growth 2025-2029 |
USD 911.2 million |
|
Market structure |
Fragmented |
|
YoY growth 2024-2025(%) |
3.2 |
|
Key countries |
US, Japan, Canada, China, Germany, India, France, Mexico, UK, and Italy |
|
Competitive landscape |
Leading Companies, Market Positioning of Companies, Competitive Strategies, and Industry Risks |
Research Analyst Overview
- The market continues to evolve, driven by the dynamic nature of hydraulic fracturing operations and the need for cost-effective proppant sourcing strategies. Transportation cost modeling plays a crucial role in optimizing logistics networks, with railcar loading efficiency and fleet management technology essential for minimizing expenses. Waste reduction initiatives and safety compliance standards are also paramount, as the industry strives for sustainability and operational excellence. For instance, a leading frac sand producer implemented a comprehensive waste reduction program, reducing their waste by 20% through optimized inventory management systems and demand forecasting models. The industry anticipates a robust growth of 15% in the next five years, fueled by continuous supply chain optimization, loss prevention strategies, and real-time tracking systems.
- Sustainability initiatives, such as emission reduction targets and bulk material logistics, are increasingly important, as the market adapts to evolving environmental regulations. Throughput optimization, equipment utilization rates, and operational efficiency gains are key performance tracking metrics for companies seeking to maintain a competitive edge. Proppant handling systems, driver scheduling algorithms, and accident prevention measures are integral components of sand transportation methods, ensuring on-time delivery performance and customer satisfaction. Furthermore, the implementation of advanced performance tracking metrics, risk management protocols, and maintenance scheduling protocols contributes to the overall success of logistics networks. In summary, the market is characterized by continuous evolution and adaptation to the ever-changing demands of the hydraulic fracturing industry.
- By focusing on cost reduction strategies, railcar loading efficiency, waste reduction initiatives, and sustainability, companies can optimize their logistics networks, ensuring operational excellence and long-term success.
What are the Key Data Covered in this Frac Sand Logistics Market Research and Growth Report?
-
What is the expected growth of the Frac Sand Logistics Market between 2025 and 2029?
-
USD 911.2 million, at a CAGR of 3.3%
-
-
What segmentation does the market report cover?
-
The report is segmented by Application (Sourcing and mining, Transportation, Storage and handling, and Others), Type (3PL, 4PL, and Others), End-user (Oil exploration, Natural gas extraction, and Shale gas development), and Geography (North America, APAC, Europe, South America, and Middle East and Africa)
-
-
Which regions are analyzed in the report?
-
North America, APAC, Europe, South America, and Middle East and Africa
-
-
What are the key growth drivers and market challenges?
-
Presence of diverse delivery modes, High equipment and labor costs for transporting frac sand
-
-
Who are the major players in the Frac Sand Logistics Market?
-
Atlas Energy Solutions Inc., BelCon Logistics, CIG Logistics, Detmar Logistics LLC, FilaMar Energy Service, ForeSite Logistics, Halliburton Co., OmniTRAX Inc., Permian Frac Sand LLC, Pontotoc Sand and Stone, R L Global Logistics Inc., Sand Revolution, STAAR Logistics, Tidewater Logistics, Twin Eagle, Union Pacific Corp., and US Silica Holdings Inc.
-
Market Research Insights
- The market is a critical component of the oil and gas industry, continually adapting to meet the demands of drilling operations. Two key aspects of this market include the optimization of distribution networks and the implementation of freight consolidation strategies. For instance, the number of trucks required to transport frac sand from mines to well sites has decreased by 20% due to these strategies. Furthermore, industry experts anticipate a 12% annual growth rate for the market over the next five years.
- This growth is driven by the increasing complexity of drilling operations and the need for more efficient and cost-effective solutions. Market participants are focusing on technology integration, capacity planning models, and regulatory compliance monitoring to enhance their offerings and maintain a competitive edge.
We can help! Our analysts can customize this frac sand logistics market research report to meet your requirements.
 RIA -
RIA - 
