Fractional Flow Reserve Devices Market Analysis, Size, and Forecast 2026-2030: North America (US, Canada, and Mexico), Europe (Germany, France, and UK), APAC (China, Japan, and India), South America (Brazil, Argentina, and Colombia), Middle East and Africa (Saudi Arabia, South Africa, and UAE), Asia, Rest of World (ROW)

Fractional Flow Reserve Devices Market Analysis, Size, and Forecast 2026-2030:
North America (US, Canada, and Mexico), Europe (Germany, France, and UK), APAC (China, Japan, and India), South America (Brazil, Argentina, and Colombia), Middle East and Africa (Saudi Arabia, South Africa, and UAE), Asia, Rest of World (ROW)

Published: Mar 2026 289 Pages SKU: IRTNTR40630

Market Overview at a Glance

$1.91 B
Market Opportunity
22.7%
CAGR 2025 - 2030
46.4%
North America Growth
$602 Mn
FFR guidewires segment 2024

Fractional Flow Reserve Devices Market Size 2026-2030

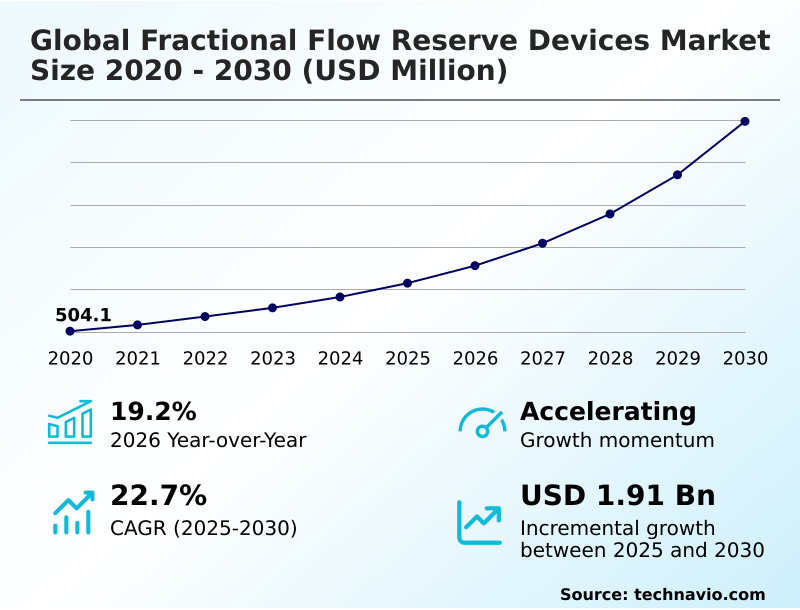
The fractional flow reserve devices market size is valued to increase by USD 1.91 billion, at a CAGR of 22.7% from 2025 to 2030. Increasing prevalence of CADs will drive the fractional flow reserve devices market.

Major Market Trends & Insights

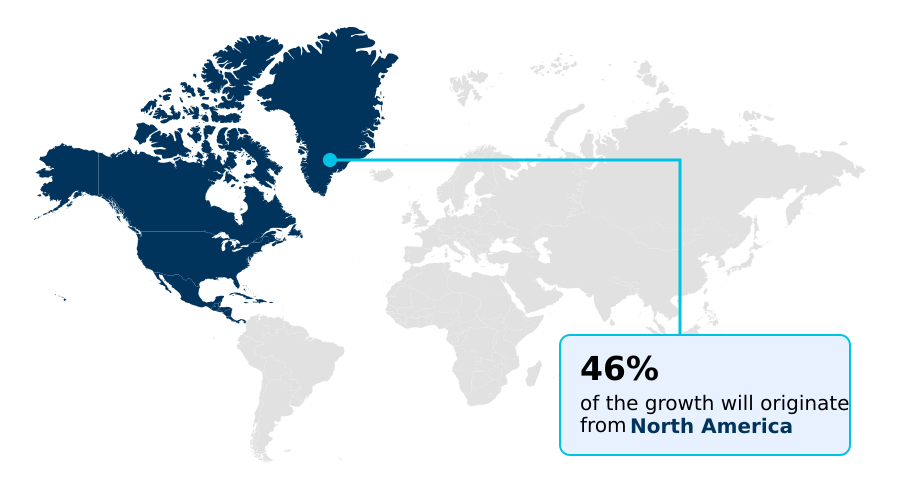
  • North America dominated the market and accounted for a 46.4% growth during the forecast period.
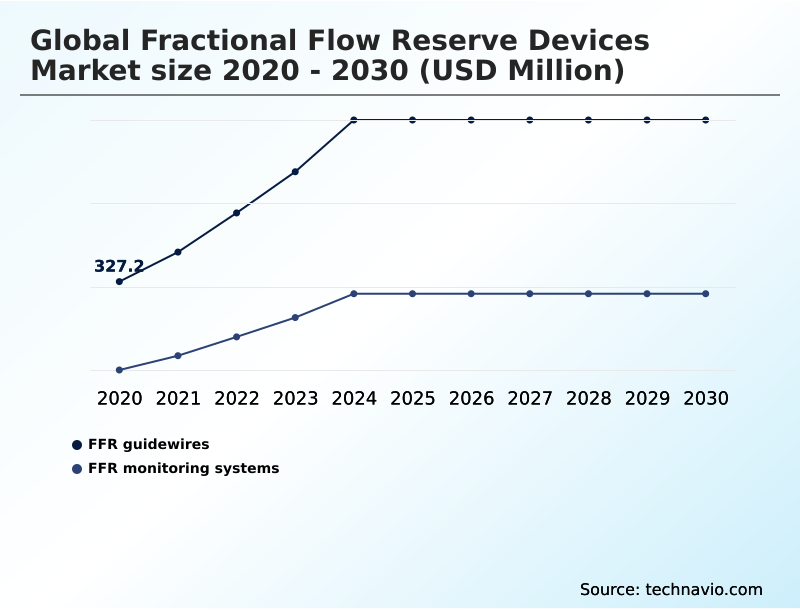
  • By Product - FFR guidewires segment was valued at USD 602 million in 2024
  • By Application - Single-vessel diseases segment accounted for the largest market revenue share in 2024

Market Size & Forecast

  • Market Opportunities: USD 2.48 billion
  • Market Future Opportunities: USD 1.91 billion
  • CAGR from 2025 to 2030 : 22.7%

Market Summary

  • The fractional flow reserve devices market is defined by a fundamental shift in interventional cardiology, moving from anatomy-based assessment toward a more precise, physiology-guided approach. This evolution is driven by the rising global incidence of coronary artery disease, which increases the need for accurate diagnostic tools to determine the hemodynamic significance of coronary artery stenosis.
  • Key trends shaping the industry include the development of non-hyperemic pressure ratios and non-invasive FFR technologies derived from CT scans, which simplify procedures and expand diagnostic reach. In one business scenario, a hospital network implemented FFR-guided protocols for all intermediate coronary lesions, resulting in a 20% reduction in unnecessary stent placements.
  • This change not only improved patient outcomes by avoiding procedural risks but also optimized cath lab resource allocation and aligned with value-based care reimbursement models. However, the market faces challenges related to the high cost of devices, inconsistent reimbursement policies in emerging economies, and a persistent shortage of interventional cardiologists skilled in advanced physiological assessment techniques.
  • Overcoming these hurdles through continued innovation, physician education, and health economic validation is crucial for sustained market expansion and improved standards of cardiac care.

What will be the Size of the Fractional Flow Reserve Devices Market during the forecast period?

Get Key Insights on Market Forecast (PDF) Request Free Sample

How is the Fractional Flow Reserve Devices Market Segmented?

The fractional flow reserve devices industry research report provides comprehensive data (region-wise segment analysis), with forecasts and estimates in "USD million" for the period 2026-2030, as well as historical data from 2020-2024 for the following segments.

  • Product
    • FFR guidewires
    • FFR monitoring systems
  • Application
    • Single-vessel diseases
    • Multi-vessel diseases
  • Technology
    • Invasive monitoring
    • Non-invasive monitoring
  • Geography
    • North America
      • US
      • Canada
      • Mexico
    • Europe
      • Germany
      • France
      • UK
    • Asia
    • Rest of World (ROW)

By Product Insights

The ffr guidewires segment is estimated to witness significant growth during the forecast period.

The global fractional flow reserve devices market is segmented by product, application, and geography. FFR guidewires represent the core consumable component, functioning as a vital single-use consumable for every procedure.

These devices are equipped with advanced pressure sensor technology to provide real-time physiological assessment.

Competition is driven by innovations that improve diagnostic accuracy and procedural efficiency, with enhanced guidewire designs demonstrating a reduction in signal drift by over 15% during complex procedures.

The market is also defined by FFR monitoring systems, which serve as the capital equipment component.

Other key segments include applications for single-vessel and multi-vessel diseases, reflecting the technology's broad utility in diverse clinical scenarios across North America, Europe, Asia, and the Rest of the World (ROW).

Request Free Sample

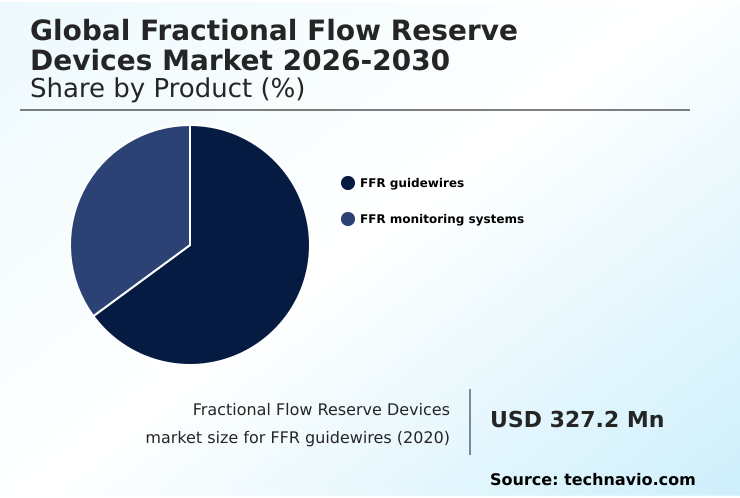
The FFR guidewires segment was valued at USD 602 million in 2024 and showed a gradual increase during the forecast period.

Request Free Sample

Regional Analysis

North America is estimated to contribute 46.4% to the growth of the global market during the forecast period.Technavio’s analysts have elaborately explained the regional trends and drivers that shape the market during the forecast period.

See How Fractional Flow Reserve Devices Market Demand is Rising in North America Request Free Sample

The geographic landscape of the fractional flow reserve devices market is characterized by significant regional disparities in adoption and growth.

North America represents the largest and most mature market, accounting for over 46% of the global opportunity, driven by sophisticated healthcare infrastructure and favorable reimbursement frameworks.

In contrast, Asia is the fastest-growing region, fueled by rising healthcare expenditure and a growing patient pool, although current FFR adoption rates in some of its key markets remain below 10%.

Europe maintains a strong position with its emphasis on evidence-based medicine and value-based healthcare initiatives. Optimizing cardiac catheterization workflows with physiological assessment tools has been shown to reduce procedure-related supply costs by up to 15% in established markets.

This cost-effectiveness analysis is becoming crucial for driving adoption in emerging economies within the Rest of the World (ROW), where both `interventional cardiologist skill` and financial constraints remain significant barriers.

Market Dynamics

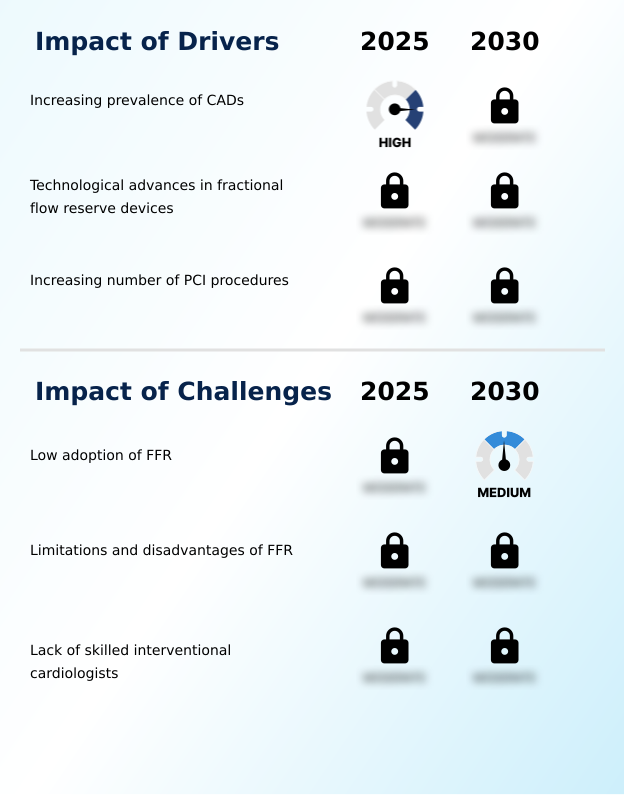
Our researchers analyzed the data with 2025 as the base year, along with the key drivers, trends, and challenges. A holistic analysis of drivers will help companies refine their marketing strategies to gain a competitive advantage.

  • Navigating the clinical complexities of coronary artery disease requires a deep understanding of advanced diagnostic tools and techniques. The ongoing debate over FFR versus iFR clinical outcomes continues to shape practice, as clinicians weigh the gold-standard hyperemic method against the procedural simplicity of non-hyperemic pressure ratios.
  • Concurrently, the shift toward minimally invasive diagnostics is evident in the growing interest in non-invasive FFRCT analysis benefits and improving angiography-derived FFR accuracy, which promise to identify ischemia without an invasive wire. These technologies are critical for complex scenarios, including FFR in bifurcation lesion assessment and FFR measurement in tandem lesions, where angiography alone is insufficient.
  • Optimizing multi-vessel disease treatment relies on creating a functional roadmap to guide interventions. However, realizing these benefits depends on overcoming FFR adoption barriers in cath labs, which include the training requirements for FFR procedures and managing FFR-negative chest pain. The future points toward virtual PCI planning using FFR data, which integrates physiological data to pre-emptively model outcomes.
  • Institutions that systematically analyze the cost-effectiveness of FFR-guided PCI have noted that for every five cases guided by physiology instead of angiography, at least one unnecessary stenting procedure is averted, significantly impacting both patient care and operational budgets.

What are the key market drivers leading to the rise in the adoption of Fractional Flow Reserve Devices Industry?

  • The primary market driver is the increasing prevalence of coronary artery diseases globally, which elevates the demand for advanced diagnostic and interventional procedures.

  • Market growth is fundamentally driven by the rising global prevalence of coronary artery disease and continuous technological advancements that enhance clinical utility. Innovations in pressure wire technology and the validation of non-hyperemic pressure ratios are promoting wider adoption.
  • The use of instantaneous wave-free ratio (iFR) simplifies the diagnostic process, offering a procedural time reduction of approximately 20% by obviating the need for hyperemic agents and mitigating patient discomfort. This advancement is crucial for patient-specific care.
  • Furthermore, a robust body of clinical evidence confirms that FFR-guided percutaneous coronary intervention (PCI) is superior to angiography-guided treatment alone, lowering the rate of major adverse cardiac events (MACE) by up to 34% and reinforcing its role in optimized treatment planning.

What are the market trends shaping the Fractional Flow Reserve Devices Industry?

  • A defining trend is the formation of strategic alliances by companies to strengthen technological capabilities and extend their global presence. These collaborations aim to integrate complementary expertise and accelerate innovation in diagnostic solutions.

  • Key trends are reshaping the market, driven by the pursuit of less invasive methods and greater procedural efficiency. The development of non-invasive technologies, particularly angiography-based FFR and computational fluid dynamics, is paramount. These innovations function as a gatekeeper technology, with studies showing their potential to reduce the need for purely diagnostic invasive procedures by over 50% in certain patient groups.
  • This shift supports value-based healthcare initiatives by reserving invasive measures for therapeutically necessary cases. Additionally, strategic alliances are accelerating the creation of integrated diagnostic platforms that combine physiological assessment with intravascular imaging. These consolidated systems enhance cardiac catheterization workflow, demonstrating an efficiency improvement of up to 15% by reducing equipment clutter and streamlining data analysis for better clinical decision-making tools.

What challenges does the Fractional Flow Reserve Devices Industry face during its growth?

  • A key challenge impeding market growth is the low adoption of FFR, even in developed countries, due to multifactorial reasons including procedural complexity and cost.

  • Despite compelling clinical data, the market faces significant challenges related to low adoption rates and procedural complexities. In many developed healthcare systems, FFR utilization for indicated PCI procedures remains below 20%, partly because the technique can add at least 10 minutes to the diagnostic workflow, a considerable factor in high-volume cardiac catheterization labs.
  • Furthermore, the reliance on hyperemic agents like adenosine is a barrier, as it can cause patient discomfort and is contraindicated in some individuals. The need for specialized interventional cardiologist skill to navigate complex lesions and interpret physiological data accurately also limits widespread use.
  • This skill gap is compounded by a projected shortage of over 6,000 cardiologists in the US alone by 2025, constraining access to advanced physiological assessment and creating a bottleneck for market growth.

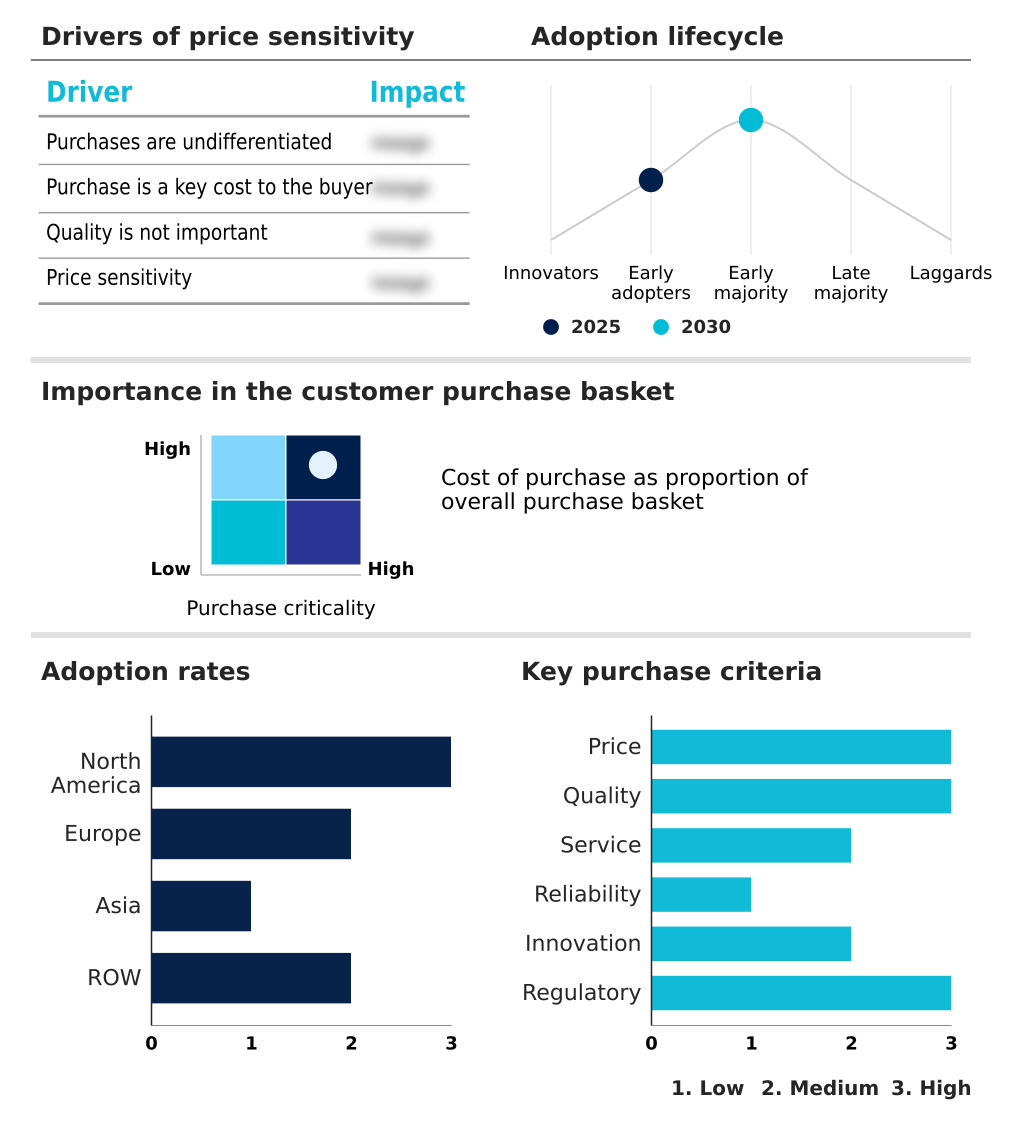
Exclusive Technavio Analysis on Customer Landscape

The fractional flow reserve devices market forecasting report includes the adoption lifecycle of the market, covering from the innovator’s stage to the laggard’s stage. It focuses on adoption rates in different regions based on penetration. Furthermore, the fractional flow reserve devices market report also includes key purchase criteria and drivers of price sensitivity to help companies evaluate and develop their market growth analysis strategies.

Customer Landscape of Fractional Flow Reserve Devices Industry

Competitive Landscape

Companies are implementing various strategies, such as strategic alliances, fractional flow reserve devices market forecast, partnerships, mergers and acquisitions, geographical expansion, and product/service launches, to enhance their presence in the industry.

Abbott Laboratories - Key offerings center on invasive and non-invasive fractional flow reserve devices that provide precise coronary physiology assessment, enabling data-driven revascularization decisions and optimizing patient outcomes.

The industry research and growth report includes detailed analyses of the competitive landscape of the market and information about key companies, including:

  • Abbott Laboratories
  • ACIST Medical Systems Inc.
  • Asahi Intecc Co. Ltd.
  • Boston Scientific Corp.
  • General Electric Co.
  • Hemolens Diagnostics sp
  • Innvolution Healthcare Ltd.
  • Kaneka Corp.
  • Keya Medical
  • Koninklijke Philips N.V.
  • Medipixel Inc.
  • Medtronic Plc
  • Opsens Inc.
  • Siemens AG
  • Spectrawave Inc.
  • Terumo Corp.
  • Zed Medical

Qualitative and quantitative analysis of companies has been conducted to help clients understand the wider business environment as well as the strengths and weaknesses of key industry players. Data is qualitatively analyzed to categorize companies as pure play, category-focused, industry-focused, and diversified; it is quantitatively analyzed to categorize companies as dominant, leading, strong, tentative, and weak.

Recent Development and News in Fractional flow reserve devices market

  • In September 2024, Abbott presented late-breaking data from its FAST-FFR III trial evaluating the clinical utility and non-inferiority of angiography-based vessel-fractional flow reserve (vFFR) compared to traditional pressure wire-based Fractional Flow Reserve (FFR).
  • In October 2024, Cardiosense received FDA clearance for its CardioTag device, a development that supports advancements in noninvasive cardiac function monitoring and contributes to technological progress in hemodynamic assessment.
  • In March 2025, Boston Scientific announced the launch of its next-generation pressure wire, which incorporates a more durable sensor and enhanced software algorithms designed to reduce signal drift during interventional cardiology procedures.
  • In March 2025, Philips Healthcare unveiled its CoroFlow IV pressure wire, featuring novel sensor technology designed to provide comprehensive physiological assessment for both epicardial vessels and the coronary microvasculature.

Dive into Technavio’s robust research methodology, blending expert interviews, extensive data synthesis, and validated models for unparalleled Fractional Flow Reserve Devices Market insights. See full methodology.

Market Scope
Page number 289
Base year 2025
Historic period 2020-2024
Forecast period 2026-2030
Growth momentum & CAGR Accelerate at a CAGR of 22.7%
Market growth 2026-2030 USD 1912.1 million
Market structure Fragmented
YoY growth 2025-2026(%) 19.2%
Key countries US, Canada, Mexico, Germany, France, UK, Italy, Spain, The Netherlands, China, Japan, India, South Korea, Indonesia, Thailand, Brazil, Saudi Arabia, South Africa, UAE, Israel, Turkey, Argentina and Colombia
Competitive landscape Leading Companies, Market Positioning of Companies, Competitive Strategies, and Industry Risks

Request Free Sample

Research Analyst Overview

  • The fractional flow reserve devices market is undergoing a significant transformation, anchored by the strategic shift from purely anatomical assessment to data-driven physiological assessment. This paradigm change is redefining revascularization decisions, making them more precise and clinically justified.
  • Central to this evolution is the use of pressure-sensing guidewire devices to measure hemodynamic significance and identify myocardial ischemia with high diagnostic accuracy, moving beyond the limitations of traditional angiography. The integration of non-hyperemic pressure ratios (NHPR) is a critical development influencing boardroom-level strategy, compelling device manufacturers to diversify R&D investments to compete.
  • For instance, facilities adopting NHPR report a reduction in procedural complexity while maintaining diagnostic performance, a value proposition that pressures incumbents to innovate. Furthermore, systems combining intravascular imaging technologies like optical coherence tomography (OCT) with coronary physiology tools have demonstrated the ability to shorten diagnostic procedure time by up to 15% compared to sequential assessments.
  • This focus on workflow efficiency and evidence-based outcomes underscores the market’s trajectory toward more integrated and intelligent solutions for managing coronary artery stenosis.

What are the Key Data Covered in this Fractional Flow Reserve Devices Market Research and Growth Report?

  • What is the expected growth of the Fractional Flow Reserve Devices Market between 2026 and 2030?

    • USD 1.91 billion, at a CAGR of 22.7%

  • What segmentation does the market report cover?

    • The report is segmented by Product (FFR guidewires, and FFR monitoring systems), Application (Single-vessel diseases, and Multi-vessel diseases), Technology (Invasive monitoring, and Non-invasive monitoring) and Geography (North America, Europe, Asia, Rest of World (ROW))

  • Which regions are analyzed in the report?

    • North America, Europe, Asia and Rest of World (ROW)

  • What are the key growth drivers and market challenges?

    • Increasing prevalence of CADs, Low adoption of FFR

  • Who are the major players in the Fractional Flow Reserve Devices Market?

    • Abbott Laboratories, ACIST Medical Systems Inc., Asahi Intecc Co. Ltd., Boston Scientific Corp., General Electric Co., Hemolens Diagnostics sp, Innvolution Healthcare Ltd., Kaneka Corp., Keya Medical, Koninklijke Philips N.V., Medipixel Inc., Medtronic Plc, Opsens Inc., Siemens AG, Spectrawave Inc., Terumo Corp. and Zed Medical

Market Research Insights

  • The market dynamics for fractional flow reserve devices reflect a balance between rapid technological innovation and persistent healthcare cost-containment pressures. The push for evidence-based intervention strategies is a significant factor, with studies showing that integrated diagnostic platforms can achieve a 15% procedural time reduction. This efficiency gain supports the adoption of patient-specific care models.
  • Concurrently, the emphasis on value-based healthcare initiatives is strong, as optimized treatment planning has been demonstrated to lower the rate of major adverse cardiac events by up to 30% compared to angiography alone.
  • Clinical decision-making tools are increasingly pivotal, but their adoption is moderated by rigorous health technology assessment processes that scrutinize both clinical efficacy and financial impact before widespread reimbursement is approved.

We can help! Our analysts can customize this fractional flow reserve devices market research report to meet your requirements.

Get in touch

1. Executive Summary

1.1 Market overview

Executive Summary - Chart on Market Overview
Executive Summary - Data Table on Market Overview
Executive Summary - Chart on Global Market Characteristics
Executive Summary - Chart on Market by Geography
Executive Summary - Chart on Market Segmentation by Product
Executive Summary - Chart on Market Segmentation by Application
Executive Summary - Chart on Market Segmentation by Technology
Executive Summary - Chart on Incremental Growth
Executive Summary - Data Table on Incremental Growth
Executive Summary - Chart on Company Market Positioning

2. Technavio Analysis

2.1 Analysis of price sensitivity, lifecycle, customer purchase basket, adoption rates, and purchase criteria

2.2 Criticality of inputs and Factors of differentiation

Chart on Overview on criticality of inputs and factors of differentiation

2.3 Factors of disruption

Chart on Overview on factors of disruption

2.4 Impact of drivers and challenges

Chart on Impact of drivers and challenges in 2025 and 2030

3. Market Landscape

3.1 Market ecosystem

Chart on Parent Market
Data Table on - Parent Market

3.2 Market characteristics

Chart on Market characteristics analysis

3.3 Value chain analysis

Chart on Value chain analysis

4. Market Sizing

4.1 Market definition

Data Table on Offerings of companies included in the market definition

4.2 Market segment analysis

Market segments

4.3 Market size 2025

4.4 Market outlook: Forecast for 2025-2030

Chart on Global - Market size and forecast 2025-2030 ($ million)
Data Table on Global - Market size and forecast 2025-2030 ($ million)
Chart on Global Market: Year-over-year growth 2025-2030 (%)
Data Table on Global Market: Year-over-year growth 2025-2030 (%)

5. Historic Market Size

5.1 Global Fractional Flow Reserve Devices Market 2020 - 2024

Historic Market Size - Data Table on Global Fractional Flow Reserve Devices Market 2020 - 2024 ($ million)

5.2 Product segment analysis 2020 - 2024

Historic Market Size - Product Segment 2020 - 2024 ($ million)

5.3 Application segment analysis 2020 - 2024

Historic Market Size - Application Segment 2020 - 2024 ($ million)

5.4 Technology segment analysis 2020 - 2024

Historic Market Size - Technology Segment 2020 - 2024 ($ million)

5.5 Geography segment analysis 2020 - 2024

Historic Market Size - Geography Segment 2020 - 2024 ($ million)

5.6 Country segment analysis 2020 - 2024

Historic Market Size - Country Segment 2020 - 2024 ($ million)

6. Qualitative Analysis

6.1 The AI impact on Global Fractional Flow Reserve Devices Market

7. Five Forces Analysis

7.1 Five forces summary

Five forces analysis - Comparison between 2025 and 2030

7.2 Bargaining power of buyers

Bargaining power of buyers - Impact of key factors 2025 and 2030

7.3 Bargaining power of suppliers

Bargaining power of suppliers - Impact of key factors in 2025 and 2030

7.4 Threat of new entrants

Threat of new entrants - Impact of key factors in 2025 and 2030

7.5 Threat of substitutes

Threat of substitutes - Impact of key factors in 2025 and 2030

7.6 Threat of rivalry

Threat of rivalry - Impact of key factors in 2025 and 2030

7.7 Market condition

Chart on Market condition - Five forces 2025 and 2030

8. Market Segmentation by Product

8.1 Market segments

Chart on Product - Market share 2025-2030 (%)
Data Table on Product - Market share 2025-2030 (%)

8.2 Comparison by Product

Chart on Comparison by Product
Data Table on Comparison by Product

8.3 FFR guidewires - Market size and forecast 2025-2030

Chart on FFR guidewires - Market size and forecast 2025-2030 ($ million)
Data Table on FFR guidewires - Market size and forecast 2025-2030 ($ million)
Chart on FFR guidewires - Year-over-year growth 2025-2030 (%)
Data Table on FFR guidewires - Year-over-year growth 2025-2030 (%)

8.4 FFR monitoring systems - Market size and forecast 2025-2030

Chart on FFR monitoring systems - Market size and forecast 2025-2030 ($ million)
Data Table on FFR monitoring systems - Market size and forecast 2025-2030 ($ million)
Chart on FFR monitoring systems - Year-over-year growth 2025-2030 (%)
Data Table on FFR monitoring systems - Year-over-year growth 2025-2030 (%)

8.5 Market opportunity by Product

Market opportunity by Product ($ million)
Data Table on Market opportunity by Product ($ million)

9. Market Segmentation by Application

9.1 Market segments

Chart on Application - Market share 2025-2030 (%)
Data Table on Application - Market share 2025-2030 (%)

9.2 Comparison by Application

Chart on Comparison by Application
Data Table on Comparison by Application

9.3 Single-vessel diseases - Market size and forecast 2025-2030

Chart on Single-vessel diseases - Market size and forecast 2025-2030 ($ million)
Data Table on Single-vessel diseases - Market size and forecast 2025-2030 ($ million)
Chart on Single-vessel diseases - Year-over-year growth 2025-2030 (%)
Data Table on Single-vessel diseases - Year-over-year growth 2025-2030 (%)

9.4 Multi-vessel diseases - Market size and forecast 2025-2030

Chart on Multi-vessel diseases - Market size and forecast 2025-2030 ($ million)
Data Table on Multi-vessel diseases - Market size and forecast 2025-2030 ($ million)
Chart on Multi-vessel diseases - Year-over-year growth 2025-2030 (%)
Data Table on Multi-vessel diseases - Year-over-year growth 2025-2030 (%)

9.5 Market opportunity by Application

Market opportunity by Application ($ million)
Data Table on Market opportunity by Application ($ million)

10. Market Segmentation by Technology

10.1 Market segments

Chart on Technology - Market share 2025-2030 (%)
Data Table on Technology - Market share 2025-2030 (%)

10.2 Comparison by Technology

Chart on Comparison by Technology
Data Table on Comparison by Technology

10.3 Invasive monitoring - Market size and forecast 2025-2030

Chart on Invasive monitoring - Market size and forecast 2025-2030 ($ million)
Data Table on Invasive monitoring - Market size and forecast 2025-2030 ($ million)
Chart on Invasive monitoring - Year-over-year growth 2025-2030 (%)
Data Table on Invasive monitoring - Year-over-year growth 2025-2030 (%)

10.4 Non-invasive monitoring - Market size and forecast 2025-2030

Chart on Non-invasive monitoring - Market size and forecast 2025-2030 ($ million)
Data Table on Non-invasive monitoring - Market size and forecast 2025-2030 ($ million)
Chart on Non-invasive monitoring - Year-over-year growth 2025-2030 (%)
Data Table on Non-invasive monitoring - Year-over-year growth 2025-2030 (%)

10.5 Market opportunity by Technology

Market opportunity by Technology ($ million)
Data Table on Market opportunity by Technology ($ million)

11. Customer Landscape

11.1 Customer landscape overview

Analysis of price sensitivity, lifecycle, customer purchase basket, adoption rates, and purchase criteria

12. Geographic Landscape

12.1 Geographic segmentation

Chart on Market share by geography 2025-2030 (%)
Data Table on Market share by geography 2025-2030 (%)

12.2 Geographic comparison

Chart on Geographic comparison
Data Table on Geographic comparison

12.3 North America - Market size and forecast 2025-2030

Chart on North America - Market size and forecast 2025-2030 ($ million)
Data Table on North America - Market size and forecast 2025-2030 ($ million)
Chart on North America - Year-over-year growth 2025-2030 (%)
Data Table on North America - Year-over-year growth 2025-2030 (%)
Chart on Regional Comparison - North America
Data Table on Regional Comparison - North America

12.3.1 US - Market size and forecast 2025-2030

Chart on US - Market size and forecast 2025-2030 ($ million)
Data Table on US - Market size and forecast 2025-2030 ($ million)
Chart on US - Year-over-year growth 2025-2030 (%)
Data Table on US - Year-over-year growth 2025-2030 (%)

12.3.2 Canada - Market size and forecast 2025-2030

Chart on Canada - Market size and forecast 2025-2030 ($ million)
Data Table on Canada - Market size and forecast 2025-2030 ($ million)
Chart on Canada - Year-over-year growth 2025-2030 (%)
Data Table on Canada - Year-over-year growth 2025-2030 (%)

12.3.3 Mexico - Market size and forecast 2025-2030

Chart on Mexico - Market size and forecast 2025-2030 ($ million)
Data Table on Mexico - Market size and forecast 2025-2030 ($ million)
Chart on Mexico - Year-over-year growth 2025-2030 (%)
Data Table on Mexico - Year-over-year growth 2025-2030 (%)

12.4 Europe - Market size and forecast 2025-2030

Chart on Europe - Market size and forecast 2025-2030 ($ million)
Data Table on Europe - Market size and forecast 2025-2030 ($ million)
Chart on Europe - Year-over-year growth 2025-2030 (%)
Data Table on Europe - Year-over-year growth 2025-2030 (%)
Chart on Regional Comparison - Europe
Data Table on Regional Comparison - Europe

12.4.1 Germany - Market size and forecast 2025-2030

Chart on Germany - Market size and forecast 2025-2030 ($ million)
Data Table on Germany - Market size and forecast 2025-2030 ($ million)
Chart on Germany - Year-over-year growth 2025-2030 (%)
Data Table on Germany - Year-over-year growth 2025-2030 (%)

12.4.2 France - Market size and forecast 2025-2030

Chart on France - Market size and forecast 2025-2030 ($ million)
Data Table on France - Market size and forecast 2025-2030 ($ million)
Chart on France - Year-over-year growth 2025-2030 (%)
Data Table on France - Year-over-year growth 2025-2030 (%)

12.4.3 UK - Market size and forecast 2025-2030

Chart on UK - Market size and forecast 2025-2030 ($ million)
Data Table on UK - Market size and forecast 2025-2030 ($ million)
Chart on UK - Year-over-year growth 2025-2030 (%)
Data Table on UK - Year-over-year growth 2025-2030 (%)

12.4.4 Italy - Market size and forecast 2025-2030

Chart on Italy - Market size and forecast 2025-2030 ($ million)
Data Table on Italy - Market size and forecast 2025-2030 ($ million)
Chart on Italy - Year-over-year growth 2025-2030 (%)
Data Table on Italy - Year-over-year growth 2025-2030 (%)

12.4.5 Spain - Market size and forecast 2025-2030

Chart on Spain - Market size and forecast 2025-2030 ($ million)
Data Table on Spain - Market size and forecast 2025-2030 ($ million)
Chart on Spain - Year-over-year growth 2025-2030 (%)
Data Table on Spain - Year-over-year growth 2025-2030 (%)

12.4.6 The Netherlands - Market size and forecast 2025-2030

Chart on The Netherlands - Market size and forecast 2025-2030 ($ million)
Data Table on The Netherlands - Market size and forecast 2025-2030 ($ million)
Chart on The Netherlands - Year-over-year growth 2025-2030 (%)
Data Table on The Netherlands - Year-over-year growth 2025-2030 (%)

12.5 Asia - Market size and forecast 2025-2030

Chart on Asia - Market size and forecast 2025-2030 ($ million)
Data Table on Asia - Market size and forecast 2025-2030 ($ million)
Chart on Asia - Year-over-year growth 2025-2030 (%)
Data Table on Asia - Year-over-year growth 2025-2030 (%)
Chart on Regional Comparison - Asia
Data Table on Regional Comparison - Asia

12.5.1 China - Market size and forecast 2025-2030

Chart on China - Market size and forecast 2025-2030 ($ million)
Data Table on China - Market size and forecast 2025-2030 ($ million)
Chart on China - Year-over-year growth 2025-2030 (%)
Data Table on China - Year-over-year growth 2025-2030 (%)

12.5.2 Japan - Market size and forecast 2025-2030

Chart on Japan - Market size and forecast 2025-2030 ($ million)
Data Table on Japan - Market size and forecast 2025-2030 ($ million)
Chart on Japan - Year-over-year growth 2025-2030 (%)
Data Table on Japan - Year-over-year growth 2025-2030 (%)

12.5.3 India - Market size and forecast 2025-2030

Chart on India - Market size and forecast 2025-2030 ($ million)
Data Table on India - Market size and forecast 2025-2030 ($ million)
Chart on India - Year-over-year growth 2025-2030 (%)
Data Table on India - Year-over-year growth 2025-2030 (%)

12.5.4 South Korea - Market size and forecast 2025-2030

Chart on South Korea - Market size and forecast 2025-2030 ($ million)
Data Table on South Korea - Market size and forecast 2025-2030 ($ million)
Chart on South Korea - Year-over-year growth 2025-2030 (%)
Data Table on South Korea - Year-over-year growth 2025-2030 (%)

12.5.5 Indonesia - Market size and forecast 2025-2030

Chart on Indonesia - Market size and forecast 2025-2030 ($ million)
Data Table on Indonesia - Market size and forecast 2025-2030 ($ million)
Chart on Indonesia - Year-over-year growth 2025-2030 (%)
Data Table on Indonesia - Year-over-year growth 2025-2030 (%)

12.5.6 Thailand - Market size and forecast 2025-2030

Chart on Thailand - Market size and forecast 2025-2030 ($ million)
Data Table on Thailand - Market size and forecast 2025-2030 ($ million)
Chart on Thailand - Year-over-year growth 2025-2030 (%)
Data Table on Thailand - Year-over-year growth 2025-2030 (%)

12.6 Rest of World (ROW) - Market size and forecast 2025-2030

Chart on Rest of World (ROW) - Market size and forecast 2025-2030 ($ million)
Data Table on Rest of World (ROW) - Market size and forecast 2025-2030 ($ million)
Chart on Rest of World (ROW) - Year-over-year growth 2025-2030 (%)
Data Table on Rest of World (ROW) - Year-over-year growth 2025-2030 (%)
Chart on Regional Comparison - Rest of World (ROW)
Data Table on Regional Comparison - Rest of World (ROW)

12.6.1 Brazil - Market size and forecast 2025-2030

Chart on Brazil - Market size and forecast 2025-2030 ($ million)
Data Table on Brazil - Market size and forecast 2025-2030 ($ million)
Chart on Brazil - Year-over-year growth 2025-2030 (%)
Data Table on Brazil - Year-over-year growth 2025-2030 (%)

12.6.2 Saudi Arabia - Market size and forecast 2025-2030

Chart on Saudi Arabia - Market size and forecast 2025-2030 ($ million)
Data Table on Saudi Arabia - Market size and forecast 2025-2030 ($ million)
Chart on Saudi Arabia - Year-over-year growth 2025-2030 (%)
Data Table on Saudi Arabia - Year-over-year growth 2025-2030 (%)

12.6.3 South Africa - Market size and forecast 2025-2030

Chart on South Africa - Market size and forecast 2025-2030 ($ million)
Data Table on South Africa - Market size and forecast 2025-2030 ($ million)
Chart on South Africa - Year-over-year growth 2025-2030 (%)
Data Table on South Africa - Year-over-year growth 2025-2030 (%)

12.6.4 UAE - Market size and forecast 2025-2030

Chart on UAE - Market size and forecast 2025-2030 ($ million)
Data Table on UAE - Market size and forecast 2025-2030 ($ million)
Chart on UAE - Year-over-year growth 2025-2030 (%)
Data Table on UAE - Year-over-year growth 2025-2030 (%)

12.6.5 Israel - Market size and forecast 2025-2030

Chart on Israel - Market size and forecast 2025-2030 ($ million)
Data Table on Israel - Market size and forecast 2025-2030 ($ million)
Chart on Israel - Year-over-year growth 2025-2030 (%)
Data Table on Israel - Year-over-year growth 2025-2030 (%)

12.6.6 Turkey - Market size and forecast 2025-2030

Chart on Turkey - Market size and forecast 2025-2030 ($ million)
Data Table on Turkey - Market size and forecast 2025-2030 ($ million)
Chart on Turkey - Year-over-year growth 2025-2030 (%)
Data Table on Turkey - Year-over-year growth 2025-2030 (%)

12.6.7 Argentina - Market size and forecast 2025-2030

Chart on Argentina - Market size and forecast 2025-2030 ($ million)
Data Table on Argentina - Market size and forecast 2025-2030 ($ million)
Chart on Argentina - Year-over-year growth 2025-2030 (%)
Data Table on Argentina - Year-over-year growth 2025-2030 (%)

12.6.8 Colombia - Market size and forecast 2025-2030

Chart on Colombia - Market size and forecast 2025-2030 ($ million)
Data Table on Colombia - Market size and forecast 2025-2030 ($ million)
Chart on Colombia - Year-over-year growth 2025-2030 (%)
Data Table on Colombia - Year-over-year growth 2025-2030 (%)

12.7 Market opportunity by geography

Market opportunity by geography ($ million)
Data Tables on Market opportunity by geography ($ million)

13. Drivers, Challenges, and Opportunity

13.1 Market drivers

Increasing prevalence of CADs
Technological advances in fractional flow reserve devices
Increasing number of PCI procedures

13.2 Market challenges

Low adoption of FFR
Limitations and disadvantages of FFR
Lack of skilled interventional cardiologists

13.3 Impact of drivers and challenges

Impact of drivers and challenges in 2025 and 2030

13.4 Market opportunities

Strategic alliances by companies
Increasing focus on non-invasive FFR
Government initiatives towards increasing awareness of CADs and providing affordable treatment

14. Competitive Landscape

14.1 Overview

14.2

Overview on criticality of inputs and factors of differentiation

14.3 Landscape disruption

Overview on factors of disruption

14.4 Industry risks

Impact of key risks on business

15. Competitive Analysis

15.1 Companies profiled

Companies covered

15.2 Company ranking index

15.3 Market positioning of companies

Matrix on companies position and classification

15.4 Abbott Laboratories

Abbott Laboratories - Overview
Abbott Laboratories - Business segments
Abbott Laboratories - Key news
Abbott Laboratories - Key offerings
Abbott Laboratories - Segment focus
SWOT

15.5 ACIST Medical Systems Inc.

ACIST Medical Systems Inc. - Overview
ACIST Medical Systems Inc. - Product / Service
ACIST Medical Systems Inc. - Key offerings
SWOT

15.6 Asahi Intecc Co. Ltd.

Asahi Intecc Co. Ltd. - Overview
Asahi Intecc Co. Ltd. - Business segments
Asahi Intecc Co. Ltd. - Key offerings
Asahi Intecc Co. Ltd. - Segment focus
SWOT

15.7 Boston Scientific Corp.

Boston Scientific Corp. - Overview
Boston Scientific Corp. - Business segments
Boston Scientific Corp. - Key news
Boston Scientific Corp. - Key offerings
Boston Scientific Corp. - Segment focus
SWOT

15.8 General Electric Co.

General Electric Co. - Overview
General Electric Co. - Business segments
General Electric Co. - Key news
General Electric Co. - Key offerings
General Electric Co. - Segment focus
SWOT

15.9 Innvolution Healthcare Ltd.

Innvolution Healthcare Ltd. - Overview
Innvolution Healthcare Ltd. - Product / Service
Innvolution Healthcare Ltd. - Key offerings
SWOT

15.10 Kaneka Corp.

Kaneka Corp. - Overview
Kaneka Corp. - Business segments
Kaneka Corp. - Key news
Kaneka Corp. - Key offerings
Kaneka Corp. - Segment focus
SWOT

15.11 Keya Medical

Keya Medical - Overview
Keya Medical - Product / Service
Keya Medical - Key offerings
SWOT

15.12 Koninklijke Philips N.V.

Koninklijke Philips N.V. - Overview
Koninklijke Philips N.V. - Business segments
Koninklijke Philips N.V. - Key news
Koninklijke Philips N.V. - Key offerings
Koninklijke Philips N.V. - Segment focus
SWOT

15.13 Medipixel Inc.

Medipixel Inc. - Overview
Medipixel Inc. - Product / Service
Medipixel Inc. - Key offerings
SWOT

15.14 Medtronic Plc

Medtronic Plc - Overview
Medtronic Plc - Business segments
Medtronic Plc - Key news
Medtronic Plc - Key offerings
Medtronic Plc - Segment focus
SWOT

15.15 Opsens Inc.

Opsens Inc. - Overview
Opsens Inc. - Product / Service
Opsens Inc. - Key offerings
SWOT

15.16 Siemens AG

Siemens AG - Overview
Siemens AG - Business segments
Siemens AG - Key news
Siemens AG - Key offerings
Siemens AG - Segment focus
SWOT

15.17 Spectrawave Inc.

Spectrawave Inc. - Overview
Spectrawave Inc. - Product / Service
Spectrawave Inc. - Key offerings
SWOT

15.18 Terumo Corp.

Terumo Corp. - Overview
Terumo Corp. - Business segments
Terumo Corp. - Key news
Terumo Corp. - Key offerings
Terumo Corp. - Segment focus
SWOT

16. Appendix

16.1 Scope of the report

Market definition
Objectives
Notes and caveats

16.2 Inclusions and exclusions checklist

Inclusions checklist
Exclusions checklist

16.3 Currency conversion rates for US$

16.4 Research methodology

16.5 Data procurement

Information sources

16.6 Data validation

16.7 Validation techniques employed for market sizing

16.8 Data synthesis

16.9 360 degree market analysis

16.10 List of abbreviations

Research Methodology

Technavio presents a detailed picture of the market by way of study, synthesis, and summation of data from multiple sources. The analysts have presented the various facets of the market with a particular focus on identifying the key industry influencers. The data thus presented is comprehensive, reliable, and the result of extensive research, both primary and secondary.

INFORMATION SOURCES

Primary sources

  • Manufacturers and suppliers
  • Channel partners
  • Industry experts
  • Strategic decision makers

Secondary sources

  • Industry journals and periodicals
  • Government data
  • Financial reports of key industry players
  • Historical data
  • Press releases

DATA ANALYSIS

Data Synthesis

  • Collation of data
  • Estimation of key figures
  • Analysis of derived insights

Data Validation

  • Triangulation with data models
  • Reference against proprietary databases
  • Corroboration with industry experts

REPORT WRITING

Qualitative

  • Market drivers
  • Market challenges
  • Market trends
  • Five forces analysis

Quantitative

  • Market size and forecast
  • Market segmentation
  • Geographical insights
  • Competitive landscape

Interested in this report?

Get your sample now to see our research methodology and insights!

Download Now

Frequently Asked Questions

Fractional Flow Reserve Devices market growth will increase by USD 1912.1 million during 2026-2030.

The Fractional Flow Reserve Devices market is expected to grow at a CAGR of 22.7% during 2026-2030.

Fractional Flow Reserve Devices market is segmented by Product (FFR guidewires, FFR monitoring systems) Application (Single-vessel diseases, Multi-vessel diseases) Technology (Invasive monitoring, Non-invasive monitoring)

Abbott Laboratories, ACIST Medical Systems Inc., Asahi Intecc Co. Ltd., Boston Scientific Corp., General Electric Co., Hemolens Diagnostics sp, Innvolution Healthcare Ltd., Kaneka Corp., Keya Medical, Koninklijke Philips N.V., Medipixel Inc., Medtronic Plc, Opsens Inc., Siemens AG, Spectrawave Inc., Terumo Corp., Zed Medical are a few of the key vendors in the Fractional Flow Reserve Devices market.

North America will register the highest growth rate of 46.4% among the other regions. Therefore, the Fractional Flow Reserve Devices market in North America is expected to garner significant business opportunities for the vendors during the forecast period.

US, Canada, Mexico, Germany, France, UK, Italy, Spain, The Netherlands, China, Japan, India, South Korea, Indonesia, Thailand, Brazil, Saudi Arabia, South Africa, UAE, Israel, Turkey, Argentina, Colombia

  • Increasing prevalence of CADs is the driving factor this market.

The Fractional Flow Reserve Devices market vendors should focus on grabbing business opportunities from the Product segment as it accounted for the largest market share in the base year.
RIA - Research AI Assistant
Ask RIA