Friction Stir Welding Equipment Market Analysis, Size, and Forecast 2026-2030: APAC (China, India, and Japan), North America (US, Canada, and Mexico), Europe (Germany, UK, and France), South America (Brazil, Argentina, and Colombia), Middle East and Africa (South Africa, Saudi Arabia, and UAE), and Rest of World (ROW)

Friction Stir Welding Equipment Market Analysis, Size, and Forecast 2026-2030:
APAC (China, India, and Japan), North America (US, Canada, and Mexico), Europe (Germany, UK, and France), South America (Brazil, Argentina, and Colombia), Middle East and Africa (South Africa, Saudi Arabia, and UAE), and Rest of World (ROW)

Published: Dec 2025 297 Pages SKU: IRTNTR40468

Market Overview at a Glance

$89.8 Mn
Market Opportunity
6.3%
CAGR 2025 - 2030
40.6%
APAC Growth
$103.2 Mn
Fixed FSW equipment segment 2024

Friction Stir Welding Equipment Market Size 2026-2030

The friction stir welding equipment market size is valued to increase by USD 89.8 million, at a CAGR of 6.3% from 2025 to 2030. Surging demand for lightweight materials in aerospace and space exploration will drive the friction stir welding equipment market.

Major Market Trends & Insights

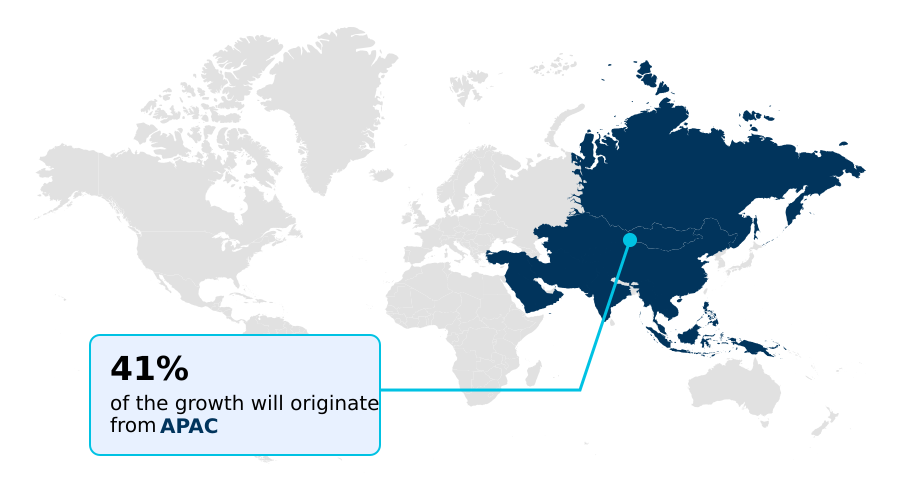
  • APAC dominated the market and accounted for a 40.6% growth during the forecast period.
  • By Product Type - Fixed FSW equipment segment was valued at USD 103.2 million in 2024
  • By End-user - Automotive industry segment accounted for the largest market revenue share in 2024

Market Size & Forecast

  • Market Opportunities: USD 138.6 million
  • Market Future Opportunities: USD 89.8 million
  • CAGR from 2025 to 2030 : 6.3%

Market Summary

  • The friction stir welding equipment market is transitioning from a niche technology to a mainstream manufacturing process, underpinned by demands from the electric vehicle and aerospace sectors. The imperative for lightweight manufacturing to improve efficiency and performance drives adoption, with solid-state joining technology being essential for high-strength aluminum alloys used in battery enclosure manufacturing and cryogenic fuel tanks.
  • This shift is supported by the integration of Industry 4.0, where a smart fsw machining center equipped with force-control software and advanced sensor arrays enables real-time data monitoring and predictive maintenance capabilities.
  • For instance, an automotive OEM developing a new EV platform must weigh the benefits of achieving superior structural integrity and leak-proof performance from a solid-state joining process against the higher capital expenditure and slower cycle times of robotic friction stir welding compared to alternatives.
  • Although high initial costs and a shortage of skilled operators present challenges, the move toward automated joining solutions and hybrid multi-tasking machine systems mitigates these issues, enhancing process repeatability and expanding applications for dissimilar material joining.

What will be the Size of the Friction Stir Welding Equipment Market during the forecast period?

Get Key Insights on Market Forecast (PDF) Request Free Sample

How is the Friction Stir Welding Equipment Market Segmented?

The friction stir welding equipment industry research report provides comprehensive data (region-wise segment analysis), with forecasts and estimates in "USD million" for the period 2026-2030, as well as historical data from 2020-2024 for the following segments.

  • Product type
    • Fixed FSW equipment
    • Mobile FSW equipment
    • Robotic FSW equipment
  • End-user
    • Automotive industry
    • Aerospace industry
    • Railway industry
    • Shipbuilding industry
    • Others
  • Type
    • Gantry machines
    • Linear seam machine
  • Geography
    • APAC
      • China
      • India
      • Japan
    • North America
      • US
      • Canada
      • Mexico
    • Europe
      • Germany
      • UK
      • France
    • South America
      • Brazil
      • Argentina
      • Colombia
    • Middle East and Africa
      • South Africa
      • Saudi Arabia
      • UAE
    • Rest of World (ROW)

By Product Type Insights

The fixed fsw equipment segment is estimated to witness significant growth during the forecast period.

The market is segmented by product type, end-user, and geography. Fixed FSW equipment, including large gantry-style machines and vertical gantry FSW systems, remains fundamental for lightweight manufacturing.

These systems provide the high structural stiffness required to apply immense forging pressure, ensuring the structural integrity of high-strength aluminum alloys.

Their application in joining double-skin aluminum extrusions for railcars demonstrates effective thermal distortion control, a critical factor for achieving zero-defect manufacturing.

By utilizing robust clamping fixtures, these machines deliver superior fatigue resistance, essential for heavy industrial applications where performance and durability are paramount. This capability results in defect rate reductions of up to 40% compared to traditional joining methods.

Request Free Sample

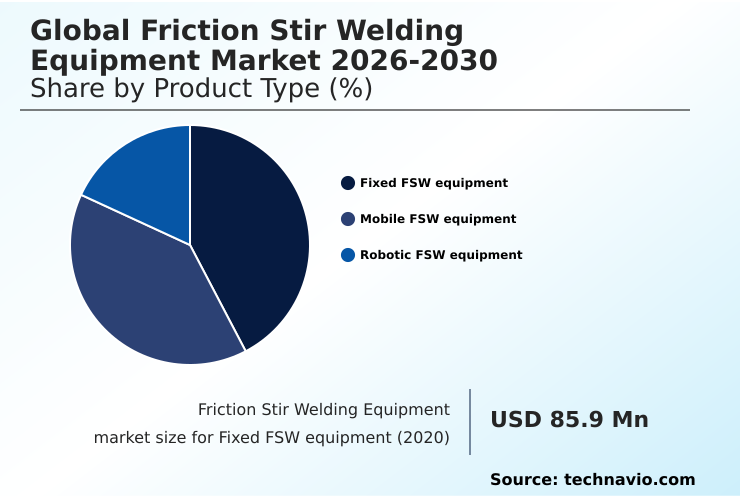
The Fixed FSW equipment segment was valued at USD 103.2 million in 2024 and showed a gradual increase during the forecast period.

Request Free Sample

Regional Analysis

APAC is estimated to contribute 40.6% to the growth of the global market during the forecast period.Technavio’s analysts have elaborately explained the regional trends and drivers that shape the market during the forecast period.

See How Friction Stir Welding Equipment Market Demand is Rising in APAC Request Free Sample

The geographic landscape of the friction stir welding equipment market is led by APAC, which accounts for over 40% of the market's incremental growth, driven by massive high-speed rail and shipbuilding projects.

North America focuses on high-value aerospace applications where the adoption of dissimilar material joining techniques in a high-rigidity robot series reduces assembly defects by up to 15%.

In Europe, the focus is on e-mobility and green energy, with a push toward supply chain localization for electric vehicle components. This has increased demand for automated inspection systems and hybrid multi-tasking machine tools.

The use of friction stir spot welding and refill friction stir spot welding is expanding globally, enhancing process repeatability in automotive body-in-white applications. This regional diversification underscores a global trend toward advanced manufacturing capabilities and specialized weld quality monitoring.

Market Dynamics

Our researchers analyzed the data with 2025 as the base year, along with the key drivers, trends, and challenges. A holistic analysis of drivers will help companies refine their marketing strategies to gain a competitive advantage.

  • A key strategic decision for manufacturers is the friction stir welding vs laser welding debate, especially for joining dissimilar materials in automotive applications. While laser welding offers speed, friction stir welding for aluminum alloys provides superior joint quality, which is critical for fsw equipment for electric vehicle batteries.
  • FSW applications in aerospace sector capitalize on this technology's ability to create defect-free welds in fsw for cryogenic tank fabrication. The choice between large gantries and robotic fsw for complex geometries depends on part complexity and production volume.
  • Central to successful implementation is optimizing fsw process parameters to ensure consistent results, particularly when working with fsw for high strength aluminum alloys. Advancements in fsw tool materials are expanding capabilities for fsw for thick plate welding and enabling new friction stir spot welding applications.
  • The cost analysis of fsw equipment reveals that while initial investment is high, operational savings are significant, a crucial factor in the fsw in marine and shipbuilding industry and for fsw for railway rolling stock.
  • Overcoming challenges in friction stir welding, such as the need for specialized skills and fixtures, is key to realizing the full benefits of solid state joining. The ability of fsw for copper to aluminum joints is also driving adoption in power electronics, while fsw integration with cnc machines lowers the barrier to entry for smaller shops.
  • Ultimately, robust quality control in friction stir welding, which can reduce post-weld inspection times by more than 50% compared to fusion processes, underpins its value proposition.

What are the key market drivers leading to the rise in the adoption of Friction Stir Welding Equipment Industry?

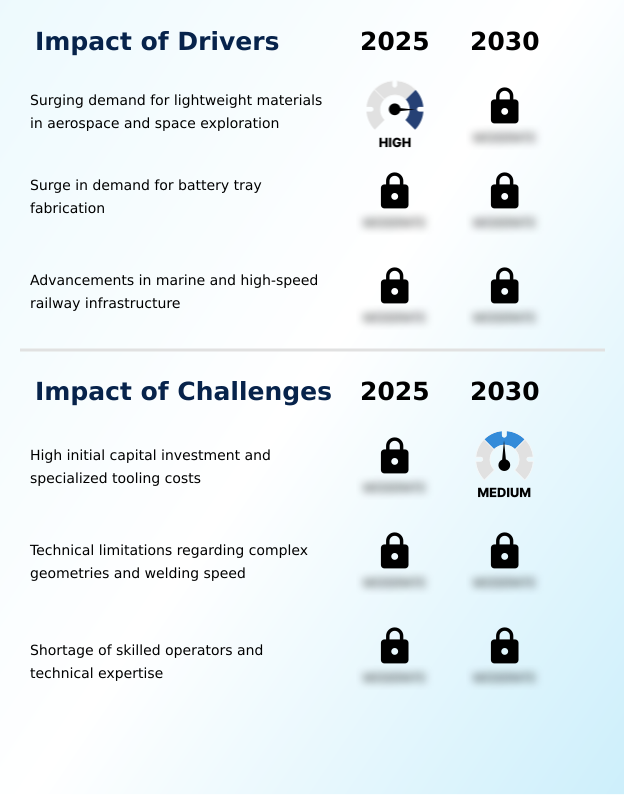
  • A key market driver is the surging demand for lightweight materials within the aerospace and space exploration sectors, where advanced joining technologies are critical.

  • Market growth is primarily driven by the aerospace and energy sectors' demand for advanced manufacturing capabilities.
  • The solid-state joining process is critical for fabricating components from corrosion-resistant alloys and aluminum-lithium alloys, ensuring the metallurgical integrity and leak-proof performance of items like cryogenic fuel tanks.
  • This solid-state joining technology is superior to fusion methods as it minimizes the heat-affected zone, which is validated through rigorous non-destructive testing. The development of mobile FSW equipment allows for in-situ repairs and construction, expanding applications.
  • A joining technology evaluation by aerospace firms often reveals that FSW joints have a fatigue life more than double that of conventional welds, ensuring superior joint integrity for mission-critical structures.

What are the market trends shaping the Friction Stir Welding Equipment Industry?

  • A key market trend is the accelerated adoption of friction stir welding equipment, driven by its increasing use in manufacturing electric vehicle battery enclosures.

  • Key trends are reshaping the market, led by the proliferation of robotic friction stir welding for high-volume battery enclosure manufacturing. The use of high-payload industrial robotics equipped with advanced FSW end-effectors enables automated joining solutions with exceptional path accuracy.
  • This shift toward automation is complemented by the rise of the smart FSW machining center, which integrates force-control software and advanced sensor arrays for real-time data monitoring. These systems feed information to digital twin models, enabling predictive maintenance capabilities that can reduce unplanned downtime by over 25%.
  • Such innovations are driving a significant cycle time reduction, with some applications achieving improvements of more than 30%, enhancing process repeatability across production lines.

What challenges does the Friction Stir Welding Equipment Industry face during its growth?

  • The high initial capital investment required for equipment and specialized tooling presents a key challenge to the friction stir welding equipment market's growth.

  • Significant challenges constrain market adoption, centered on the complexity and cost of implementation. The successful application of this thermo-mechanical process requires deep expertise in material flow dynamics and tool-workpiece interaction, creating a need for extensive process parameter optimization of tool rotation speed, traverse speed, and plunge depth.
  • The high upfront capital expenditure strategy for acquiring 5-axis FSW machines or even portable FSW units remains a major hurdle for smaller enterprises. Furthermore, effective production line integration is complex, as it often requires custom welding process control software and advanced automated inspection systems. This complexity can delay project ramp-up by as much as six months, impacting return on investment.

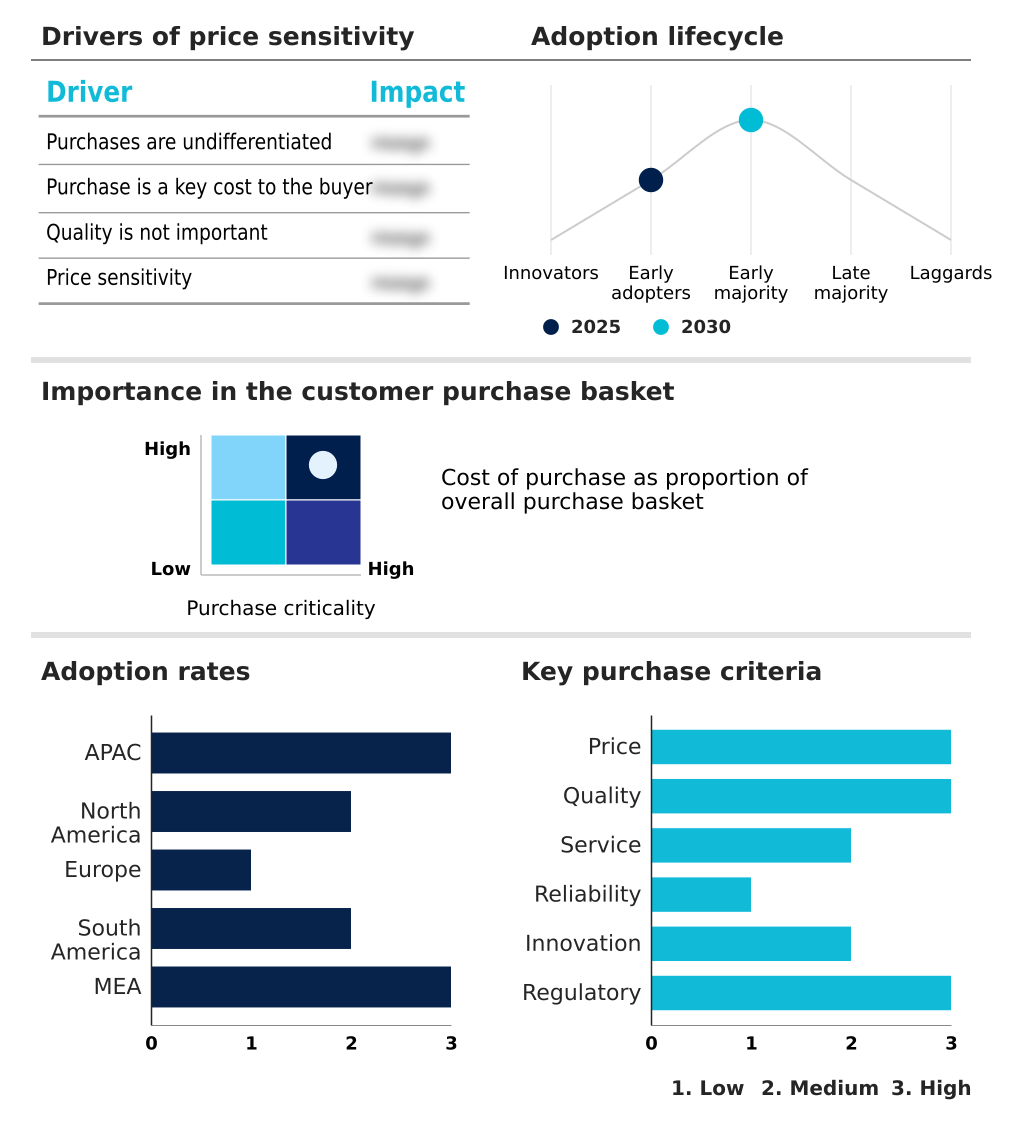
Exclusive Technavio Analysis on Customer Landscape

The friction stir welding equipment market forecasting report includes the adoption lifecycle of the market, covering from the innovator’s stage to the laggard’s stage. It focuses on adoption rates in different regions based on penetration. Furthermore, the friction stir welding equipment market report also includes key purchase criteria and drivers of price sensitivity to help companies evaluate and develop their market growth analysis strategies.

Customer Landscape of Friction Stir Welding Equipment Industry

Competitive Landscape

Companies are implementing various strategies, such as strategic alliances, friction stir welding equipment market forecast, partnerships, mergers and acquisitions, geographical expansion, and product/service launches, to enhance their presence in the industry.

Advanced Integration Tech. LP - Specialized FSW heads transform standard CNC machines into advanced solid-state joining systems, significantly lowering the barrier to adoption for high-integrity welding applications.

The industry research and growth report includes detailed analyses of the competitive landscape of the market and information about key companies, including:

  • Advanced Integration Tech. LP
  • AEE Co. Ltd
  • Beijing FSW Technology Co. Ltd.
  • Bond Technologies, LLC.
  • Chongqing CME
  • ETA Technology Pvt. Ltd.
  • FOOKE GmbH
  • Friction Welding Tech Pvt. Ltd.
  • Grenzebach Maschinenbau GmbH
  • Hwacheon Machine Tool Co Ltd
  • KUKA AG
  • Manufacturing Technology Inc.
  • PaR Systems LLC
  • PTG Holroyd
  • Sakae Industries Co. Ltd.
  • Stirweld
  • The Lincoln Electric Co.
  • TRA-C industrie
  • TWI Ltd.
  • Yamazaki Mazak Corp.

Qualitative and quantitative analysis of companies has been conducted to help clients understand the wider business environment as well as the strengths and weaknesses of key industry players. Data is qualitatively analyzed to categorize companies as pure play, category-focused, industry-focused, and diversified; it is quantitatively analyzed to categorize companies as dominant, leading, strong, tentative, and weak.

Recent Development and News in Friction stir welding equipment market

  • In September, 2024, Ford Motor Company announced a major collaboration with a specialized welding automation firm to deploy high-speed friction stir welding lines for producing electric truck frames.
  • In November, 2024, KUKA AG demonstrated a new high-rigidity robot series specifically engineered for friction stir welding applications, featuring enhanced stiffness to minimize deflection during welding of curved aerospace panels.
  • In February, 2025, Mazak Corporation introduced a smart FSW machining center with an AI-driven control system capable of detecting potential tool failures by analyzing vibration and thermal signatures.
  • In March, 2025, Kawasaki Heavy Industries deployed a fleet of robotic FSW systems at a shipyard in Kobe to automate the welding of double-hull structures for commercial vessels.

Dive into Technavio’s robust research methodology, blending expert interviews, extensive data synthesis, and validated models for unparalleled Friction Stir Welding Equipment Market insights. See full methodology.

Market Scope
Page number 297
Base year 2025
Historic period 2020-2024
Forecast period 2026-2030
Growth momentum & CAGR Accelerate at a CAGR of 6.3%
Market growth 2026-2030 USD 89.8 million
Market structure Fragmented
YoY growth 2025-2026(%) 5.9%
Key countries China, India, Japan, South Korea, Australia, Indonesia, US, Canada, Mexico, Germany, UK, France, Italy, Spain, The Netherlands, Brazil, Argentina, Colombia, South Africa, Saudi Arabia, UAE, Turkey and Israel
Competitive landscape Leading Companies, Market Positioning of Companies, Competitive Strategies, and Industry Risks

Request Free Sample

Research Analyst Overview

  • The friction stir welding equipment market is defined by its strategic role in advancing lightweight manufacturing across critical sectors. The adoption of solid-state joining technology is no longer a niche consideration but a central element of production strategy, particularly for battery enclosure manufacturing and fabricating cryogenic fuel tanks from high-strength aluminum alloys and aluminum-lithium alloys.
  • A key trend influencing boardroom decisions is the integration of digital intelligence into machinery, where a smart fsw machining center with force-control software represents a significant capital investment tied to long-term risk mitigation and quality assurance. For example, deploying automated joining solutions with high-payload industrial robotics can deliver a 30% reduction in cycle times, directly impacting profitability.
  • This evolution is compelling a shift toward custom-engineered solutions like vertical gantry fsw systems and mobile fsw equipment, which offer the structural integrity and leak-proof performance required for next-generation products. The increasing use of robotic friction stir welding and fsw end-effectors in flexible cells highlights the move toward adaptable, high-efficiency production lines.

What are the Key Data Covered in this Friction Stir Welding Equipment Market Research and Growth Report?

  • What is the expected growth of the Friction Stir Welding Equipment Market between 2026 and 2030?

    • USD 89.8 million, at a CAGR of 6.3%

  • What segmentation does the market report cover?

    • The report is segmented by Product Type (Fixed FSW equipment, Mobile FSW equipment, and Robotic FSW equipment), End-user (Automotive industry, Aerospace industry, Railway industry, Shipbuilding industry, and Others), Type (Gantry machines, and Linear seam machines) and Geography (APAC, North America, Europe, South America, Middle East and Africa)

  • Which regions are analyzed in the report?

    • APAC, North America, Europe, South America and Middle East and Africa

  • What are the key growth drivers and market challenges?

    • Surging demand for lightweight materials in aerospace and space exploration, High initial capital investment and specialized tooling costs

  • Who are the major players in the Friction Stir Welding Equipment Market?

    • Advanced Integration Tech. LP, AEE Co. Ltd, Beijing FSW Technology Co. Ltd., Bond Technologies, LLC., Chongqing CME, ETA Technology Pvt. Ltd., FOOKE GmbH, Friction Welding Tech Pvt. Ltd., Grenzebach Maschinenbau GmbH, Hwacheon Machine Tool Co Ltd, KUKA AG, Manufacturing Technology Inc., PaR Systems LLC, PTG Holroyd, Sakae Industries Co. Ltd., Stirweld, The Lincoln Electric Co., TRA-C industrie, TWI Ltd. and Yamazaki Mazak Corp.

Market Research Insights

  • The market's dynamics are shaped by a trade-off between advanced capabilities and adoption hurdles. The integration of digital twin models enables predictive maintenance capabilities, which can enhance equipment uptime by over 20%. Concurrently, innovations in force feedback control and process parameter optimization are improving joint integrity and reducing material waste.
  • However, the high initial capital expenditure strategy required remains a significant barrier, with nearly 40% of smaller fabricators citing cost as a primary obstacle to adoption.
  • This dynamic forces a continuous joining technology evaluation, where the long-term benefits of superior weld quality monitoring and reduced operational costs are weighed against the immediate financial outlay, influencing production line integration decisions across industries.

We can help! Our analysts can customize this friction stir welding equipment market research report to meet your requirements.

Get in touch

1. Executive Summary

1.1 Market overview

Executive Summary - Chart on Market Overview
Executive Summary - Data Table on Market Overview
Executive Summary - Chart on Global Market Characteristics
Executive Summary - Chart on Market by Geography
Executive Summary - Chart on Market Segmentation by Product Type
Executive Summary - Chart on Market Segmentation by End-user
Executive Summary - Chart on Market Segmentation by Type
Executive Summary - Chart on Incremental Growth
Executive Summary - Data Table on Incremental Growth
Executive Summary - Chart on Company Market Positioning

2. Technavio Analysis

2.1 Analysis of price sensitivity, lifecycle, customer purchase basket, adoption rates, and purchase criteria

2.2 Criticality of inputs and Factors of differentiation

Chart on Overview on criticality of inputs and factors of differentiation

2.3 Factors of disruption

Chart on Overview on factors of disruption

2.4 Impact of drivers and challenges

Chart on Impact of drivers and challenges in 2025 and 2030

3. Market Landscape

3.1 Market ecosystem

Chart on Parent Market
Data Table on - Parent Market

3.2 Market characteristics

Chart on Market characteristics analysis

3.3 Value chain analysis

Chart on Value chain analysis

4. Market Sizing

4.1 Market definition

Data Table on Offerings of companies included in the market definition

4.2 Market segment analysis

Market segments

4.3 Market size 2025

4.4 Market outlook: Forecast for 2025-2030

Chart on Global - Market size and forecast 2025-2030 ($ million)
Data Table on Global - Market size and forecast 2025-2030 ($ million)
Chart on Global Market: Year-over-year growth 2025-2030 (%)
Data Table on Global Market: Year-over-year growth 2025-2030 (%)

5. Historic Market Size

5.1 Global Friction Stir Welding Equipment Market 2020 - 2024

Historic Market Size - Data Table on Global Friction Stir Welding Equipment Market 2020 - 2024 ($ million)

5.2 Product Type segment analysis 2020 - 2024

Historic Market Size - Product Type Segment 2020 - 2024 ($ million)

5.3 End-user segment analysis 2020 - 2024

Historic Market Size - End-user Segment 2020 - 2024 ($ million)

5.4 Type segment analysis 2020 - 2024

Historic Market Size - Type Segment 2020 - 2024 ($ million)

5.5 Geography segment analysis 2020 - 2024

Historic Market Size - Geography Segment 2020 - 2024 ($ million)

5.6 Country segment analysis 2020 - 2024

Historic Market Size - Country Segment 2020 - 2024 ($ million)

6. Qualitative Analysis

6.1 Impact of AI on the Global Friction Stir Welding Equipment Market

7. Five Forces Analysis

7.1 Five forces summary

Five forces analysis - Comparison between 2025 and 2030

7.2 Bargaining power of buyers

Bargaining power of buyers - Impact of key factors 2025 and 2030

7.3 Bargaining power of suppliers

Bargaining power of suppliers - Impact of key factors in 2025 and 2030

7.4 Threat of new entrants

Threat of new entrants - Impact of key factors in 2025 and 2030

7.5 Threat of substitutes

Threat of substitutes - Impact of key factors in 2025 and 2030

7.6 Threat of rivalry

Threat of rivalry - Impact of key factors in 2025 and 2030

7.7 Market condition

Chart on Market condition - Five forces 2025 and 2030

8. Market Segmentation by Product Type

8.1 Market segments

Chart on Product Type - Market share 2025-2030 (%)
Data Table on Product Type - Market share 2025-2030 (%)

8.2 Comparison by Product Type

Chart on Comparison by Product Type
Data Table on Comparison by Product Type

8.3 Fixed FSW equipment - Market size and forecast 2025-2030

Chart on Fixed FSW equipment - Market size and forecast 2025-2030 ($ million)
Data Table on Fixed FSW equipment - Market size and forecast 2025-2030 ($ million)
Chart on Fixed FSW equipment - Year-over-year growth 2025-2030 (%)
Data Table on Fixed FSW equipment - Year-over-year growth 2025-2030 (%)

8.4 Mobile FSW equipment - Market size and forecast 2025-2030

Chart on Mobile FSW equipment - Market size and forecast 2025-2030 ($ million)
Data Table on Mobile FSW equipment - Market size and forecast 2025-2030 ($ million)
Chart on Mobile FSW equipment - Year-over-year growth 2025-2030 (%)
Data Table on Mobile FSW equipment - Year-over-year growth 2025-2030 (%)

8.5 Robotic FSW equipment - Market size and forecast 2025-2030

Chart on Robotic FSW equipment - Market size and forecast 2025-2030 ($ million)
Data Table on Robotic FSW equipment - Market size and forecast 2025-2030 ($ million)
Chart on Robotic FSW equipment - Year-over-year growth 2025-2030 (%)
Data Table on Robotic FSW equipment - Year-over-year growth 2025-2030 (%)

8.6 Market opportunity by Product Type

Market opportunity by Product Type ($ million)
Data Table on Market opportunity by Product Type ($ million)

9. Market Segmentation by End-user

9.1 Market segments

Chart on End-user - Market share 2025-2030 (%)
Data Table on End-user - Market share 2025-2030 (%)

9.2 Comparison by End-user

Chart on Comparison by End-user
Data Table on Comparison by End-user

9.3 Automotive industry - Market size and forecast 2025-2030

Chart on Automotive industry - Market size and forecast 2025-2030 ($ million)
Data Table on Automotive industry - Market size and forecast 2025-2030 ($ million)
Chart on Automotive industry - Year-over-year growth 2025-2030 (%)
Data Table on Automotive industry - Year-over-year growth 2025-2030 (%)

9.4 Aerospace industry - Market size and forecast 2025-2030

Chart on Aerospace industry - Market size and forecast 2025-2030 ($ million)
Data Table on Aerospace industry - Market size and forecast 2025-2030 ($ million)
Chart on Aerospace industry - Year-over-year growth 2025-2030 (%)
Data Table on Aerospace industry - Year-over-year growth 2025-2030 (%)

9.5 Railway industry - Market size and forecast 2025-2030

Chart on Railway industry - Market size and forecast 2025-2030 ($ million)
Data Table on Railway industry - Market size and forecast 2025-2030 ($ million)
Chart on Railway industry - Year-over-year growth 2025-2030 (%)
Data Table on Railway industry - Year-over-year growth 2025-2030 (%)

9.6 Shipbuilding industry - Market size and forecast 2025-2030

Chart on Shipbuilding industry - Market size and forecast 2025-2030 ($ million)
Data Table on Shipbuilding industry - Market size and forecast 2025-2030 ($ million)
Chart on Shipbuilding industry - Year-over-year growth 2025-2030 (%)
Data Table on Shipbuilding industry - Year-over-year growth 2025-2030 (%)

9.7 Others - Market size and forecast 2025-2030

Chart on Others - Market size and forecast 2025-2030 ($ million)
Data Table on Others - Market size and forecast 2025-2030 ($ million)
Chart on Others - Year-over-year growth 2025-2030 (%)
Data Table on Others - Year-over-year growth 2025-2030 (%)

9.8 Market opportunity by End-user

Market opportunity by End-user ($ million)
Data Table on Market opportunity by End-user ($ million)

10. Market Segmentation by Type

10.1 Market segments

Chart on Type - Market share 2025-2030 (%)
Data Table on Type - Market share 2025-2030 (%)

10.2 Comparison by Type

Chart on Comparison by Type
Data Table on Comparison by Type

10.3 Gantry machines - Market size and forecast 2025-2030

Chart on Gantry machines - Market size and forecast 2025-2030 ($ million)
Data Table on Gantry machines - Market size and forecast 2025-2030 ($ million)
Chart on Gantry machines - Year-over-year growth 2025-2030 (%)
Data Table on Gantry machines - Year-over-year growth 2025-2030 (%)

10.4 Linear seam machine - Market size and forecast 2025-2030

Chart on Linear seam machine - Market size and forecast 2025-2030 ($ million)
Data Table on Linear seam machine - Market size and forecast 2025-2030 ($ million)
Chart on Linear seam machine - Year-over-year growth 2025-2030 (%)
Data Table on Linear seam machine - Year-over-year growth 2025-2030 (%)

10.5 Market opportunity by Type

Market opportunity by Type ($ million)
Data Table on Market opportunity by Type ($ million)

11. Customer Landscape

11.1 Customer landscape overview

Analysis of price sensitivity, lifecycle, customer purchase basket, adoption rates, and purchase criteria

12. Geographic Landscape

12.1 Geographic segmentation

Chart on Market share by geography 2025-2030 (%)
Data Table on Market share by geography 2025-2030 (%)

12.2 Geographic comparison

Chart on Geographic comparison
Data Table on Geographic comparison

12.3 APAC - Market size and forecast 2025-2030

Chart on APAC - Market size and forecast 2025-2030 ($ million)
Data Table on APAC - Market size and forecast 2025-2030 ($ million)
Chart on APAC - Year-over-year growth 2025-2030 (%)
Data Table on APAC - Year-over-year growth 2025-2030 (%)
Chart on Regional Comparison - APAC
Data Table on Regional Comparison - APAC

12.3.1 China - Market size and forecast 2025-2030

Chart on China - Market size and forecast 2025-2030 ($ million)
Data Table on China - Market size and forecast 2025-2030 ($ million)
Chart on China - Year-over-year growth 2025-2030 (%)
Data Table on China - Year-over-year growth 2025-2030 (%)

12.3.2 India - Market size and forecast 2025-2030

Chart on India - Market size and forecast 2025-2030 ($ million)
Data Table on India - Market size and forecast 2025-2030 ($ million)
Chart on India - Year-over-year growth 2025-2030 (%)
Data Table on India - Year-over-year growth 2025-2030 (%)

12.3.3 Japan - Market size and forecast 2025-2030

Chart on Japan - Market size and forecast 2025-2030 ($ million)
Data Table on Japan - Market size and forecast 2025-2030 ($ million)
Chart on Japan - Year-over-year growth 2025-2030 (%)
Data Table on Japan - Year-over-year growth 2025-2030 (%)

12.3.4 South Korea - Market size and forecast 2025-2030

Chart on South Korea - Market size and forecast 2025-2030 ($ million)
Data Table on South Korea - Market size and forecast 2025-2030 ($ million)
Chart on South Korea - Year-over-year growth 2025-2030 (%)
Data Table on South Korea - Year-over-year growth 2025-2030 (%)

12.3.5 Australia - Market size and forecast 2025-2030

Chart on Australia - Market size and forecast 2025-2030 ($ million)
Data Table on Australia - Market size and forecast 2025-2030 ($ million)
Chart on Australia - Year-over-year growth 2025-2030 (%)
Data Table on Australia - Year-over-year growth 2025-2030 (%)

12.3.6 Indonesia - Market size and forecast 2025-2030

Chart on Indonesia - Market size and forecast 2025-2030 ($ million)
Data Table on Indonesia - Market size and forecast 2025-2030 ($ million)
Chart on Indonesia - Year-over-year growth 2025-2030 (%)
Data Table on Indonesia - Year-over-year growth 2025-2030 (%)

12.4 North America - Market size and forecast 2025-2030

Chart on North America - Market size and forecast 2025-2030 ($ million)
Data Table on North America - Market size and forecast 2025-2030 ($ million)
Chart on North America - Year-over-year growth 2025-2030 (%)
Data Table on North America - Year-over-year growth 2025-2030 (%)
Chart on Regional Comparison - North America
Data Table on Regional Comparison - North America

12.4.1 US - Market size and forecast 2025-2030

Chart on US - Market size and forecast 2025-2030 ($ million)
Data Table on US - Market size and forecast 2025-2030 ($ million)
Chart on US - Year-over-year growth 2025-2030 (%)
Data Table on US - Year-over-year growth 2025-2030 (%)

12.4.2 Canada - Market size and forecast 2025-2030

Chart on Canada - Market size and forecast 2025-2030 ($ million)
Data Table on Canada - Market size and forecast 2025-2030 ($ million)
Chart on Canada - Year-over-year growth 2025-2030 (%)
Data Table on Canada - Year-over-year growth 2025-2030 (%)

12.4.3 Mexico - Market size and forecast 2025-2030

Chart on Mexico - Market size and forecast 2025-2030 ($ million)
Data Table on Mexico - Market size and forecast 2025-2030 ($ million)
Chart on Mexico - Year-over-year growth 2025-2030 (%)
Data Table on Mexico - Year-over-year growth 2025-2030 (%)

12.5 Europe - Market size and forecast 2025-2030

Chart on Europe - Market size and forecast 2025-2030 ($ million)
Data Table on Europe - Market size and forecast 2025-2030 ($ million)
Chart on Europe - Year-over-year growth 2025-2030 (%)
Data Table on Europe - Year-over-year growth 2025-2030 (%)
Chart on Regional Comparison - Europe
Data Table on Regional Comparison - Europe

12.5.1 Germany - Market size and forecast 2025-2030

Chart on Germany - Market size and forecast 2025-2030 ($ million)
Data Table on Germany - Market size and forecast 2025-2030 ($ million)
Chart on Germany - Year-over-year growth 2025-2030 (%)
Data Table on Germany - Year-over-year growth 2025-2030 (%)

12.5.2 UK - Market size and forecast 2025-2030

Chart on UK - Market size and forecast 2025-2030 ($ million)
Data Table on UK - Market size and forecast 2025-2030 ($ million)
Chart on UK - Year-over-year growth 2025-2030 (%)
Data Table on UK - Year-over-year growth 2025-2030 (%)

12.5.3 France - Market size and forecast 2025-2030

Chart on France - Market size and forecast 2025-2030 ($ million)
Data Table on France - Market size and forecast 2025-2030 ($ million)
Chart on France - Year-over-year growth 2025-2030 (%)
Data Table on France - Year-over-year growth 2025-2030 (%)

12.5.4 Italy - Market size and forecast 2025-2030

Chart on Italy - Market size and forecast 2025-2030 ($ million)
Data Table on Italy - Market size and forecast 2025-2030 ($ million)
Chart on Italy - Year-over-year growth 2025-2030 (%)
Data Table on Italy - Year-over-year growth 2025-2030 (%)

12.5.5 Spain - Market size and forecast 2025-2030

Chart on Spain - Market size and forecast 2025-2030 ($ million)
Data Table on Spain - Market size and forecast 2025-2030 ($ million)
Chart on Spain - Year-over-year growth 2025-2030 (%)
Data Table on Spain - Year-over-year growth 2025-2030 (%)

12.5.6 The Netherlands - Market size and forecast 2025-2030

Chart on The Netherlands - Market size and forecast 2025-2030 ($ million)
Data Table on The Netherlands - Market size and forecast 2025-2030 ($ million)
Chart on The Netherlands - Year-over-year growth 2025-2030 (%)
Data Table on The Netherlands - Year-over-year growth 2025-2030 (%)

12.6 South America - Market size and forecast 2025-2030

Chart on South America - Market size and forecast 2025-2030 ($ million)
Data Table on South America - Market size and forecast 2025-2030 ($ million)
Chart on South America - Year-over-year growth 2025-2030 (%)
Data Table on South America - Year-over-year growth 2025-2030 (%)
Chart on Regional Comparison - South America
Data Table on Regional Comparison - South America

12.6.1 Brazil - Market size and forecast 2025-2030

Chart on Brazil - Market size and forecast 2025-2030 ($ million)
Data Table on Brazil - Market size and forecast 2025-2030 ($ million)
Chart on Brazil - Year-over-year growth 2025-2030 (%)
Data Table on Brazil - Year-over-year growth 2025-2030 (%)

12.6.2 Argentina - Market size and forecast 2025-2030

Chart on Argentina - Market size and forecast 2025-2030 ($ million)
Data Table on Argentina - Market size and forecast 2025-2030 ($ million)
Chart on Argentina - Year-over-year growth 2025-2030 (%)
Data Table on Argentina - Year-over-year growth 2025-2030 (%)

12.6.3 Colombia - Market size and forecast 2025-2030

Chart on Colombia - Market size and forecast 2025-2030 ($ million)
Data Table on Colombia - Market size and forecast 2025-2030 ($ million)
Chart on Colombia - Year-over-year growth 2025-2030 (%)
Data Table on Colombia - Year-over-year growth 2025-2030 (%)

12.7 Middle East and Africa - Market size and forecast 2025-2030

Chart on Middle East and Africa - Market size and forecast 2025-2030 ($ million)
Data Table on Middle East and Africa - Market size and forecast 2025-2030 ($ million)
Chart on Middle East and Africa - Year-over-year growth 2025-2030 (%)
Data Table on Middle East and Africa - Year-over-year growth 2025-2030 (%)
Chart on Regional Comparison - Middle East and Africa
Data Table on Regional Comparison - Middle East and Africa

12.7.1 South Africa - Market size and forecast 2025-2030

Chart on South Africa - Market size and forecast 2025-2030 ($ million)
Data Table on South Africa - Market size and forecast 2025-2030 ($ million)
Chart on South Africa - Year-over-year growth 2025-2030 (%)
Data Table on South Africa - Year-over-year growth 2025-2030 (%)

12.7.2 Saudi Arabia - Market size and forecast 2025-2030

Chart on Saudi Arabia - Market size and forecast 2025-2030 ($ million)
Data Table on Saudi Arabia - Market size and forecast 2025-2030 ($ million)
Chart on Saudi Arabia - Year-over-year growth 2025-2030 (%)
Data Table on Saudi Arabia - Year-over-year growth 2025-2030 (%)

12.7.3 UAE - Market size and forecast 2025-2030

Chart on UAE - Market size and forecast 2025-2030 ($ million)
Data Table on UAE - Market size and forecast 2025-2030 ($ million)
Chart on UAE - Year-over-year growth 2025-2030 (%)
Data Table on UAE - Year-over-year growth 2025-2030 (%)

12.7.4 Turkey - Market size and forecast 2025-2030

Chart on Turkey - Market size and forecast 2025-2030 ($ million)
Data Table on Turkey - Market size and forecast 2025-2030 ($ million)
Chart on Turkey - Year-over-year growth 2025-2030 (%)
Data Table on Turkey - Year-over-year growth 2025-2030 (%)

12.7.5 Israel - Market size and forecast 2025-2030

Chart on Israel - Market size and forecast 2025-2030 ($ million)
Data Table on Israel - Market size and forecast 2025-2030 ($ million)
Chart on Israel - Year-over-year growth 2025-2030 (%)
Data Table on Israel - Year-over-year growth 2025-2030 (%)

12.8 Market opportunity by geography

Market opportunity by geography ($ million)
Data Tables on Market opportunity by geography ($ million)

13. Drivers, Challenges, and Opportunity

13.1 Market drivers

Surging demand for lightweight materials in aerospace and space exploration
Surge in demand for battery tray fabrication
Advancements in marine and high-speed railway infrastructure

13.2 Market challenges

High initial capital investment and specialized tooling costs
Technical limitations regarding complex geometries and welding speed
Shortage of skilled operators and technical expertise

13.3 Impact of drivers and challenges

Impact of drivers and challenges in 2025 and 2030

13.4 Market opportunities

Accelerated adoption in electric vehicle battery enclosure manufacturing
Integration of industry 4.0 and digital twin technology
Expansion of robotic friction stir welding (R-FSW) for complex geometries

14. Competitive Landscape

14.1 Overview

14.2

Overview on criticality of inputs and factors of differentiation

14.3 Landscape disruption

Overview on factors of disruption

14.4 Industry risks

Impact of key risks on business

15. Competitive Analysis

15.1 Companies profiled

Companies covered

15.2 Company ranking index

15.3 Market positioning of companies

Matrix on companies position and classification

15.4 Advanced Integration Tech. LP

Advanced Integration Tech. LP - Overview
Advanced Integration Tech. LP - Product / Service
Advanced Integration Tech. LP - Key offerings
SWOT

15.5 AEE Co. Ltd

AEE Co. Ltd - Overview
AEE Co. Ltd - Product / Service
AEE Co. Ltd - Key offerings
SWOT

15.6 Bond Technologies, LLC.

Bond Technologies, LLC. - Overview
Bond Technologies, LLC. - Product / Service
Bond Technologies, LLC. - Key offerings
SWOT

15.7 ETA Technology Pvt. Ltd.

ETA Technology Pvt. Ltd. - Overview
ETA Technology Pvt. Ltd. - Product / Service
ETA Technology Pvt. Ltd. - Key offerings
SWOT

15.8 FOOKE GmbH

FOOKE GmbH - Overview
FOOKE GmbH - Product / Service
FOOKE GmbH - Key offerings
SWOT

15.9 Friction Welding Tech Pvt. Ltd.

Friction Welding Tech Pvt. Ltd. - Overview
Friction Welding Tech Pvt. Ltd. - Product / Service
Friction Welding Tech Pvt. Ltd. - Key offerings
SWOT

15.10 Hwacheon Machine Tool Co Ltd

Hwacheon Machine Tool Co Ltd - Overview
Hwacheon Machine Tool Co Ltd - Product / Service
Hwacheon Machine Tool Co Ltd - Key news
Hwacheon Machine Tool Co Ltd - Key offerings
SWOT

15.11 KUKA AG

KUKA AG - Overview
KUKA AG - Business segments
KUKA AG - Key offerings
KUKA AG - Segment focus
SWOT

15.12 Manufacturing Technology Inc.

Manufacturing Technology Inc. - Overview
Manufacturing Technology Inc. - Product / Service
Manufacturing Technology Inc. - Key offerings
SWOT

15.13 PaR Systems LLC

PaR Systems LLC - Overview
PaR Systems LLC - Product / Service
PaR Systems LLC - Key offerings
SWOT

15.14 PTG Holroyd

PTG Holroyd - Overview
PTG Holroyd - Product / Service
PTG Holroyd - Key offerings
SWOT

15.15 Sakae Industries Co. Ltd.

Sakae Industries Co. Ltd. - Overview
Sakae Industries Co. Ltd. - Product / Service
Sakae Industries Co. Ltd. - Key offerings
SWOT

15.16 Stirweld

Stirweld - Overview
Stirweld - Product / Service
Stirweld - Key offerings
SWOT

15.17 TRA-C industrie

TRA-C industrie - Overview
TRA-C industrie - Product / Service
TRA-C industrie - Key offerings
SWOT

15.18 Yamazaki Mazak Corp.

Yamazaki Mazak Corp. - Overview
Yamazaki Mazak Corp. - Product / Service
Yamazaki Mazak Corp. - Key offerings
SWOT

16. Appendix

16.1 Scope of the report

Market definition
Objectives
Notes and caveats

16.2 Inclusions and exclusions checklist

Inclusions checklist
Exclusions checklist

16.3 Currency conversion rates for US$

16.4 Research methodology

16.5 Data procurement

Information sources

16.6 Data validation

16.7 Validation techniques employed for market sizing

16.8 Data synthesis

16.9 360 degree market analysis

16.10 List of abbreviations

Research Methodology

Technavio presents a detailed picture of the market by way of study, synthesis, and summation of data from multiple sources. The analysts have presented the various facets of the market with a particular focus on identifying the key industry influencers. The data thus presented is comprehensive, reliable, and the result of extensive research, both primary and secondary.

INFORMATION SOURCES

Primary sources

  • Manufacturers and suppliers
  • Channel partners
  • Industry experts
  • Strategic decision makers

Secondary sources

  • Industry journals and periodicals
  • Government data
  • Financial reports of key industry players
  • Historical data
  • Press releases

DATA ANALYSIS

Data Synthesis

  • Collation of data
  • Estimation of key figures
  • Analysis of derived insights

Data Validation

  • Triangulation with data models
  • Reference against proprietary databases
  • Corroboration with industry experts

REPORT WRITING

Qualitative

  • Market drivers
  • Market challenges
  • Market trends
  • Five forces analysis

Quantitative

  • Market size and forecast
  • Market segmentation
  • Geographical insights
  • Competitive landscape

Interested in this report?

Get your sample now to see our research methodology and insights!

Download Now

Frequently Asked Questions

Friction Stir Welding Equipment market growth will increase by USD 89.8 million during 2026-2030 .

The Friction Stir Welding Equipment market is expected to grow at a CAGR of 6.3% during 2026-2030 .

Friction Stir Welding Equipment market is segmented by Product type (Fixed FSW equipment, Mobile FSW equipment, Robotic FSW equipment) End-user (Automotive industry, Aerospace industry, Railway industry, Shipbuilding industry, Others) Type (Gantry machines, Linear seam machine)

Advanced Integration Tech. LP, AEE Co. Ltd, Beijing FSW Technology Co. Ltd., Bond Technologies, LLC., Chongqing CME, ETA Technology Pvt. Ltd., FOOKE GmbH, Friction Welding Tech Pvt. Ltd., Grenzebach Maschinenbau GmbH, Hwacheon Machine Tool Co Ltd, KUKA AG, Manufacturing Technology Inc., PaR Systems LLC, PTG Holroyd, Sakae Industries Co. Ltd., Stirweld, The Lincoln Electric Co., TRA-C industrie, TWI Ltd., Yamazaki Mazak Corp. are a few of the key vendors in the Friction Stir Welding Equipment market.

APAC will register the highest growth rate of 40.6% among the other regions. Therefore, the Friction Stir Welding Equipment market in APAC is expected to garner significant business opportunities for the vendors during the forecast period.

China, India, Japan, South Korea, Australia, Indonesia, US, Canada, Mexico, Germany, UK, France, Italy, Spain, The Netherlands, Brazil, Argentina, Colombia, South Africa, Saudi Arabia, UAE, Turkey, Israel

  • Surging demand for lightweight materials in aerospace and space exploration is the driving factor this market.

The Friction Stir Welding Equipment market vendors should focus on grabbing business opportunities from the Product type segment as it accounted for the largest market share in the base year.