Functional Flours Market Size 2024-2028
The functional flours market size is forecast to increase by USD 36.14 billion, at a CAGR of 8.5% between 2023 and 2028.
- The market is witnessing significant growth due to the increasing demand for ready-to-eat food products from manufacturers. This trend is driven by consumers' preference for convenience and healthier food options. Consumers are increasingly seeking fiber-rich and nutrient-dense alternatives to traditional wheat, leading to a rise in demand for functional flours fortified with vitamins, herbs, nutraceuticals, and other health-promoting ingredients. Furthermore, innovations in functional flour blends are providing new opportunities for market expansion. However, the market faces challenges due to fluctuations in the availability of raw materials for functional flours. Weather conditions and natural calamities can significantly impact the production of key raw materials, leading to supply chain disruptions and price volatility.
- To capitalize on market opportunities and navigate these challenges effectively, companies must focus on supply chain resilience and diversification of raw material sources. Additionally, investing in research and development to create innovative functional flour blends can help differentiate offerings and cater to evolving consumer preferences.
What will be the Size of the Functional Flours Market during the forecast period?

Explore in-depth regional segment analysis with market size data - historical 2018-2022 and forecasts 2024-2028 - in the full report.
Request Free Sample
Functional flours continue to revolutionize the baking industry, with their unique properties and applications driving market dynamics. These innovative flours offer enhanced water absorption capacity, improved fiber enrichment methods, and superior bread making properties. Consumer acceptance testing and quality control metrics play a crucial role in ensuring the optimal sensory experience. Flour milling technology advances, enabling the production of specialized pastry flours with distinct characteristics. Ingredient cost analysis and product development lifecycle are essential considerations in the evolving market landscape. Starch modification techniques offer opportunities for enhanced ingredient functionality and nutritional labeling regulations. Functional flour applications span various sectors, from baked goods to beverages and supplements.
Ingredient sourcing strategies, food safety standards, and ingredient traceability systems are paramount in maintaining consumer trust and regulatory compliance. Colorimetric analysis techniques and dough rheology testing provide valuable insights into flour quality and baking performance indices. Flour storage conditions and process optimization strategies further contribute to the cost-effectiveness and efficiency of functional flour production. Continuous innovation in functional flours is fueled by ongoing research and development, with a focus on improving texture analysis methods, microscopic analysis techniques, protein content analysis, and gluten-free flours. The market's dynamic nature underscores the importance of staying informed and adaptive to meet the ever-evolving needs of consumers and industries.
How is this Functional Flours Industry segmented?
The functional flours industry research report provides comprehensive data (region-wise segment analysis), with forecasts and estimates in "USD billion" for the period 2024-2028, as well as historical data from 2018-2022 for the following segments.
- Application
- RTE products
- Bakery products
- Soups and sauces
- Others
- Type
- Fortified
- Specialty
- Pre-cooked
- Source
- Cereals (Wheat, Rice, Corn, Oats, Barley)
- Legumes (Chickpea, Lentil, Pea, Bean)
- Oilseeds (Soy, Flaxseed)
- Nuts (Almond, Coconut)
- Pseudocereals (Quinoa, Buckwheat, Amaranth)
- Nature
- Function
- Thickening
- Binding
- Emulsifying
- Texturizing
- Nutritional Enrichment
- Shelf Life Extension
- Geography
- North America
- Europe
- Middle East and Africa
- APAC
- South America
- Rest of World (ROW)
By Application Insights
The RTE products segment is estimated to witness significant growth during the forecast period.
Functional flours have gained significant attention in the food industry due to consumers' increasing preference for healthier options. Manufacturers are leveraging functional flours to produce various snack foods, such as extruded snacks, with improved nutritional content. For instance, HOMECRAFT Pulse Flours from Ingredion is a functional flour suitable for ready-to-eat (RTE) products like snacks and pasta. The demand for functional flour in snack applications is surging due to consumers' quest for breakfast products with enhanced protein, fiber, and energy sources. Nutritional labeling is a crucial factor for consumers, who carefully read and consider the claims on product labels. Manufacturers employ various fiber enrichment methods to produce functional flours, ensuring they meet the nutritional demands of consumers.
Quality control metrics, such as protein content analysis and dough rheology testing, are essential to maintain consistency in the production process. Flour milling technology plays a pivotal role in producing functional flours with desirable bread making properties and water absorption capacity. Texture analysis methods, microscopic analysis techniques, and sensory evaluation methods are used to assess the functionality and overall quality of functional flours. In the baking industry, functional flour applications include pastry flour, which offers improved texture and baking performance indices. Cost-effectiveness analysis and supply chain management are essential considerations for manufacturers to ensure the competitiveness of their functional flour products.
Food safety standards and ingredient traceability systems are essential for maintaining consumer trust and regulatory compliance. Starch modification techniques, such as enzymatic modification and physical modification, are used to enhance the functionality of functional flours. Gluten-free baking formulations and functional flour blends cater to the growing demand for gluten-free food options. Product development lifecycle, from ingredient sourcing strategies to process optimization strategies, is a critical aspect of manufacturing functional flours. Flour storage conditions and flour oxidation control are essential to maintain the quality and functionality of functional flours throughout the production process.

Request Free Sample
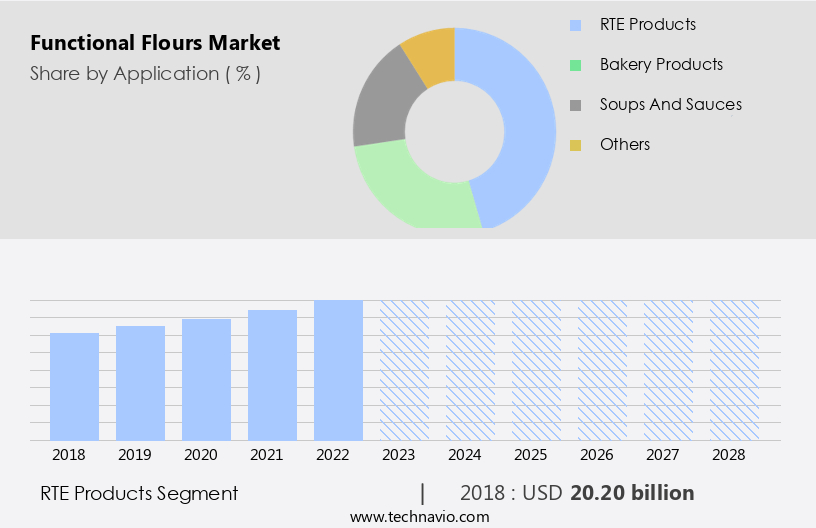
The RTE products segment was valued at USD 20.20 billion in 2018 and showed a gradual increase during the forecast period.
Regional Analysis
APAC is estimated to contribute 33% to the growth of the global market during the forecast period.Technavio's analysts have elaborately explained the regional trends and drivers that shape the market during the forecast period.

Request Free Sample
The market in Asia Pacific (APAC) exhibits rapid growth, surpassing other regions. Japan and Australia lead the consumption of functional flours due to a thriving food processing industry, expanding population, and rising demand for ready-to-eat (RTE) food products. The bread and rolls market's expansion, driven by urbanization and the preference for convenience and gluten-free options, significantly contributes to the market's growth. The APAC bread market's growth rate surpasses that of Europe. Water absorption capacity, fiber enrichment methods, and consumer acceptance testing are crucial factors in functional flour production. Quality control metrics, packaging material selection, and flour milling technology are essential for maintaining product consistency.
Starch modification techniques and nutritional labeling regulations impact ingredient cost analysis and product development lifecycle. Supply chain management, texture analysis methods, microscopic analysis techniques, and sensory evaluation methods ensure product quality and consumer satisfaction. Gluten-free baking formulations, functional flour blends, and ingredient sourcing strategies cater to diverse consumer needs. Food safety standards, ingredient traceability systems, colorimetric analysis techniques, dough rheology testing, and functional flour applications expand the market's scope. Protein content analysis, process optimization strategies, baking performance indices, and flour storage conditions are essential for optimizing product functionality. Flour oxidation control is a critical aspect of maintaining product quality and shelf life.
Market Dynamics
The Functional Flours Market is booming as consumers demand healthier, sustainable options like gluten-free flours and organic functional flours. Functional flours in bakery and functional flours in snacks cater to functional flours for health-conscious consumers, while functional flours clean label and Non-GMO functional flours appeal to those seeking transparency. Functional flours high-protein and functional flours low-carb support functional flours for vegan diets and functional flours for gluten-free diets, driving growth in the functional flours gluten-free market and functional flours organic market. Innovations in functional flour processing and functional flours sustainable production enhance quality, with best functional flours for gluten-free baking and functional flours for plant-based nutrition meeting diverse dietary needs, ensuring market expansion.
Our researchers analyzed the data with 2023 as the base year, along with the key drivers, trends, and challenges. A holistic analysis of drivers will help companies refine their marketing strategies to gain a competitive advantage.
What are the key market drivers leading to the rise in the adoption of Functional Flours Industry?
- The significant surge in consumer preference for convenient and ready-to-eat food items is the primary factor fueling the market growth for product manufacturers in this sector.
- Functional flours have gained significant attention in the food industry due to their enhanced baking properties and fiber enrichment methods. These flours offer advantages such as reduced gluten formation and increased moisture, making them a popular choice among ready-to-eat food manufacturers. The demand for functional flours is driven by the growing preference for convenience and the increasing awareness of health concerns, particularly gluten intolerance, in Europe. Rice and legume-derived functional flours are widely used in RTE food production. Consumer acceptance is crucial in this market, and quality control metrics, such as water absorption capacity and pastry flour characteristics, are essential considerations for manufacturers.
- Flour milling technology plays a significant role in producing high-quality functional flours. Proper packaging material selection is also vital to ensure the longevity and freshness of the product. Overall, the market is witnessing steady growth due to these factors and the increasing demand for healthier and convenient food options.
What are the market trends shaping the Functional Flours Industry?
- Functional flour blends are currently experiencing innovations as the market trend. This sector is witnessing advancements in creating high-performance flour blends for various industries.
- Functional flours have gained significant attention in the food industry due to their ability to enhance the nutritional value and sensory appeal of food products. Manufacturers are increasingly investing in the development of functional flours by incorporating blends of various grains and seeds. These blends can boost proteins and other essential nutrients, making them an attractive alternative to traditional wheat flour. Gluten-free functional flours are particularly popular, as they cater to the growing demand for healthier and allergen-free food options. Seed flour blends, in particular, are gaining traction in the market. The product development lifecycle for functional flours involves rigorous testing and analysis, including ingredient cost analysis, texture analysis methods, microscopic analysis techniques, and nutritional labeling regulations.
- Cost-effectiveness analysis and supply chain management are crucial considerations in the production of functional flours. Functional flours made from non-wheat grains, lower salt, sugar, and higher fiber content are in high demand due to health consciousness. Innovations in this area are a priority, as these functional flours offer numerous benefits while maintaining cost-effectiveness and meeting consumer preferences. Starch modification techniques are used to improve the functionality of functional flours, making them more versatile in various food applications. As the market for functional flours continues to evolve, manufacturers must stay informed about the latest trends and regulations to remain competitive.
What challenges does the Functional Flours Industry face during its growth?
- The industry's growth is significantly impacted by unpredictable fluctuations in the availability of functional flour raw materials, which can be attributed to various weather conditions and natural calamities.
- The market relies heavily on the availability of raw materials, primarily grains and non-grains. Fluctuations in their production due to adverse weather conditions or climatic changes can hinder market growth. For instance, wheat, a common raw material, requires specific temperature conditions to thrive, and its yield can be significantly impacted by unfavorable weather. In developing countries, agricultural sectors often account for over 23% of total losses due to natural disasters. To ensure product consistency and safety, functional flour manufacturers employ various testing methods such as sensory evaluation, dough rheology, colorimetric analysis, and ingredient traceability systems.
- Compliance with stringent food safety standards is crucial to maintain consumer trust and market reputation. Ingredient sourcing strategies play a significant role in maintaining product quality and price competitiveness. Strategic partnerships with reliable suppliers and implementing robust quality control measures can help mitigate the risks associated with raw material availability.
Exclusive Customer Landscape
The functional flours market forecasting report includes the adoption lifecycle of the market, covering from the innovator's stage to the laggard's stage. It focuses on adoption rates in different regions based on penetration. Furthermore, the functional flours market report also includes key purchase criteria and drivers of price sensitivity to help companies evaluate and develop their market growth analysis strategies.
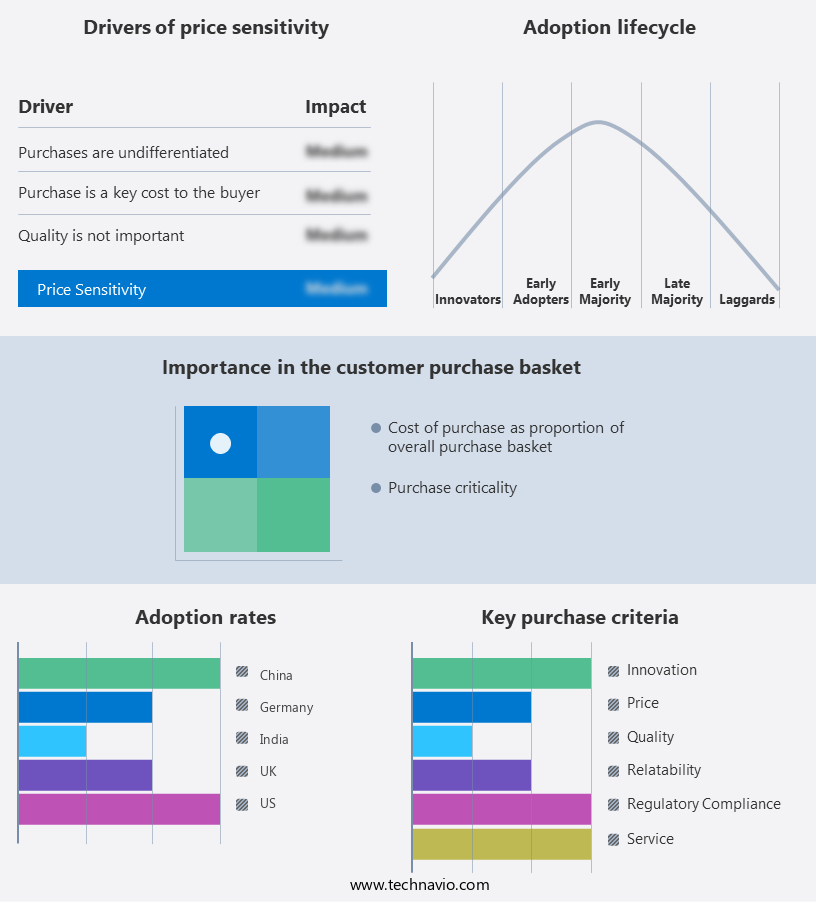
Customer Landscape
Key Companies & Market Insights
Companies are implementing various strategies, such as strategic alliances, functional flours market forecast, partnerships, mergers and acquisitions, geographical expansion, and product/service launches, to enhance their presence in the industry.
AGRANA Beteiligungs AG - This company specializes in functional flours, including Organiv vital wheat gluten, which is utilized in premium organic bakery items and serves as a key ingredient in vegetarian and vegan meat substitutes. The high-quality gluten enhances the texture and elasticity of baked goods and contributes to the creation of savory plant-based alternatives.
The industry research and growth report includes detailed analyses of the competitive landscape of the market and information about key companies, including:
- AGRANA Beteiligungs AG
- Archer Daniels Midland Co.
- Associated British Foods Plc
- Dohler GmbH
- GEMEF Industries
- General Mills Inc.
- Ingredion Inc.
- Kerry Group Plc
- MGP Ingredients Inc.
- Olam Group Ltd.
- Parrish and Heimbecker Ltd.
- Sudzucker AG
- Symrise AG
- Tate and Lyle PLC
- The Hain Celestial Group Inc.
- The Scoular Co.
- Bunge Global SA
- Caremoli SpA
- Cargill Inc.
- Sensient Technologies Corp.
Qualitative and quantitative analysis of companies has been conducted to help clients understand the wider business environment as well as the strengths and weaknesses of key industry players. Data is qualitatively analyzed to categorize companies as pure play, category-focused, industry-focused, and diversified; it is quantitatively analyzed to categorize companies as dominant, leading, strong, tentative, and weak.
Recent Development and News in Functional Flours Market
- In January 2024, Ardent Mills, a leading flour milling and ingredient company, announced the launch of its new line of Ancient Grains Functional Flours, including quinoa, amaranth, and teff flours, at the International Baking Industry Exposition (IBIE). These new offerings aim to cater to the growing demand for clean-label, nutrient-rich ingredients in the food industry (Source: Ardent Mills Press Release).
- In March 2024, Cargill and Bühler Group, two global leaders in food and agriculture, formed a strategic partnership to jointly develop and commercialize innovative plant-based protein and functional flour solutions. This collaboration is expected to leverage Bühler's expertise in technology and Cargill's market reach and resources to deliver sustainable, high-performance ingredients for various industries (Source: Cargill Press Release).
- In May 2024, ADM Milling Company, a subsidiary of Archer Daniels Midland Company, completed the acquisition of the specialty ingredients business of DSM Nutritional Products. This acquisition significantly expanded ADM's portfolio of functional ingredients, including functional flours, and strengthened its position as a leading supplier in the global food and beverage industry (Source: ADM Press Release).
- In April 2025, the European Commission approved the use of pulses, including chickpeas, lentils, and peas, as functional ingredients in food products. This approval is expected to boost the demand for functional flours derived from these pulses, as they offer high nutritional value and functional benefits (Source: European Commission Press Release).
Research Analyst Overview
- Functional flours have gained significant traction in the food industry due to their ability to enhance product quality and consumer appeal. According to recent consumer preference surveys, dough development time and bread texture parameters are key factors influencing purchasing decisions. To meet these demands, manufacturers focus on process efficiency improvements and baking process optimization. Thermal processing effects on functional flours' antioxidant capacity and mineral content assessment are crucial for marketing claims verification. Allergen control measures and ingredient declaration guidelines are essential for regulatory compliance procedures. Sensory attribute profiling and carbohydrate composition analysis help in product differentiation strategies.
- Production capacity planning and sustainable sourcing practices ensure consistent quality and reduce costs. Flour-water interactions, cake volume determination, and vitamin content analysis are essential for optimizing baking processes. Functional food ingredients, such as enzymatic hydrolysis processes, play a vital role in improving product functionality. Packaging design optimization and product shelf-life prediction are crucial for maintaining consumer trust and satisfaction.
Dive into Technavio's robust research methodology, blending expert interviews, extensive data synthesis, and validated models for unparalleled Functional Flours Market insights. See full methodology.
Market Scope
|
Report Coverage
|
Details
|
Page number
|
182
|
Base year
|
2023
|
Historic period
|
2018-2022 |
Forecast period
|
2024-2028
|
Growth momentum & CAGR
|
Accelerate at a CAGR of 8.5%
|
Market growth 2024-2028
|
USD 36.14 billion
|
Market structure
|
Fragmented
|
YoY growth 2023-2024(%)
|
7.49
|
Key countries
|
US, Canada, Germany, UK, Italy, France, China, India, Japan, Brazil, Egypt, UAE, Oman, Argentina, KSA, UAE, Brazil, and Rest of World (ROW)
|
Competitive landscape
|
Leading Companies, Market Positioning of Companies, Competitive Strategies, and Industry Risks
|
Request Free Sample
What are the Key Data Covered in this Functional Flours Market Research and Growth Report?
- CAGR of the Functional Flours industry during the forecast period
- Detailed information on factors that will drive the growth and forecasting between 2024 and 2028
- Precise estimation of the size of the market and its contribution of the industry in focus to the parent market
- Accurate predictions about upcoming growth and trends and changes in consumer behaviour
- Growth of the market across APAC, North America, Europe, Middle East and Africa, and South America
- Thorough analysis of the market's competitive landscape and detailed information about companies
- Comprehensive analysis of factors that will challenge the functional flours market growth of industry companies
We can help! Our analysts can customize this functional flours market research report to meet your requirements.
Get in touch
1 Executive Summary
- 1.1 Market overview
- Exhibit 01: Executive Summary – Chart on Market Overview
- Exhibit 02: Executive Summary – Data Table on Market Overview
- Exhibit 03: Executive Summary – Chart on Global Market Characteristics
- Exhibit 04: Executive Summary – Chart on Market by Geography
- Exhibit 05: Executive Summary – Chart on Market Segmentation by Application
- Exhibit 06: Executive Summary – Chart on Market Segmentation by Type
- Exhibit 07: Executive Summary – Chart on Incremental Growth
- Exhibit 08: Executive Summary – Data Table on Incremental Growth
- Exhibit 09: Executive Summary – Chart on Vendor Market Positioning
2 Market Landscape
- 2.1 Market ecosystem
- Exhibit 10: Parent market
- Exhibit 11: Market Characteristics
3 Market Sizing
- 3.1 Market definition
- Exhibit 12: Offerings of vendors included in the market definition
- 3.2 Market segment analysis
- Exhibit 13: Market segments
- 3.4 Market outlook: Forecast for 2023-2028
- Exhibit 14: Chart on Global - Market size and forecast 2023-2028 ($ million)
- Exhibit 15: Data Table on Global - Market size and forecast 2023-2028 ($ million)
- Exhibit 16: Chart on Global Market: Year-over-year growth 2023-2028 (%)
- Exhibit 17: Data Table on Global Market: Year-over-year growth 2023-2028 (%)
4 Historic Market Size
- 4.1 Global functional flours market 2018 - 2022
- Exhibit 18: Historic Market Size – Data Table on global functional flours market 2018 - 2022 ($ million)
- 4.2 Application Segment Analysis 2018 - 2022
- Exhibit 19: Historic Market Size – Application Segment 2018 - 2022 ($ million)
- 4.3 Type Segment Analysis 2018 - 2022
- Exhibit 20: Historic Market Size – Type Segment 2018 - 2022 ($ million)
- 4.4 Geography Segment Analysis 2018 - 2022
- Exhibit 21: Historic Market Size – Geography Segment 2018 - 2022 ($ million)
- 4.5 Country Segment Analysis 2018 - 2022
- Exhibit 22: Historic Market Size – Country Segment 2018 - 2022 ($ million)
5 Five Forces Analysis
- 5.1 Five forces summary
- Exhibit 23: Five forces analysis - Comparison between 2023 and 2028
- 5.2 Bargaining power of buyers
- Exhibit 24: Chart on Bargaining power of buyers – Impact of key factors 2023 and 2028
- 5.3 Bargaining power of suppliers
- Exhibit 25: Bargaining power of suppliers – Impact of key factors in 2023 and 2028
- 5.4 Threat of new entrants
- Exhibit 26: Threat of new entrants – Impact of key factors in 2023 and 2028
- 5.5 Threat of substitutes
- Exhibit 27: Threat of substitutes – Impact of key factors in 2023 and 2028
- 5.6 Threat of rivalry
- Exhibit 28: Threat of rivalry – Impact of key factors in 2023 and 2028
- 5.7 Market condition
- Exhibit 29: Chart on Market condition - Five forces 2023 and 2028
6 Market Segmentation by Application
- 6.1 Market segments
- Chart on Application - Market share (2023-2028) (%)
- Data Table on Application - Market share (2023-2028) (%)
- 6.2 Comparison by Application
- Chart on Comparison by Application
- Data Table on Comparison by Application
- 6.3 RTE products - Market size and forecast (2023-2028)
- Chart on RTE products - Market size and forecast (2023-2028) ($ million)
- Data Table on RTE products - Market size and forecast (2023-2028) ($ million)
- Chart on RTE products - Year-over-year growth (2023-2028) (%)
- Data Table on RTE products - Year-over-year growth (2023-2028) (%)
- 6.4 Bakery products - Market size and forecast (2023-2028)
- Chart on Bakery products - Market size and forecast (2023-2028) ($ million)
- Data Table on Bakery products - Market size and forecast (2023-2028) ($ million)
- Chart on Bakery products - Year-over-year growth (2023-2028) (%)
- Data Table on Bakery products - Year-over-year growth (2023-2028) (%)
- 6.5 Soups and sauces - Market size and forecast (2023-2028)
- Chart on Soups and sauces - Market size and forecast (2023-2028) ($ million)
- Data Table on Soups and sauces - Market size and forecast (2023-2028) ($ million)
- Chart on Soups and sauces - Year-over-year growth (2023-2028) (%)
- Data Table on Soups and sauces - Year-over-year growth (2023-2028) (%)
- 6.6 Others - Market size and forecast (2023-2028)
- Chart on Others - Market size and forecast (2023-2028) ($ million)
- Data Table on Others - Market size and forecast (2023-2028) ($ million)
- Chart on Others - Year-over-year growth (2023-2028) (%)
- Data Table on Others - Year-over-year growth (2023-2028) (%)
- 6.7 Market opportunity by Application
- Market opportunity by Application ($ million)
- Data Table on Market opportunity by Application ($ million)
7 Market Segmentation by Type
- 7.1 Market segments
- Chart on Type - Market share (2023-2028) (%)
- Data Table on Type - Market share (2023-2028) (%)
- 7.2 Comparison by Type
- Chart on Comparison by Type
- Data Table on Comparison by Type
- 7.3 Fortified - Market size and forecast (2023-2028)
- Chart on Fortified - Market size and forecast (2023-2028) ($ million)
- Data Table on Fortified - Market size and forecast (2023-2028) ($ million)
- Chart on Fortified - Year-over-year growth (2023-2028) (%)
- Data Table on Fortified - Year-over-year growth (2023-2028) (%)
- 7.4 Specialty - Market size and forecast (2023-2028)
- Chart on Specialty - Market size and forecast (2023-2028) ($ million)
- Data Table on Specialty - Market size and forecast (2023-2028) ($ million)
- Chart on Specialty - Year-over-year growth (2023-2028) (%)
- Data Table on Specialty - Year-over-year growth (2023-2028) (%)
- 7.5 Pre-cooked - Market size and forecast (2023-2028)
- Chart on Pre-cooked - Market size and forecast (2023-2028) ($ million)
- Data Table on Pre-cooked - Market size and forecast (2023-2028) ($ million)
- Chart on Pre-cooked - Year-over-year growth (2023-2028) (%)
- Data Table on Pre-cooked - Year-over-year growth (2023-2028) (%)
- 7.6 Market opportunity by Type
- Market opportunity by Type ($ million)
- Data Table on Market opportunity by Type ($ million)
8 Market Segmentation by Source
- 8.1 Market segments
- Chart on Source - Market share (2023-2028) (%)
- Data Table on Source - Market share (2023-2028) (%)
- 8.2 Comparison by Source
- Chart on Comparison by Source
- Data Table on Comparison by Source
- 8.3 Cereals (Wheat, Rice, Corn, Oats, Barley) - Market size and forecast (2023-2028)
- Chart on Cereals (Wheat, Rice, Corn, Oats, Barley) - Market size and forecast (2023-2028) ($ million)
- Data Table on Cereals (Wheat, Rice, Corn, Oats, Barley) - Market size and forecast (2023-2028) ($ million)
- Chart on Cereals (Wheat, Rice, Corn, Oats, Barley) - Year-over-year growth (2023-2028) (%)
- Data Table on Cereals (Wheat, Rice, Corn, Oats, Barley) - Year-over-year growth (2023-2028) (%)
- 8.4 Legumes (Chickpea, Lentil, Pea, Bean) - Market size and forecast (2023-2028)
- Chart on Legumes (Chickpea, Lentil, Pea, Bean) - Market size and forecast (2023-2028) ($ million)
- Data Table on Legumes (Chickpea, Lentil, Pea, Bean) - Market size and forecast (2023-2028) ($ million)
- Chart on Legumes (Chickpea, Lentil, Pea, Bean) - Year-over-year growth (2023-2028) (%)
- Data Table on Legumes (Chickpea, Lentil, Pea, Bean) - Year-over-year growth (2023-2028) (%)
- 8.5 Oilseeds (Soy, Flaxseed) - Market size and forecast (2023-2028)
- Chart on Oilseeds (Soy, Flaxseed) - Market size and forecast (2023-2028) ($ million)
- Data Table on Oilseeds (Soy, Flaxseed) - Market size and forecast (2023-2028) ($ million)
- Chart on Oilseeds (Soy, Flaxseed) - Year-over-year growth (2023-2028) (%)
- Data Table on Oilseeds (Soy, Flaxseed) - Year-over-year growth (2023-2028) (%)
- 8.6 Nuts (Almond, Coconut) - Market size and forecast (2023-2028)
- Chart on Nuts (Almond, Coconut) - Market size and forecast (2023-2028) ($ million)
- Data Table on Nuts (Almond, Coconut) - Market size and forecast (2023-2028) ($ million)
- Chart on Nuts (Almond, Coconut) - Year-over-year growth (2023-2028) (%)
- Data Table on Nuts (Almond, Coconut) - Year-over-year growth (2023-2028) (%)
- 8.7 Pseudocereals (Quinoa, Buckwheat, Amaranth) - Market size and forecast (2023-2028)
- Chart on Pseudocereals (Quinoa, Buckwheat, Amaranth) - Market size and forecast (2023-2028) ($ million)
- Data Table on Pseudocereals (Quinoa, Buckwheat, Amaranth) - Market size and forecast (2023-2028) ($ million)
- Chart on Pseudocereals (Quinoa, Buckwheat, Amaranth) - Year-over-year growth (2023-2028) (%)
- Data Table on Pseudocereals (Quinoa, Buckwheat, Amaranth) - Year-over-year growth (2023-2028) (%)
- 8.8 Market opportunity by Source
- Market opportunity by Source ($ million)
- Data Table on Market opportunity by Source ($ million)
9 Market Segmentation by Nature
- 9.1 Market segments
- Chart on Nature - Market share (2023-2028) (%)
- Data Table on Nature - Market share (2023-2028) (%)
- 9.2 Comparison by Nature
- Chart on Comparison by Nature
- Data Table on Comparison by Nature
- 9.3 Organic - Market size and forecast (2023-2028)
- Chart on Organic - Market size and forecast (2023-2028) ($ million)
- Data Table on Organic - Market size and forecast (2023-2028) ($ million)
- Chart on Organic - Year-over-year growth (2023-2028) (%)
- Data Table on Organic - Year-over-year growth (2023-2028) (%)
- 9.4 Conventional - Market size and forecast (2023-2028)
- Chart on Conventional - Market size and forecast (2023-2028) ($ million)
- Data Table on Conventional - Market size and forecast (2023-2028) ($ million)
- Chart on Conventional - Year-over-year growth (2023-2028) (%)
- Data Table on Conventional - Year-over-year growth (2023-2028) (%)
- 9.5 Market opportunity by Nature
- Market opportunity by Nature ($ million)
- Data Table on Market opportunity by Nature ($ million)
10 Market Segmentation by Function
- 10.1 Market segments
- Chart on Function - Market share (2023-2028) (%)
- Data Table on Function - Market share (2023-2028) (%)
- 10.2 Comparison by Function
- Chart on Comparison by Function
- Data Table on Comparison by Function
- 10.3 Thickening - Market size and forecast (2023-2028)
- Chart on Thickening - Market size and forecast (2023-2028) ($ million)
- Data Table on Thickening - Market size and forecast (2023-2028) ($ million)
- Chart on Thickening - Year-over-year growth (2023-2028) (%)
- Data Table on Thickening - Year-over-year growth (2023-2028) (%)
- 10.4 Binding - Market size and forecast (2023-2028)
- Chart on Binding - Market size and forecast (2023-2028) ($ million)
- Data Table on Binding - Market size and forecast (2023-2028) ($ million)
- Chart on Binding - Year-over-year growth (2023-2028) (%)
- Data Table on Binding - Year-over-year growth (2023-2028) (%)
- 10.5 Emulsifying - Market size and forecast (2023-2028)
- Chart on Emulsifying - Market size and forecast (2023-2028) ($ million)
- Data Table on Emulsifying - Market size and forecast (2023-2028) ($ million)
- Chart on Emulsifying - Year-over-year growth (2023-2028) (%)
- Data Table on Emulsifying - Year-over-year growth (2023-2028) (%)
- 10.6 Texturizing - Market size and forecast (2023-2028)
- Chart on Texturizing - Market size and forecast (2023-2028) ($ million)
- Data Table on Texturizing - Market size and forecast (2023-2028) ($ million)
- Chart on Texturizing - Year-over-year growth (2023-2028) (%)
- Data Table on Texturizing - Year-over-year growth (2023-2028) (%)
- 10.7 Nutritional Enrichment - Market size and forecast (2023-2028)
- Chart on Nutritional Enrichment - Market size and forecast (2023-2028) ($ million)
- Data Table on Nutritional Enrichment - Market size and forecast (2023-2028) ($ million)
- Chart on Nutritional Enrichment - Year-over-year growth (2023-2028) (%)
- Data Table on Nutritional Enrichment - Year-over-year growth (2023-2028) (%)
- 10.8 Shelf Life Extension - Market size and forecast (2023-2028)
- Chart on Shelf Life Extension - Market size and forecast (2023-2028) ($ million)
- Data Table on Shelf Life Extension - Market size and forecast (2023-2028) ($ million)
- Chart on Shelf Life Extension - Year-over-year growth (2023-2028) (%)
- Data Table on Shelf Life Extension - Year-over-year growth (2023-2028) (%)
- 10.9 Market opportunity by Function
- Market opportunity by Function ($ million)
- Data Table on Market opportunity by Function ($ million)
8 Customer Landscape
- 8.1 Customer landscape overview
- Exhibit 70: Analysis of price sensitivity, lifecycle, customer purchase basket, adoption rates, and purchase criteria
9 Geographic Landscape
- 9.1 Geographic segmentation
- Exhibit 71: Chart on Market share by geography 2023-2028 (%)
- Exhibit 72: Data Table on Market share by geography 2023-2028 (%)
- 9.2 Geographic comparison
- Exhibit 73: Chart on Geographic comparison
- Exhibit 74: Data Table on Geographic comparison
- 9.3 APAC - Market size and forecast 2023-2028
- Exhibit 75: Chart on APAC - Market size and forecast 2023-2028 ($ million)
- Exhibit 76: Data Table on APAC - Market size and forecast 2023-2028 ($ million)
- Exhibit 77: Chart on APAC - Year-over-year growth 2023-2028 (%)
- Exhibit 78: Data Table on APAC - Year-over-year growth 2023-2028 (%)
- 9.4 North America - Market size and forecast 2023-2028
- Exhibit 79: Chart on North America - Market size and forecast 2023-2028 ($ million)
- Exhibit 80: Data Table on North America - Market size and forecast 2023-2028 ($ million)
- Exhibit 81: Chart on North America - Year-over-year growth 2023-2028 (%)
- Exhibit 82: Data Table on North America - Year-over-year growth 2023-2028 (%)
- 9.5 Europe - Market size and forecast 2023-2028
- Exhibit 83: Chart on Europe - Market size and forecast 2023-2028 ($ million)
- Exhibit 84: Data Table on Europe - Market size and forecast 2023-2028 ($ million)
- Exhibit 85: Chart on Europe - Year-over-year growth 2023-2028 (%)
- Exhibit 86: Data Table on Europe - Year-over-year growth 2023-2028 (%)
- 9.6 Middle East and Africa - Market size and forecast 2023-2028
- Exhibit 87: Chart on Middle East and Africa - Market size and forecast 2023-2028 ($ million)
- Exhibit 88: Data Table on Middle East and Africa - Market size and forecast 2023-2028 ($ million)
- Exhibit 89: Chart on Middle East and Africa - Year-over-year growth 2023-2028 (%)
- Exhibit 90: Data Table on Middle East and Africa - Year-over-year growth 2023-2028 (%)
- 9.7 South America - Market size and forecast 2023-2028
- Exhibit 91: Chart on South America - Market size and forecast 2023-2028 ($ million)
- Exhibit 92: Data Table on South America - Market size and forecast 2023-2028 ($ million)
- Exhibit 93: Chart on South America - Year-over-year growth 2023-2028 (%)
- Exhibit 94: Data Table on South America - Year-over-year growth 2023-2028 (%)
- 9.8 US - Market size and forecast 2023-2028
- Exhibit 95: Chart on US - Market size and forecast 2023-2028 ($ million)
- Exhibit 96: Data Table on US - Market size and forecast 2023-2028 ($ million)
- Exhibit 97: Chart on US - Year-over-year growth 2023-2028 (%)
- Exhibit 98: Data Table on US - Year-over-year growth 2023-2028 (%)
- 9.9 China - Market size and forecast 2023-2028
- Exhibit 99: Chart on China - Market size and forecast 2023-2028 ($ million)
- Exhibit 100: Data Table on China - Market size and forecast 2023-2028 ($ million)
- Exhibit 101: Chart on China - Year-over-year growth 2023-2028 (%)
- Exhibit 102: Data Table on China - Year-over-year growth 2023-2028 (%)
- 9.10 India - Market size and forecast 2023-2028
- Exhibit 103: Chart on India - Market size and forecast 2023-2028 ($ million)
- Exhibit 104: Data Table on India - Market size and forecast 2023-2028 ($ million)
- Exhibit 105: Chart on India - Year-over-year growth 2023-2028 (%)
- Exhibit 106: Data Table on India - Year-over-year growth 2023-2028 (%)
- 9.11 Germany - Market size and forecast 2023-2028
- Exhibit 107: Chart on Germany - Market size and forecast 2023-2028 ($ million)
- Exhibit 108: Data Table on Germany - Market size and forecast 2023-2028 ($ million)
- Exhibit 109: Chart on Germany - Year-over-year growth 2023-2028 (%)
- Exhibit 110: Data Table on Germany - Year-over-year growth 2023-2028 (%)
- 9.12 UK - Market size and forecast 2023-2028
- Exhibit 111: Chart on UK - Market size and forecast 2023-2028 ($ million)
- Exhibit 112: Data Table on UK - Market size and forecast 2023-2028 ($ million)
- Exhibit 113: Chart on UK - Year-over-year growth 2023-2028 (%)
- Exhibit 114: Data Table on UK - Year-over-year growth 2023-2028 (%)
- 9.13 Market opportunity by geography
- Exhibit 115: Market opportunity by geography ($ million)
- Exhibit 116: Data Tables on Market opportunity by geography ($ million)
- 12.14 Canada - Market size and forecast (2023-2028)
- Chart on Canada - Market size and forecast (2023-2028) ($ million)
- Data Table on Canada - Market size and forecast (2023-2028) ($ million)
- Chart on Canada - Year-over-year growth (2023-2028) (%)
- Data Table on Canada - Year-over-year growth (2023-2028) (%)
- 12.15 Italy - Market size and forecast (2023-2028)
- Chart on Italy - Market size and forecast (2023-2028) ($ million)
- Data Table on Italy - Market size and forecast (2023-2028) ($ million)
- Chart on Italy - Year-over-year growth (2023-2028) (%)
- Data Table on Italy - Year-over-year growth (2023-2028) (%)
- 12.16 France - Market size and forecast (2023-2028)
- Chart on France - Market size and forecast (2023-2028) ($ million)
- Data Table on France - Market size and forecast (2023-2028) ($ million)
- Chart on France - Year-over-year growth (2023-2028) (%)
- Data Table on France - Year-over-year growth (2023-2028) (%)
- 12.17 Japan - Market size and forecast (2023-2028)
- Chart on Japan - Market size and forecast (2023-2028) ($ million)
- Data Table on Japan - Market size and forecast (2023-2028) ($ million)
- Chart on Japan - Year-over-year growth (2023-2028) (%)
- Data Table on Japan - Year-over-year growth (2023-2028) (%)
- 12.18 Brazil - Market size and forecast (2023-2028)
- Chart on Brazil - Market size and forecast (2023-2028) ($ million)
- Data Table on Brazil - Market size and forecast (2023-2028) ($ million)
- Chart on Brazil - Year-over-year growth (2023-2028) (%)
- Data Table on Brazil - Year-over-year growth (2023-2028) (%)
- 12.19 Egypt - Market size and forecast (2023-2028)
- Chart on Egypt - Market size and forecast (2023-2028) ($ million)
- Data Table on Egypt - Market size and forecast (2023-2028) ($ million)
- Chart on Egypt - Year-over-year growth (2023-2028) (%)
- Data Table on Egypt - Year-over-year growth (2023-2028) (%)
- 12.20 UAE - Market size and forecast (2023-2028)
- Chart on UAE - Market size and forecast (2023-2028) ($ million)
- Data Table on UAE - Market size and forecast (2023-2028) ($ million)
- Chart on UAE - Year-over-year growth (2023-2028) (%)
- Data Table on UAE - Year-over-year growth (2023-2028) (%)
- 12.21 Oman - Market size and forecast (2023-2028)
- Chart on Oman - Market size and forecast (2023-2028) ($ million)
- Data Table on Oman - Market size and forecast (2023-2028) ($ million)
- Chart on Oman - Year-over-year growth (2023-2028) (%)
- Data Table on Oman - Year-over-year growth (2023-2028) (%)
- 12.22 Argentina - Market size and forecast (2023-2028)
- Chart on Argentina - Market size and forecast (2023-2028) ($ million)
- Data Table on Argentina - Market size and forecast (2023-2028) ($ million)
- Chart on Argentina - Year-over-year growth (2023-2028) (%)
- Data Table on Argentina - Year-over-year growth (2023-2028) (%)
- 12.23 KSA - Market size and forecast (2023-2028)
- Chart on KSA - Market size and forecast (2023-2028) ($ million)
- Data Table on KSA - Market size and forecast (2023-2028) ($ million)
- Chart on KSA - Year-over-year growth (2023-2028) (%)
- Data Table on KSA - Year-over-year growth (2023-2028) (%)
- 12.24 Rest of World (ROW) - Market size and forecast (2023-2028)
- Chart on Rest of World (ROW) - Market size and forecast (2023-2028) ($ million)
- Data Table on Rest of World (ROW) - Market size and forecast (2023-2028) ($ million)
- Chart on Rest of World (ROW) - Year-over-year growth (2023-2028) (%)
- Data Table on Rest of World (ROW) - Year-over-year growth (2023-2028) (%)
10 Drivers, Challenges, and Trends
- 10.3 Impact of drivers and challenges
- Exhibit 117: Impact of drivers and challenges in 2023 and 2028
11 Vendor Landscape
- 11.2 Vendor landscape
- Exhibit 118: Overview on Criticality of inputs and Factors of differentiation
- 11.3 Landscape disruption
- Exhibit 119: Overview on factors of disruption
- 11.4 Industry risks
- Exhibit 120: Impact of key risks on business
12 Vendor Analysis
- 12.1 Vendors covered
- Exhibit 121: Vendors covered
- 12.2 Market positioning of vendors
- Exhibit 122: Matrix on vendor position and classification
- 12.3 AGRANA Beteiligungs AG
- Exhibit 123: AGRANA Beteiligungs AG - Overview
- Exhibit 124: AGRANA Beteiligungs AG - Business segments
- Exhibit 125: AGRANA Beteiligungs AG - Key offerings
- Exhibit 126: AGRANA Beteiligungs AG - Segment focus
- 12.4 Archer Daniels Midland Co.
- Exhibit 127: Archer Daniels Midland Co. - Overview
- Exhibit 128: Archer Daniels Midland Co. - Business segments
- Exhibit 129: Archer Daniels Midland Co. - Key news
- Exhibit 130: Archer Daniels Midland Co. - Key offerings
- Exhibit 131: Archer Daniels Midland Co. - Segment focus
- 12.5 Associated British Foods Plc
- Exhibit 132: Associated British Foods Plc - Overview
- Exhibit 133: Associated British Foods Plc - Business segments
- Exhibit 134: Associated British Foods Plc - Key offerings
- Exhibit 135: Associated British Foods Plc - Segment focus
- 12.6 Bunge Global SA
- Exhibit 136: Bunge Global SA - Overview
- Exhibit 137: Bunge Global SA - Business segments
- Exhibit 138: Bunge Global SA - Key news
- Exhibit 139: Bunge Global SA - Key offerings
- Exhibit 140: Bunge Global SA - Segment focus
- 12.7 Cargill Inc.
- Exhibit 141: Cargill Inc. - Overview
- Exhibit 142: Cargill Inc. - Product / Service
- Exhibit 143: Cargill Inc. - Key news
- Exhibit 144: Cargill Inc. - Key offerings
- 12.8 Dohler GmbH
- Exhibit 145: Dohler GmbH - Overview
- Exhibit 146: Dohler GmbH - Product / Service
- Exhibit 147: Dohler GmbH - Key offerings
- 12.9 GEMEF Industries
- Exhibit 148: GEMEF Industries - Overview
- Exhibit 149: GEMEF Industries - Product / Service
- Exhibit 150: GEMEF Industries - Key offerings
- 12.10 General Mills Inc.
- Exhibit 151: General Mills Inc. - Overview
- Exhibit 152: General Mills Inc. - Business segments
- Exhibit 153: General Mills Inc. - Key news
- Exhibit 154: General Mills Inc. - Key offerings
- Exhibit 155: General Mills Inc. - Segment focus
- 12.11 Ingredion Inc.
- Exhibit 156: Ingredion Inc. - Overview
- Exhibit 157: Ingredion Inc. - Business segments
- Exhibit 158: Ingredion Inc. - Key offerings
- Exhibit 159: Ingredion Inc. - Segment focus
- 12.12 Kerry Group Plc
- Exhibit 160: Kerry Group Plc - Overview
- Exhibit 161: Kerry Group Plc - Business segments
- Exhibit 162: Kerry Group Plc - Key offerings
- Exhibit 163: Kerry Group Plc - Segment focus
- 12.13 MGP Ingredients Inc.
- Exhibit 164: MGP Ingredients Inc. - Overview
- Exhibit 165: MGP Ingredients Inc. - Product / Service
- Exhibit 166: MGP Ingredients Inc. - Key offerings
- 12.14 Olam Group Ltd.
- Exhibit 167: Olam Group Ltd. - Overview
- Exhibit 168: Olam Group Ltd. - Business segments
- Exhibit 169: Olam Group Ltd. - Key news
- Exhibit 170: Olam Group Ltd. - Key offerings
- Exhibit 171: Olam Group Ltd. - Segment focus
- 12.15 Parrish and Heimbecker Ltd.
- Exhibit 172: Parrish and Heimbecker Ltd. - Overview
- Exhibit 173: Parrish and Heimbecker Ltd. - Key offerings
- 12.16 Sensient Technologies Corp.
- Exhibit 174: Sensient Technologies Corp. - Overview
- Exhibit 175: Sensient Technologies Corp. - Business segments
- Exhibit 176: Sensient Technologies Corp. - Key offerings
- Exhibit 177: Sensient Technologies Corp. - Segment focus
- 12.17 Symrise AG
- Exhibit 178: Symrise AG - Overview
- Exhibit 179: Symrise AG - Business segments
- Exhibit 180: Symrise AG - Key offerings
- Exhibit 181: Symrise AG - Segment focus
13 Appendix
- 13.2 Inclusions and exclusions checklist
- Exhibit 182: Inclusions checklist
- Exhibit 183: Exclusions checklist
- 13.3 Currency conversion rates for US$
- Exhibit 184: Currency conversion rates for US$
- 13.4 Research methodology
- Exhibit 185: Research methodology
- Exhibit 186: Validation techniques employed for market sizing
- Exhibit 187: Information sources
- 13.5 List of abbreviations
- Exhibit 188: List of abbreviations