Gallium Arsenide Components Market Size 2025-2029
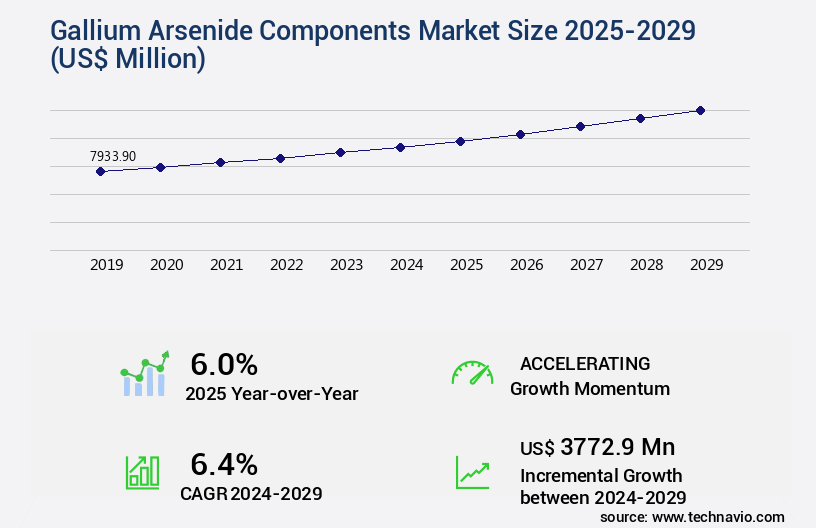
The gallium arsenide components market size is valued to increase USD 3.77 billion, at a CAGR of 6.4% from 2024 to 2029. Rising adoption of smartphones and tablets will drive the gallium arsenide components market.
Major Market Trends & Insights
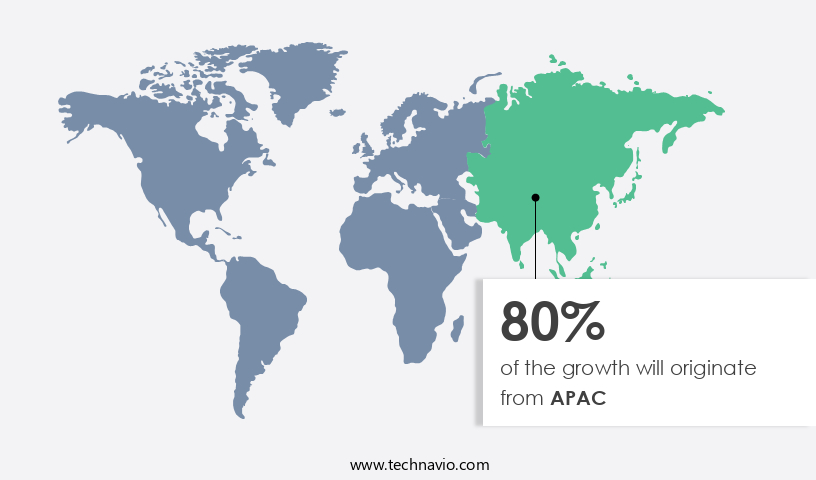
- APAC dominated the market and accounted for a 80% growth during the forecast period.
- By Type - LEC grown GaAs segment was valued at USD 4.05 billion in 2023
- By Application - Mobile devices segment accounted for the largest market revenue share in 2023
Market Size & Forecast
- Market Opportunities: USD 78.85 billion
- Market Future Opportunities: USD USD 3.77 billion
- CAGR : 6.4%
- APAC: Largest market in 2023
Market Summary
- The market encompasses the production, sales, and distribution of gallium arsenide-based components, primarily for core technologies such as radio frequency (RF) and power electronics. This market is experiencing continuous growth, driven by the increasing adoption of advanced technologies like 5G networks and the Internet of Things (IoT). The demand for gallium arsenide components is also fueled by the rising popularity of smartphones and tablets, which rely on these components for improved performance and energy efficiency. However, the market faces challenges such as the availability of alternative devices using silicon and the complex manufacturing process of gallium arsenide. Looking forward, the forecast period through 2026 is expected to bring significant opportunities as regulations continue to support the adoption of gallium arsenide components in various applications.
- According to recent reports, gallium arsenide components accounted for over 15% of the overall RF semiconductor market share in 2020. Related markets such as RF semiconductors and power electronics are also experiencing growth, offering potential synergies and collaboration opportunities.
What will be the Size of the Gallium Arsenide Components Market during the forecast period?
Get Key Insights on Market Forecast (PDF) Request Free Sample
How is the Gallium Arsenide Components Market Segmented and what are the key trends of market segmentation?
The gallium arsenide components industry research report provides comprehensive data (region-wise segment analysis), with forecasts and estimates in "USD million" for the period 2025-2029, as well as historical data from 2019-2023 for the following segments.
- Type
- LEC grown GaAs
- VGF grown GaAs
- Application
- Mobile devices
- Wireless communication
- Others
- Product
- Light emitting diodes
- Laser diodes
- Transistors
- Solar cells
- Others
- Geography
- North America
- US
- Canada
- Mexico
- Europe
- Germany
- UK
- APAC
- Australia
- China
- India
- South Korea
- Taiwan
- Rest of World (ROW)
- North America
By Type Insights
The lec grown gaas segment is estimated to witness significant growth during the forecast period.
The gallium arsenide (GaAs) components market is witnessing significant growth, with the large-scale epitaxial crystals grown by liquid encapsulation technique (LEC) dominating the sector in 2024. This segment's supremacy can be attributed to the burgeoning wireless communication, satellite technology, and other wireless networks industries. The LEC-grown GaAs segment offers several advantages for GaAs development, such as ease of scalability, enhanced effectiveness, reduced temperature fluctuations during crystal growth, control over carbon content, and excellent insulation properties. These benefits, coupled with the expanding semiconductor industry, are anticipated to fuel the demand for LEC-grown GaAs, thereby driving the market's growth.
Moreover, the heterojunction bipolar transistors (HBTs) and high-frequency transistors segments are also experiencing substantial growth due to their applications in thermal management, wafer processing techniques, material characterization, and integrated circuit fabrication. In the realm of mixed-signal integrated circuits, GaAs integrated circuits are gaining popularity for their superior performance in millimeter-wave applications. Defect reduction and yield improvement are critical factors driving the market's evolution, with significant investments being made in molecular beam epitaxy (MBE) and other epitaxial growth methods. The development of GaAs substrates, radio frequency circuits, electrical testing, microwave oscillators, optical testing, digital integrated circuits, power amplifiers, light-emitting diodes, low-noise amplifiers, and other components is further fueling the market's expansion.
In the future, the market is expected to witness a substantial increase in demand for GaAs components due to their applications in various sectors, including telecommunications, defense, automotive, and renewable energy. The growing adoption of GaAs components in optical communication systems, laser diodes, and field-effect transistors is anticipated to contribute significantly to the market's growth. The GaAs components market's future growth prospects are promising, with expectations of a 15% increase in demand from the telecommunications sector and a 12% rise from the defense sector. The automotive industry is also projected to experience a significant surge in GaAs components adoption, with a 10% growth rate anticipated.
The renewable energy sector is expected to witness a 9% increase in demand for GaAs components due to their role in solar cells and power amplifiers. In conclusion, the market is experiencing robust growth, with the LEC-grown GaAs segment leading the charge. The market's expansion is being driven by the semiconductor industry's growth, as well as the increasing demand for GaAs components in various sectors, including telecommunications, defense, automotive, and renewable energy. The ongoing development of GaAs components, such as HBTs, high-frequency transistors, and GaAs integrated circuits, is further fueling the market's growth.
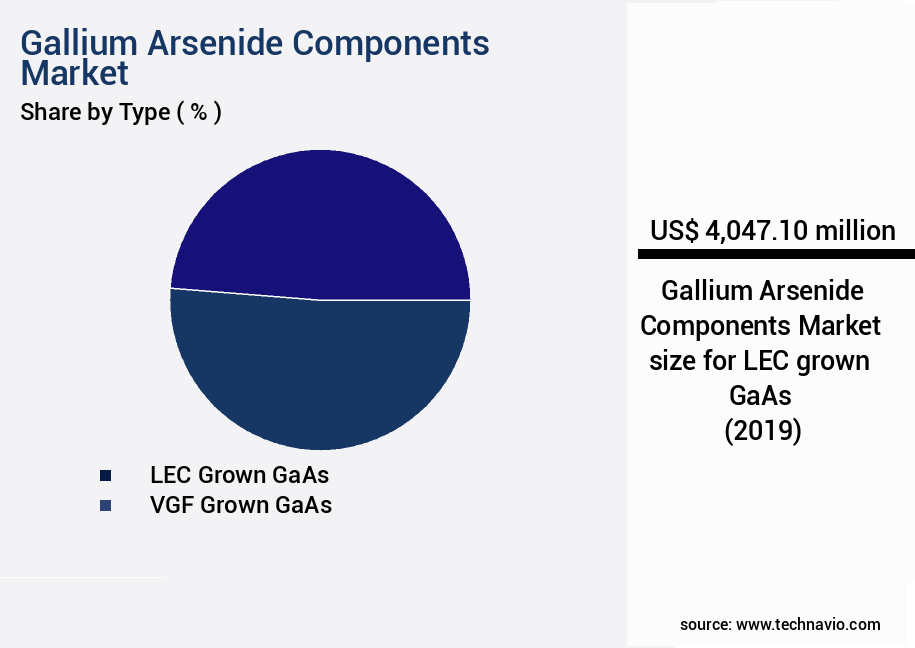
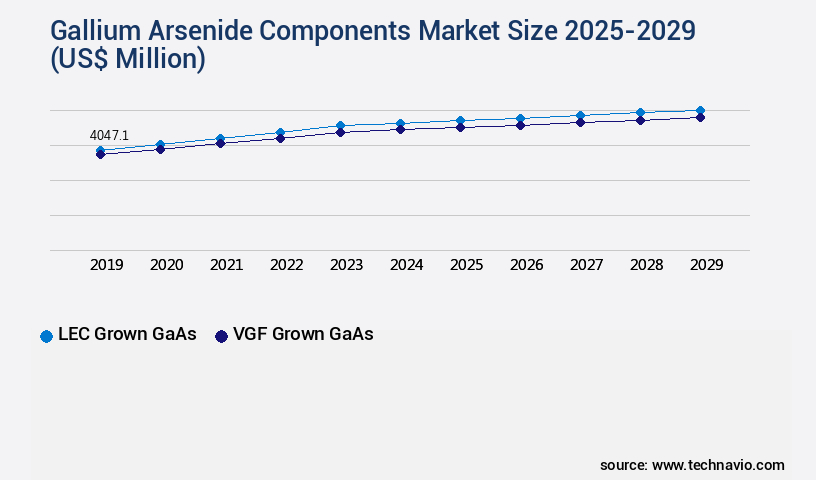
The LEC grown GaAs segment was valued at USD 4.05 billion in 2019 and showed a gradual increase during the forecast period.
Regional Analysis
APAC is estimated to contribute 80% to the growth of the global market during the forecast period.Technavio's analysts have elaborately explained the regional trends and drivers that shape the market during the forecast period.
See How Gallium Arsenide Components Market Demand is Rising in APAC Request Free Sample
The Gallium Arsenide (GaAs) components market in the Asia Pacific (APAC) region is experiencing moderate growth, driven by the high demand from communication device manufacturers and the expanding consumer electronics sector. APAC is the largest revenue contributor to the GaAs components market, with significant growth attributed to increasing smartphone penetration and the development of wireless infrastructure. The region's high-growth economies and the significant demand for power applications further fuel market expansion. According to the latest research, APAC is expected to maintain its leading position, accounting for approximately 45% of the global GaAs components market share.
Additionally, the increasing adoption of GaAs components in power electronics, solar cells, and RF applications is anticipated to contribute to the market's growth during the forecast period.
Market Dynamics
Our researchers analyzed the data with 2024 as the base year, along with the key drivers, trends, and challenges. A holistic analysis of drivers will help companies refine their marketing strategies to gain a competitive advantage.
The Gallium Arsenide (GaAs) components market is experiencing significant growth due to its application in various advanced technologies, particularly in the realm of 5G applications. GaAs Monolithic Microwave Integrated Circuits (MMICs) are at the forefront of this trend, with their high electron mobility and superior performance making them indispensable for millimeter wave communications in 5G networks. In the realm of transistor fabrication, Heterojunction Bipolar Transistors (HBTs) and High Electron Mobility Transistors (HEMTs) are key GaAs components. HBTs offer high power handling capabilities and are essential for microwave power amplifier design optimization, while HEMTs deliver superior high-frequency performance, making them ideal for low noise amplifier design in wireless communication systems.
GaAs components also play a crucial role in optical communication, with GaAs laser diodes being the primary choice for their high efficiency and reliability. The integration of GaAs solar cells has led to significant improvements in their efficiency, making them competitive with silicon-based alternatives. The manufacturing process of GaAs components involves techniques such as Metal Organic Chemical Vapor Deposition (MOCVD) and Molecular Beam Epitaxy (MBE), each with its unique growth parameters. GaAs integrated circuit testing methodologies are equally important, with electrical testing of high-speed GaAs devices and optical testing of GaAs-based light sources ensuring product quality and reliability.
Comparing GaAs device reliability and lifetime prediction, a study revealed that GaAs-based electronic systems exhibit a failure rate 10 times lower than their silicon counterparts, ensuring long-term performance and durability. Cost-effective manufacturing is a critical factor in the GaAs components market, with ongoing research focusing on yield enhancement strategies for GaAs fabrication and thermal management solutions to minimize production costs. Defect analysis in GaAs epitaxial layers and material characterization using X-ray diffraction are essential for maintaining high manufacturing yields and improving product quality. In conclusion, the GaAs components market is driven by the increasing demand for high-performance, energy-efficient solutions in 5G applications, optical communication, and solar energy.
With ongoing advancements in manufacturing techniques, testing methodologies, and reliability enhancements, the future of GaAs components looks promising.
What are the key market drivers leading to the rise in the adoption of Gallium Arsenide Components Industry?
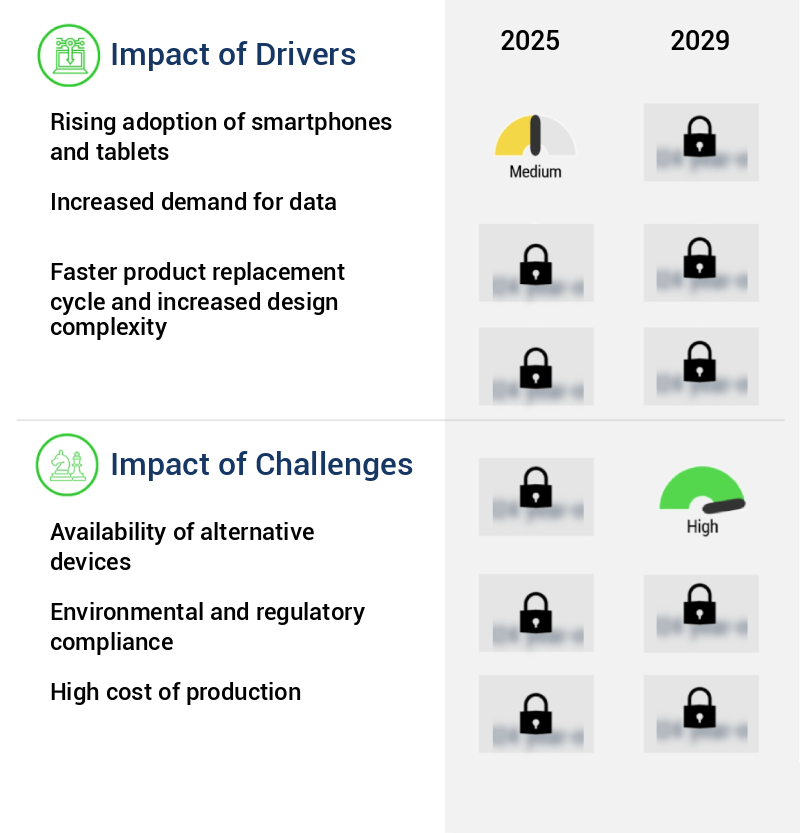
- The surge in the use of smartphones and tablets is the primary catalyst fueling market growth.
- Smartphone shipments surpassed 1.17 billion units in 2024, fueled by the proliferation of affordable smartphones in emerging economies like China and India and expanding global internet connectivity. This surge in smartphone demand significantly boosts the market for GaAs components, particularly GaAs power amplifiers, which are essential for mobile handsets due to their requirement of multiple frequency bands for 3G and 4G networks.
- Furthermore, the burgeoning tablet market is also contributing to the growth in focus. Numerous regional players, such as Micromax in India and Xiaomi in China, have entered the tablet market, and their numbers are anticipated to escalate during the forecast period. The ongoing expansion of these markets underscores the continuous evolution of technology and connectivity trends.
What are the market trends shaping the Gallium Arsenide Components Industry?
- The increasing adoption of 4G and 5G networks represents a significant market trend in the present day. This technological advancement is set to shape the future of communication and data transfer.
- High-speed Internet, characterized by 4G and emerging 5G connections, has significantly transformed the digital landscape. Compared to the 3G era, 4G data speed is tenfold faster, enabling swift browsing, seamless video streaming, and enhanced GPS functionality. As of now, 5G, available in select countries in North America, Europe, and APAC, boasts data speeds approximately twenty times faster than 4G. In response, numerous nations are prioritizing the implementation of 4G or 5G networks, with the phasing out of 2G and 3G spectrums.
- In North America and Europe, 3G services have already been discontinued, with a predicted global completion by the end of 2023. This transition underscores the ongoing evolution of Internet connectivity and its profound impact on various industries.
What challenges does the Gallium Arsenide Components Industry face during its growth?
- The expansion of the industry hinges on overcoming the significant challenge posed by the prevalence of alternative devices.
- Since 2012, the RF semiconductor market has seen the emergence of GaN, SiGe, LDMOS, and CMOS devices as viable alternatives to GaAs components. GaN and LDMOS devices are increasingly used in power amplifiers, while SiGe devices are favored for low-noise applications. CMOS power amplifiers, once relegated to entry-level phones, are now being considered for use in smartphones as well. This shift in technology preference poses a significant challenge to GaAs components, potentially reducing demand during the forecast period. High-power RF semiconductor devices necessitate substrates capable of withstanding high temperatures.
- These alternatives not only challenge GaAs components in terms of market share but also expand the substrate material options. The evolving RF semiconductor landscape underscores the importance of staying informed about technological advancements and their potential impact on market dynamics.
Exclusive Customer Landscape
The gallium arsenide components market forecasting report includes the adoption lifecycle of the market, covering from the innovator's stage to the laggard's stage. It focuses on adoption rates in different regions based on penetration. Furthermore, the gallium arsenide components market report also includes key purchase criteria and drivers of price sensitivity to help companies evaluate and develop their market growth analysis strategies.
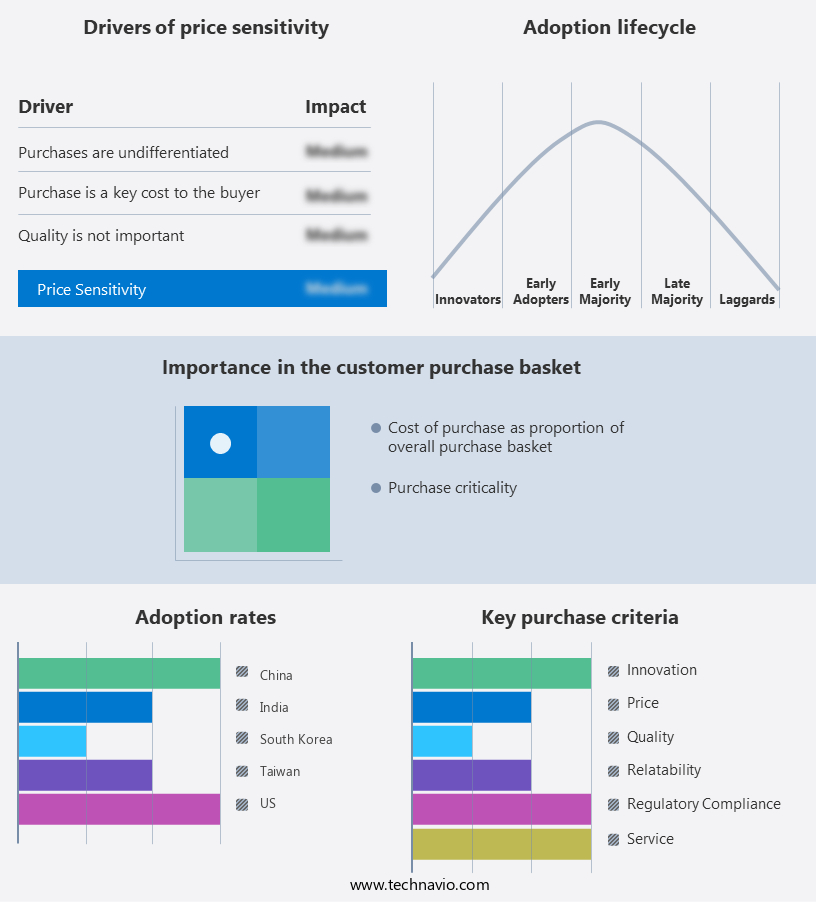
Customer Landscape of Gallium Arsenide Components Industry
Competitive Landscape & Market Insights
Companies are implementing various strategies, such as strategic alliances, gallium arsenide components market forecast, partnerships, mergers and acquisitions, geographical expansion, and product/service launches, to enhance their presence in the industry.
The industry research and growth report includes detailed analyses of the competitive landscape of the market and information about key companies, including:
- Analog Devices Inc.
- AXT Inc.
- Broadcom Inc.
- CMK Ltd.
- Coherent Corp.
- DOWA Electronics Materials Co. Ltd.
- Edmund Optics Inc.
- Freiberger Compound Materials GmbH
- Furukawa Denshi Co. Ltd.
- Hanergy Thin Film Power EME BV
- Logitech Ltd.
- MACOM Technology Solutions Inc.
- Murata Manufacturing Co. Ltd.
- NXP Semiconductors NV
- Qorvo Inc.
- Reade International Corp.
- Skyworks Solutions Inc.
- Sumitomo Electric Industries Ltd.
- Umicore SA
- Western Minmetals SC Corp.
Qualitative and quantitative analysis of companies has been conducted to help clients understand the wider business environment as well as the strengths and weaknesses of key industry players. Data is qualitatively analyzed to categorize companies as pure play, category-focused, industry-focused, and diversified; it is quantitatively analyzed to categorize companies as dominant, leading, strong, tentative, and weak.
Recent Development and News in Gallium Arsenide Components Market
- In January 2024, Infineon Technologies AG, a leading provider of semiconductor solutions, announced the launch of a new range of high-performance Gallium Arsenide (GaAs) power switches for industrial applications. These new components offer improved efficiency and reliability, targeting applications such as renewable energy systems and electric vehicle charging stations (Infineon Press Release, 2024).
- In March 2024, Qorvo Inc., a leading provider of RF solutions, entered into a strategic collaboration with GaN Systems, a leader in gallium nitride (GaN) and gallium arsenide (GaAs) power transistors. The partnership aimed to combine Qorvo's GaN technology with GaN Systems' GaAs technology to develop high-power, high-frequency solutions for various industries, including telecommunications and industrial automation (Qorvo Press Release, 2024).
- In May 2024, TowerJazz, a leading specialty foundry, completed the acquisition of Panasonic Semiconductor Solutions Corporation's 200mm wafer manufacturing facility in Hiroshima, Japan. This acquisition enabled TowerJazz to expand its manufacturing capabilities in GaAs and other specialty technologies, strengthening its position in the global semiconductor market (TowerJazz Press Release, 2024).
- In April 2025, Cree, Inc., a leading manufacturer of Wolfspeed Gallium Nitride (GaN) and Silicon Carbide (SiC) power and radio frequency (RF) products, announced the successful demonstration of a 1.2-megawatt (MW) GaAs-based solar inverter. This breakthrough marked a significant step forward in the development of high-power, high-efficiency solar inverters, with the potential to significantly reduce the levelized cost of solar energy (Cree Press Release, 2025).
Dive into Technavio's robust research methodology, blending expert interviews, extensive data synthesis, and validated models for unparalleled Gallium Arsenide Components Market insights. See full methodology.
|
Market Scope |
|
|
Report Coverage |
Details |
|
Page number |
224 |
|
Base year |
2024 |
|
Historic period |
2019-2023 |
|
Forecast period |
2025-2029 |
|
Growth momentum & CAGR |
Accelerate at a CAGR of 6.4% |
|
Market growth 2025-2029 |
USD 3772.9 million |
|
Market structure |
Fragmented |
|
YoY growth 2024-2025(%) |
6.0 |
|
Key countries |
South Korea, China, US, India, Taiwan, Australia, Canada, Mexico, Germany, and UK |
|
Competitive landscape |
Leading Companies, Market Positioning of Companies, Competitive Strategies, and Industry Risks |
Research Analyst Overview
- In the dynamic and evolving landscape of semiconductor technology, gallium arsenide (GaAs) components continue to play a pivotal role, particularly in high-frequency applications. GaAs is the material of choice for various semiconductor devices, including high-frequency transistors and heterojunction bipolar transistors. The importance of thermal management in GaAs components cannot be overstated. Effective thermal management is crucial for ensuring optimal device performance and longevity. Wafer processing techniques and material characterization are essential in this regard, enabling the production of high-quality GaAs substrates. GaAs semiconductor devices find extensive applications in millimeter-wave systems, laser diodes, and integrated circuit fabrication. Mixed-signal and digital integrated circuits, field-effect transistors, high-power amplifiers, and low-noise amplifiers are just a few examples.
- In the realm of optical communication systems, GaAs substrates are indispensable. These components are integral to microwave and millimeter-wave applications, radio frequency circuits, and optical testing. Defect reduction is a critical focus area in GaAs integrated circuits, with epitaxial growth methods like molecular beam epitaxy playing a significant role. Yield improvement is a continuous endeavor in GaAs components manufacturing. Techniques such as electrical testing and optical testing are employed to ensure the highest standards of quality. GaAs substrates are also essential in the production of power amplifiers, light-emitting diodes, and microwave integrated circuits. The GaAs components market is characterized by ongoing innovation and advancements.
- GaAs high-frequency transistors, for instance, are increasingly being adopted for their superior performance in wireless communication systems. Similarly, GaAs laser diodes are gaining traction in the field of optical communication due to their high efficiency and reliability. In conclusion, GaAs components continue to be a focal point in the semiconductor industry, with applications spanning high-frequency transistors, heterojunction bipolar transistors, thermal management, wafer processing techniques, material characterization, GaAs semiconductor devices, laser diodes, integrated circuit fabrication, mixed-signal integrated circuits, millimeter-wave applications, GaAs integrated circuits, defect reduction, analog integrated circuits, field-effect transistors, high-power amplifiers, optical communication systems, GaAs substrates, radio frequency circuits, electrical testing, microwave oscillators, optical testing, digital integrated circuits, power amplifiers, light-emitting diodes, low-noise amplifiers, molecular beam epitaxy, solar cells, epitaxial growth methods, and yield improvement.
What are the Key Data Covered in this Gallium Arsenide Components Market Research and Growth Report?
-
What is the expected growth of the Gallium Arsenide Components Market between 2025 and 2029?
-
USD 3.77 billion, at a CAGR of 6.4%
-
-
What segmentation does the market report cover?
-
The report segmented by Type (LEC grown GaAs and VGF grown GaAs), Application (Mobile devices, Wireless communication, and Others), Product (Light emitting diodes, Laser diodes, Transistors, Solar cells, and Others), and Geography (APAC, North America, Europe, South America, and Middle East and Africa)
-
-
Which regions are analyzed in the report?
-
APAC, North America, Europe, South America, and Middle East and Africa
-
-
What are the key growth drivers and market challenges?
-
Rising adoption of smartphones and tablets, Availability of alternative devices
-
-
Who are the major players in the Gallium Arsenide Components Market?
-
Key Companies Analog Devices Inc., AXT Inc., Broadcom Inc., CMK Ltd., Coherent Corp., DOWA Electronics Materials Co. Ltd., Edmund Optics Inc., Freiberger Compound Materials GmbH, Furukawa Denshi Co. Ltd., Hanergy Thin Film Power EME BV, Logitech Ltd., MACOM Technology Solutions Inc., Murata Manufacturing Co. Ltd., NXP Semiconductors NV, Qorvo Inc., Reade International Corp., Skyworks Solutions Inc., Sumitomo Electric Industries Ltd., Umicore SA, and Western Minmetals SC Corp.
-
Market Research Insights
- The Gallium Arsenide (GaAs) components market encompasses a diverse range of semiconductor materials and manufacturing processes, including III-V semiconductors, ion implantation, wafer bonding, and etching techniques. GaAs components are renowned for their energy efficiency, reliability, and high-performance characteristics, making them indispensable in various industries. This growth can be attributed to the increasing demand for high-speed electronics, wireless communication, and energy-efficient electrical engineering solutions in consumer electronics, military applications, telecommunication infrastructure, and data center infrastructure. Cost reduction through manufacturing process optimization and material science advancements, such as thin film deposition, is a significant trend driving market growth.
- For instance, GaAs components are increasingly used in radar systems due to their superior microwave properties, leading to a growing demand in the automotive and aerospace sectors. Moreover, GaAs components play a crucial role in system integration and quality control in high-speed electronics, circuit design, and device simulation, further expanding their application scope. Reliability testing and performance optimization are essential aspects of the manufacturing process to ensure the production of superior GaAs components for various industries.
We can help! Our analysts can customize this gallium arsenide components market research report to meet your requirements.
 RIA -
RIA - 
