Gaming Simulators Market Size 2025-2029
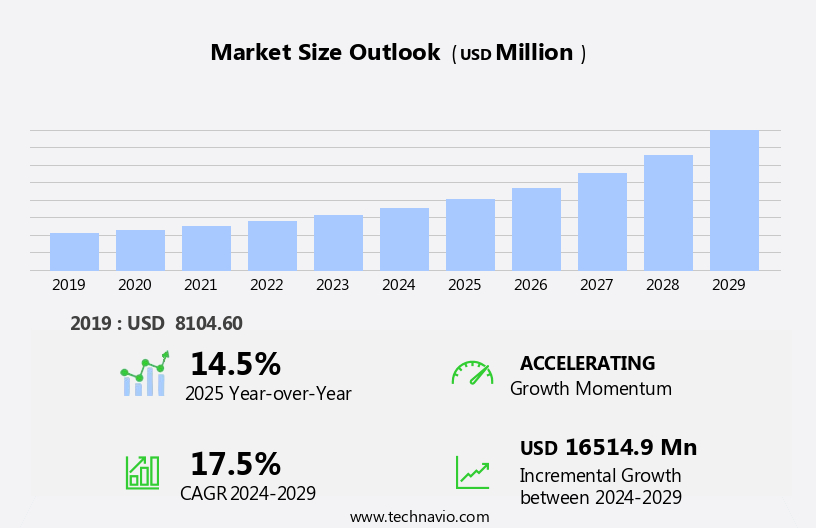
The gaming simulators market size is forecast to increase by USD 16.51 billion at a CAGR of 17.5% between 2024 and 2029.
- The market is experiencing significant growth, driven by the integration of Virtual Reality (VR) headsets and the acceptance of 360-degree cameras as next-generation technology. These advancements provide enriching gaming experiences, replicating real-world environments with unprecedented accuracy. However, the high cost of gaming simulators remains a significant challenge for market expansion. Despite this, opportunities abound for companies that can offer affordable solutions or cater to niche markets, such as military training, aviation simulation, and professional sports training. As the technology matures and becomes more accessible, the gaming simulator market is poised to disrupt traditional industries and create new revenue streams. Companies seeking to capitalize on these opportunities must stay abreast of emerging trends and navigate the evolving regulatory landscape to ensure long-term success.
What will be the Size of the Gaming Simulators Market during the forecast period?

Request Free Sample
- The market encompasses a range of enriching experiences, including virtual reality (VR) and augmented reality (AR) simulations, next-level racing, and high-fidelity simulations. These innovative technologies offer users the opportunity to engage with various game genres, such as simulation games, in a more interactive and realistic manner. The market's growth is driven by the increasing popularity of VR and high-speed internet networks, enabling seamless gameplay and enhanced user experiences. Amusement and theme parks have also adopted simulators as a new attraction, catering to the demand for stress busters and interactive entertainment. Touch devices and popular games further expand the market's reach, making simulation games accessible to a wider audience.
- The perception of simulation games as enriching training experiences, the industry adheres to stringent safety regulations to ensure authentic and safe environments for users. The future of the simulator industry lies in continued innovation, delivering increasingly realistic and engaging experiences for users across various industries and applications.
How is this Gaming Simulators Industry segmented?
The gaming simulators industry research report provides comprehensive data (region-wise segment analysis), with forecasts and estimates in "USD billion" for the period 2025-2029, as well as historical data from 2019-2023 for the following segments.
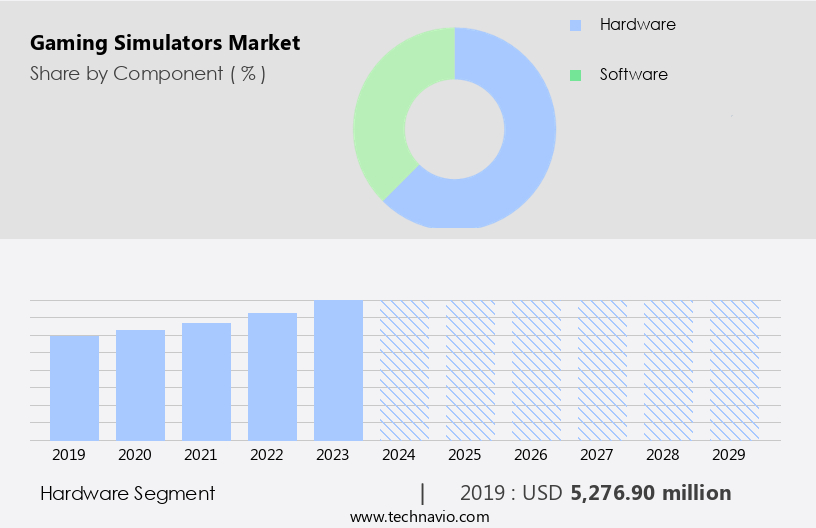
- Component
- End-user
- Type
- Variant
- Geography
- North America
- Europe
- France
- Germany
- Italy
- The Netherlands
- UK
- APAC
- South America
- Middle East and Africa
By Component Insights
The hardware segment is estimated to witness significant growth during the forecast period. The market has witnessed significant hardware advancements since 2010, with companies like Vertuix and Elsaco investing heavily to improve the gaming interface. Hardware investments include VR headsets, gaming cockpits, motion detectors, and haptic feedback systems. While hardware sales contribute to market revenue, their potential for enhancing the gaming experience is limited. The gaming landscape has evolved from PC gaming to mobile gaming, VR headsets, and now simulators. Virtual reality, cloud computing, and augmented reality are key trends driving market growth. Simulation games, including life sims, city-builder sims, survival simulations, agricultural sims, sports sims, and flight simulation, are popular genres.

Get a glance at the market report of share of various segments Request Free Sample
The hardware segment was valued at USD 5.28 billion in 2019 and showed a gradual increase during the forecast period.
Regional Analysis
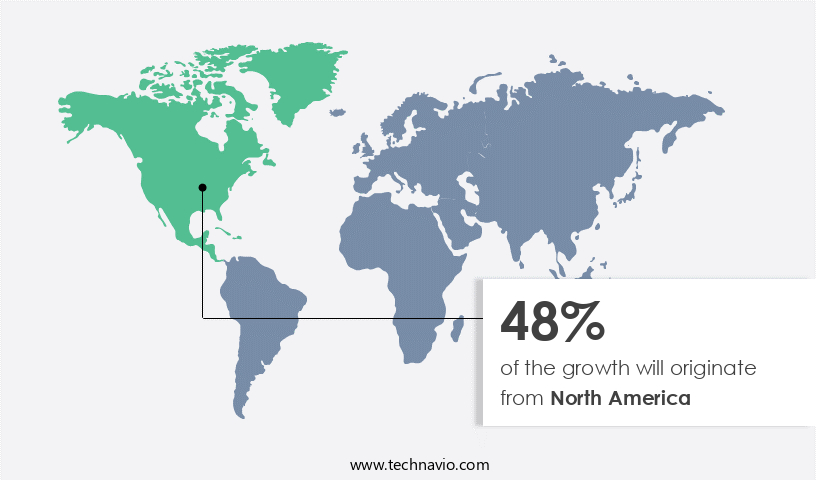
North America is estimated to contribute 48% to the growth of the global market during the forecast period. Technavio's analysts have elaborately explained the regional trends and drivers that shape the market during the forecast period.

For more insights on the market size of various regions, Request Free Sample
The North American market holds the largest share in the gaming simulators industry due to the region's high average disposable income. This economic factor, coupled with the increasing popularity of e-sports, has made gaming simulators more accessible to consumers. The proliferation of streaming platforms like Twitch and YouTube, which offer free telecasts of e-sports events, has further fueled the growth of the gaming market in North America. Additionally, the US government's issuance of visas to e-sports gamers, similar to those for professional athletes, is encouraging more individuals to pursue e-sports as a career. The market in North America is witnessing significant growth, driven by technological advancements, enriching experiences, and customer-centric products.
Market Dynamics
Our researchers analyzed the data with 2024 as the base year, along with the key drivers, trends, and challenges. A holistic analysis of drivers will help companies refine their marketing strategies to gain a competitive advantage.
What are the key market drivers leading to the rise in the adoption of Gaming Simulators Industry?
- Gaming simulators integrated with VR headsets is the key driver of the market. The integration of Virtual Reality (VR) technology in gaming simulators is revolutionizing the gaming industry. VR headsets offer an enriching experience, allowing gamers to fully engage with their games without distractions. As an alternative to expensive LED screens, VR headsets present a cost-effective solution for gamers. The market for gaming simulators is experiencing significant growth due to this technological advancement.
- With the increasing popularity of VR headsets, consumers are becoming more familiar with their functionality and usability. As a result, the market, which is among the fastest-growing technology adopters, is poised to benefit from this trend. VR headsets provide a more interactive and engaging gaming experience, making them an essential component of the market.
What are the market trends shaping the Gaming Simulators Industry?
- Acceptance of 360-degree camera as next-generation technology in gaming simulator market is the upcoming market trend. The global Virtual Reality (VR) content market's technological advancements have brought about the integration of 360-degree videos in VR headsets. VR has emerged as a prominent gaming platform in the entertainment industry and is expanding to diverse digital platforms.
- The fusion of VR with gaming simulators is gaining traction and represents a significant innovation in the gaming sector. The inclusion of a 360-degree field of vision in VR headsets significantly enhances the quality of experience for gaming simulators. Gamers can now immerse themselves in a more realistic and comprehensive VR environment. Major tech companies, including Facebook with Oculus Rift, Sony with Morpheus, and HTC with Vive, are launching VR devices, driving the growth of VR integration with 360-degree content and gaming simulators throughout the forecast period.
What challenges does the Gaming Simulators Industry face during its growth?
- Gaming simulators are expensive is a key challenge affecting the industry growth. The market faces a significant challenge as the high cost of simulators prices many potential consumers out of the market. These devices are primarily used in commercial establishments due to their prohibitive cost for individual ownership. The average gamer seeking a simulator experience must pay a premium price for limited playtime.
- In commercial settings, gamers often cannot fully enjoy the simulation due to time constraints. This issue is particularly prevalent in regions with high demand for gaming experiences but relatively low average disposable incomes, such as parts of Asia. This pricing dynamic limits the market's reach and growth potential.
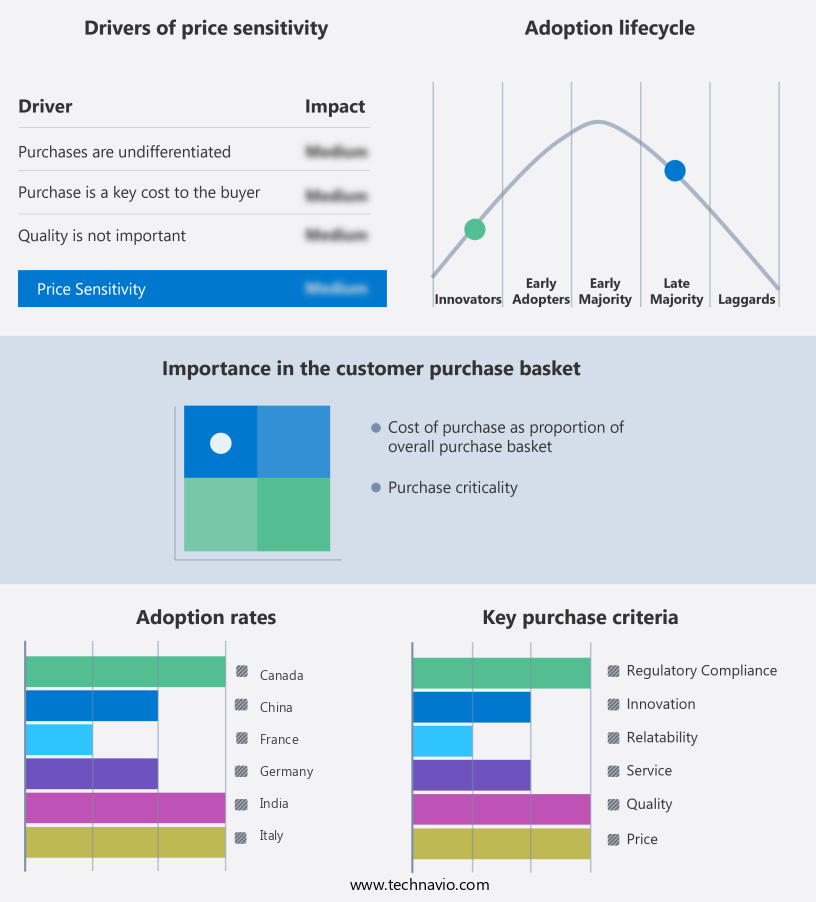
Exclusive Customer Landscape
The gaming simulators market forecasting report includes the adoption lifecycle of the market, covering from the innovator's stage to the laggard's stage. It focuses on adoption rates in different regions based on penetration. Furthermore, the gaming simulators market report also includes key purchase criteria and drivers of price sensitivity to help companies evaluate and develop their market growth analysis strategies.

Customer Landscape
Key Companies & Market Insights
Companies are implementing various strategies, such as strategic alliances, gaming simulators market forecast, partnerships, mergers and acquisitions, geographical expansion, and product/service launches, to enhance their presence in the industry.
3D perception AS - The company offers gaming simulators such as Northstar.
The industry research and growth report includes detailed analyses of the competitive landscape of the market and information about key companies, including:
- Adacel Technologies Ltd.
- Aero Simulation Inc.
- Atomic Motion Systems
- BLUEHALO LLC
- CKAS Mechatronics Pty Ltd
- Cruden
- CXC Simulations
- D BOX Technologies Inc.
- Eleetus LLC
- GTR Simulators
- Guillemot Corp. SA
- Hammacher Schlemmer and Co. Inc.
- Lean Games Ltd.
- Playseat BV
- RSEAT Ltd.
- Simtechpro SL
- SimXperience
- Sony Group Corp.
- Vesaro Ltd.
Qualitative and quantitative analysis of companies has been conducted to help clients understand the wider business environment as well as the strengths and weaknesses of key industry players. Data is qualitatively analyzed to categorize companies as pure play, category-focused, industry-focused, and diversified; it is quantitatively analyzed to categorize companies as dominant, leading, strong, tentative, and weak.
Research Analyst Overview
The market continues to evolve, offering enriching experiences that cater to various industries and individual interests. This dynamic industry is driven by technological advancements and the increasing adoption of high-speed internet networks, enabling seamless access to cloud-based gaming and virtual reality (VR) experiences. Simulation games encompass a wide range of genres, including life sims, city-builder sims, survival simulations, agricultural sims, sports sims, and more. These games provide users with the ability to explore complex situations in a controlled environment, offering a risk-free space for decision-making abilities to develop. The gaming industry's shift towards simulation games is influenced by the growing popularity of VR headsets and augmented reality (AR) technology.
In addition, these technologies allow for high-fidelity simulations, providing users with increasingly realistic graphics and enriching virtual environments. Furthermore, the integration of haptic feedback, motion detectors, and 360-degree videos adds to the overall gaming experience. The simulator industry is not limited to the entertainment sector. It also plays a significant role in various industries, such as automotive and maritime, where simulation-based training is essential for operational efficiency and safety. Regulatory requirements mandate the use of advanced training solutions, ensuring that professionals are well-equipped to handle real-life situations. Gaming consoles and touch devices have become the primary platforms for simulation games, with mobile gaming and cloud gaming gaining traction due to their affordability and accessibility.
Furthermore, new mobile games and online gaming operations continue to emerge, catering to diverse user preferences and skill levels. The simulator market ecosystem is diverse, with simulator developers focusing on creating customer-centric products and delivering them efficiently. The industry's growth is driven by the demand for enriching training experiences, which can be used for equipment-use training, computer-based battlefield scenarios, pilot training, and more. The adoption of smartphones and the rise of esports arenas have further fueled the growth of the simulation games market. Multiplayer simulators and networked training scenarios offer users the opportunity to compete and collaborate in real-time, enhancing the overall gaming experience.
Therefore, the simulation games market is a dynamic and evolving industry, driven by technological advancements and the growing demand for enriching training experiences. The integration of VR, AR, and other cutting-edge technologies continues to shape the industry, offering users increasingly realistic and engaging gaming experiences across various genres and platforms.
Market Scope
|
Report Coverage
|
Details
|
Page number
|
226
|
Base year
|
2024
|
Historic period
|
2019-2023 |
Forecast period
|
2025-2029
|
Growth momentum & CAGR
|
Accelerate at a CAGR of 17.5%
|
Market growth 2025-2029
|
USD 16.51 billion
|
Market structure
|
Fragmented
|
YoY growth 2024-2025(%)
|
14.5
|
Key countries
|
US, Canada, UK, Germany, Italy, The Netherlands, China, France, Japan, and India
|
Competitive landscape
|
Leading Companies, market growth and forecasting, Market Positioning of Companies, Competitive Strategies, and Industry Risks
|
Request Free Sample
What are the Key Data Covered in this Gaming Simulators Market Research and Growth Report?
- CAGR of the Gaming Simulators industry during the forecast period
- Detailed information on factors that will drive the growth and forecasting between 2025 and 2029
- Precise estimation of the size of the market and its contribution of the industry in focus to the parent market
- Accurate predictions about upcoming growth and trends and changes in consumer behaviour
- Growth of the market across North America, Europe, APAC, South America, and Middle East and Africa
- Thorough analysis of the market's competitive landscape and detailed information about companies
- Comprehensive analysis of factors that will challenge the gaming simulators market growth of industry companies
We can help! Our analysts can customize this gaming simulators market research report to meet your requirements.
Get in touch
1 Executive Summary
- 1.1 Market overview
- Executive Summary - Chart on Market Overview
- Executive Summary - Data Table on Market Overview
- Executive Summary - Chart on Global Market Characteristics
- Executive Summary - Chart on Market by Geography
- Executive Summary - Chart on Market Segmentation by Component
- Executive Summary - Chart on Market Segmentation by End-user
- Executive Summary - Chart on Market Segmentation by Type
- Executive Summary - Chart on Market Segmentation by Variant
- Executive Summary - Chart on Incremental Growth
- Executive Summary - Data Table on Incremental Growth
- Executive Summary - Chart on Company Market Positioning
2 Technavio Analysis
- 2.1 Analysis of price sensitivity, lifecycle, customer purchase basket, adoption rates, and purchase criteria
- Analysis of price sensitivity, lifecycle, customer purchase basket, adoption rates, and purchase criteria
- 2.2 Criticality of inputs and Factors of differentiation
- Overview on criticality of inputs and factors of differentiation
- 2.3 Factors of disruption
- Overview on factors of disruption
- 2.4 Impact of drivers and challenges
- Impact of drivers and challenges in 2024 and 2029
3 Market Landscape
- 3.1 Market ecosystem
- Parent Market
- Data Table on - Parent Market
- 3.2 Market characteristics
- Market characteristics analysis
4 Market Sizing
- 4.1 Market definition
- Offerings of companies included in the market definition
- 4.2 Market segment analysis
- 4.4 Market outlook: Forecast for 2024-2029
- Chart on Global - Market size and forecast 2024-2029 ($ million)
- Data Table on Global - Market size and forecast 2024-2029 ($ million)
- Chart on Global Market: Year-over-year growth 2024-2029 (%)
- Data Table on Global Market: Year-over-year growth 2024-2029 (%)
5 Historic Market Size
- 5.1 Global Gaming Simulators Market 2019 - 2023
- Historic Market Size - Data Table on Global Gaming Simulators Market 2019 - 2023 ($ million)
- 5.2 Component segment analysis 2019 - 2023
- Historic Market Size - Component Segment 2019 - 2023 ($ million)
- 5.3 End-user segment analysis 2019 - 2023
- Historic Market Size - End-user Segment 2019 - 2023 ($ million)
- 5.4 Type segment analysis 2019 - 2023
- Historic Market Size - Type Segment 2019 - 2023 ($ million)
- 5.5 Variant segment analysis 2019 - 2023
- Historic Market Size - Variant Segment 2019 - 2023 ($ million)
- 5.6 Geography segment analysis 2019 - 2023
- Historic Market Size - Geography Segment 2019 - 2023 ($ million)
- 5.7 Country segment analysis 2019 - 2023
- Historic Market Size - Country Segment 2019 - 2023 ($ million)
6 Qualitative Analysis
- 6.1 Impact of AI on the global gaming simulators market
7 Five Forces Analysis
- 7.1 Five forces summary
- Five forces analysis - Comparison between 2024 and 2029
- 7.2 Bargaining power of buyers
- Bargaining power of buyers - Impact of key factors 2024 and 2029
- 7.3 Bargaining power of suppliers
- Bargaining power of suppliers - Impact of key factors in 2024 and 2029
- 7.4 Threat of new entrants
- Threat of new entrants - Impact of key factors in 2024 and 2029
- 7.5 Threat of substitutes
- Threat of substitutes - Impact of key factors in 2024 and 2029
- 7.6 Threat of rivalry
- Threat of rivalry - Impact of key factors in 2024 and 2029
- 7.7 Market condition
- Chart on Market condition - Five forces 2024 and 2029
8 Market Segmentation by Component
- 8.1 Market segments
- Chart on Component - Market share 2024-2029 (%)
- Data Table on Component - Market share 2024-2029 (%)
- 8.2 Comparison by Component
- Chart on Comparison by Component
- Data Table on Comparison by Component
- 8.3 Hardware - Market size and forecast 2024-2029
- Chart on Hardware - Market size and forecast 2024-2029 ($ million)
- Data Table on Hardware - Market size and forecast 2024-2029 ($ million)
- Chart on Hardware - Year-over-year growth 2024-2029 (%)
- Data Table on Hardware - Year-over-year growth 2024-2029 (%)
- 8.4 Software - Market size and forecast 2024-2029
- Chart on Software - Market size and forecast 2024-2029 ($ million)
- Data Table on Software - Market size and forecast 2024-2029 ($ million)
- Chart on Software - Year-over-year growth 2024-2029 (%)
- Data Table on Software - Year-over-year growth 2024-2029 (%)
- 8.5 Market opportunity by Component
- Market opportunity by Component ($ million)
- Data Table on Market opportunity by Component ($ million)
9 Market Segmentation by End-user
- 9.1 Market segments
- Chart on End-user - Market share 2024-2029 (%)
- Data Table on End-user - Market share 2024-2029 (%)
- 9.2 Comparison by End-user
- Chart on Comparison by End-user
- Data Table on Comparison by End-user
- 9.3 Commercial - Market size and forecast 2024-2029
- Chart on Commercial - Market size and forecast 2024-2029 ($ million)
- Data Table on Commercial - Market size and forecast 2024-2029 ($ million)
- Chart on Commercial - Year-over-year growth 2024-2029 (%)
- Data Table on Commercial - Year-over-year growth 2024-2029 (%)
- 9.4 Residential - Market size and forecast 2024-2029
- Chart on Residential - Market size and forecast 2024-2029 ($ million)
- Data Table on Residential - Market size and forecast 2024-2029 ($ million)
- Chart on Residential - Year-over-year growth 2024-2029 (%)
- Data Table on Residential - Year-over-year growth 2024-2029 (%)
- 9.5 Market opportunity by End-user
- Market opportunity by End-user ($ million)
- Data Table on Market opportunity by End-user ($ million)
10 Market Segmentation by Type
- 10.1 Market segments
- Chart on Type - Market share 2024-2029 (%)
- Data Table on Type - Market share 2024-2029 (%)
- 10.2 Comparison by Type
- Chart on Comparison by Type
- Data Table on Comparison by Type
- 10.3 Racing - Market size and forecast 2024-2029
- Chart on Racing - Market size and forecast 2024-2029 ($ million)
- Data Table on Racing - Market size and forecast 2024-2029 ($ million)
- Chart on Racing - Year-over-year growth 2024-2029 (%)
- Data Table on Racing - Year-over-year growth 2024-2029 (%)
- 10.4 Shooting - Market size and forecast 2024-2029
- Chart on Shooting - Market size and forecast 2024-2029 ($ million)
- Data Table on Shooting - Market size and forecast 2024-2029 ($ million)
- Chart on Shooting - Year-over-year growth 2024-2029 (%)
- Data Table on Shooting - Year-over-year growth 2024-2029 (%)
- 10.5 Flight - Market size and forecast 2024-2029
- Chart on Flight - Market size and forecast 2024-2029 ($ million)
- Data Table on Flight - Market size and forecast 2024-2029 ($ million)
- Chart on Flight - Year-over-year growth 2024-2029 (%)
- Data Table on Flight - Year-over-year growth 2024-2029 (%)
- 10.6 Market opportunity by Type
- Market opportunity by Type ($ million)
- Data Table on Market opportunity by Type ($ million)
11 Market Segmentation by Variant
- 11.1 Market segments
- Chart on Variant - Market share 2024-2029 (%)
- Data Table on Variant - Market share 2024-2029 (%)
- 11.2 Comparison by Variant
- Chart on Comparison by Variant
- Data Table on Comparison by Variant
- 3-DOF - Market size and forecast 2024-2029
- Chart on 3-DOF - Market size and forecast 2024-2029 ($ million)
- Data Table on 3-DOF - Market size and forecast 2024-2029 ($ million)
- Chart on 3-DOF - Year-over-year growth 2024-2029 (%)
- Data Table on 3-DOF - Year-over-year growth 2024-2029 (%)
- 6-DOF - Market size and forecast 2024-2029
- Chart on 6-DOF - Market size and forecast 2024-2029 ($ million)
- Data Table on 6-DOF - Market size and forecast 2024-2029 ($ million)
- Chart on 6-DOF - Year-over-year growth 2024-2029 (%)
- Data Table on 6-DOF - Year-over-year growth 2024-2029 (%)
- 2-DOF - Market size and forecast 2024-2029
- Chart on 2-DOF - Market size and forecast 2024-2029 ($ million)
- Data Table on 2-DOF - Market size and forecast 2024-2029 ($ million)
- Chart on 2-DOF - Year-over-year growth 2024-2029 (%)
- Data Table on 2-DOF - Year-over-year growth 2024-2029 (%)
- 1-DOF - Market size and forecast 2024-2029
- Chart on 1-DOF - Market size and forecast 2024-2029 ($ million)
- Data Table on 1-DOF - Market size and forecast 2024-2029 ($ million)
- Chart on 1-DOF - Year-over-year growth 2024-2029 (%)
- Data Table on 1-DOF - Year-over-year growth 2024-2029 (%)
- 11.7 Market opportunity by Variant
- Market opportunity by Variant ($ million)
- Data Table on Market opportunity by Variant ($ million)
12 Customer Landscape
- 12.1 Customer landscape overview
- Analysis of price sensitivity, lifecycle, customer purchase basket, adoption rates, and purchase criteria
13 Geographic Landscape
- 13.1 Geographic segmentation
- Chart on Market share by geography 2024-2029 (%)
- Data Table on Market share by geography 2024-2029 (%)
- 13.2 Geographic comparison
- Chart on Geographic comparison
- Data Table on Geographic comparison
- 13.3 North America - Market size and forecast 2024-2029
- Chart on North America - Market size and forecast 2024-2029 ($ million)
- Data Table on North America - Market size and forecast 2024-2029 ($ million)
- Chart on North America - Year-over-year growth 2024-2029 (%)
- Data Table on North America - Year-over-year growth 2024-2029 (%)
- 13.4 Europe - Market size and forecast 2024-2029
- Chart on Europe - Market size and forecast 2024-2029 ($ million)
- Data Table on Europe - Market size and forecast 2024-2029 ($ million)
- Chart on Europe - Year-over-year growth 2024-2029 (%)
- Data Table on Europe - Year-over-year growth 2024-2029 (%)
- 13.5 APAC - Market size and forecast 2024-2029
- Chart on APAC - Market size and forecast 2024-2029 ($ million)
- Data Table on APAC - Market size and forecast 2024-2029 ($ million)
- Chart on APAC - Year-over-year growth 2024-2029 (%)
- Data Table on APAC - Year-over-year growth 2024-2029 (%)
- 13.6 South America - Market size and forecast 2024-2029
- Chart on South America - Market size and forecast 2024-2029 ($ million)
- Data Table on South America - Market size and forecast 2024-2029 ($ million)
- Chart on South America - Year-over-year growth 2024-2029 (%)
- Data Table on South America - Year-over-year growth 2024-2029 (%)
- 13.7 Middle East and Africa - Market size and forecast 2024-2029
- Chart on Middle East and Africa - Market size and forecast 2024-2029 ($ million)
- Data Table on Middle East and Africa - Market size and forecast 2024-2029 ($ million)
- Chart on Middle East and Africa - Year-over-year growth 2024-2029 (%)
- Data Table on Middle East and Africa - Year-over-year growth 2024-2029 (%)
- 13.8 US - Market size and forecast 2024-2029
- Chart on US - Market size and forecast 2024-2029 ($ million)
- Data Table on US - Market size and forecast 2024-2029 ($ million)
- Chart on US - Year-over-year growth 2024-2029 (%)
- Data Table on US - Year-over-year growth 2024-2029 (%)
- 13.9 Canada - Market size and forecast 2024-2029
- Chart on Canada - Market size and forecast 2024-2029 ($ million)
- Data Table on Canada - Market size and forecast 2024-2029 ($ million)
- Chart on Canada - Year-over-year growth 2024-2029 (%)
- Data Table on Canada - Year-over-year growth 2024-2029 (%)
- 13.10 UK - Market size and forecast 2024-2029
- Chart on UK - Market size and forecast 2024-2029 ($ million)
- Data Table on UK - Market size and forecast 2024-2029 ($ million)
- Chart on UK - Year-over-year growth 2024-2029 (%)
- Data Table on UK - Year-over-year growth 2024-2029 (%)
- 13.11 China - Market size and forecast 2024-2029
- Chart on China - Market size and forecast 2024-2029 ($ million)
- Data Table on China - Market size and forecast 2024-2029 ($ million)
- Chart on China - Year-over-year growth 2024-2029 (%)
- Data Table on China - Year-over-year growth 2024-2029 (%)
- 13.12 Germany - Market size and forecast 2024-2029
- Chart on Germany - Market size and forecast 2024-2029 ($ million)
- Data Table on Germany - Market size and forecast 2024-2029 ($ million)
- Chart on Germany - Year-over-year growth 2024-2029 (%)
- Data Table on Germany - Year-over-year growth 2024-2029 (%)
- 13.13 France - Market size and forecast 2024-2029
- Chart on France - Market size and forecast 2024-2029 ($ million)
- Data Table on France - Market size and forecast 2024-2029 ($ million)
- Chart on France - Year-over-year growth 2024-2029 (%)
- Data Table on France - Year-over-year growth 2024-2029 (%)
- 13.14 Japan - Market size and forecast 2024-2029
- Chart on Japan - Market size and forecast 2024-2029 ($ million)
- Data Table on Japan - Market size and forecast 2024-2029 ($ million)
- Chart on Japan - Year-over-year growth 2024-2029 (%)
- Data Table on Japan - Year-over-year growth 2024-2029 (%)
- 13.15 Italy - Market size and forecast 2024-2029
- Chart on Italy - Market size and forecast 2024-2029 ($ million)
- Data Table on Italy - Market size and forecast 2024-2029 ($ million)
- Chart on Italy - Year-over-year growth 2024-2029 (%)
- Data Table on Italy - Year-over-year growth 2024-2029 (%)
- 13.16 India - Market size and forecast 2024-2029
- Chart on India - Market size and forecast 2024-2029 ($ million)
- Data Table on India - Market size and forecast 2024-2029 ($ million)
- Chart on India - Year-over-year growth 2024-2029 (%)
- Data Table on India - Year-over-year growth 2024-2029 (%)
- 13.17 The Netherlands - Market size and forecast 2024-2029
- Chart on The Netherlands - Market size and forecast 2024-2029 ($ million)
- Data Table on The Netherlands - Market size and forecast 2024-2029 ($ million)
- Chart on The Netherlands - Year-over-year growth 2024-2029 (%)
- Data Table on The Netherlands - Year-over-year growth 2024-2029 (%)
- 13.18 Market opportunity by geography
- Market opportunity by geography ($ million)
- Data Tables on Market opportunity by geography ($ million)
14 Drivers, Challenges, and Opportunity/Restraints
- 14.3 Impact of drivers and challenges
- Impact of drivers and challenges in 2024 and 2029
- 14.4 Market opportunities/restraints
15 Competitive Landscape
- 15.2 Competitive Landscape
- Overview on criticality of inputs and factors of differentiation
- 15.3 Landscape disruption
- Overview on factors of disruption
- 15.4 Industry risks
- Impact of key risks on business
16 Competitive Analysis
- 16.2 Company ranking index
- 16.3 Market positioning of companies
- Matrix on companies position and classification
- 3D perception AS
- 3D perception AS - Overview
- 3D perception AS - Product / Service
- 3D perception AS - Key offerings
- SWOT
- 16.5 Adacel Technologies Ltd.
- Adacel Technologies Ltd. - Overview
- Adacel Technologies Ltd. - Business segments
- Adacel Technologies Ltd. - Key offerings
- Adacel Technologies Ltd. - Segment focus
- SWOT
- 16.6 Aero Simulation Inc.
- Aero Simulation Inc. - Overview
- Aero Simulation Inc. - Product / Service
- Aero Simulation Inc. - Key offerings
- SWOT
- 16.7 BLUEHALO LLC
- BLUEHALO LLC - Overview
- BLUEHALO LLC - Product / Service
- BLUEHALO LLC - Key offerings
- SWOT
- 16.8 CKAS Mechatronics Pty Ltd
- CKAS Mechatronics Pty Ltd - Overview
- CKAS Mechatronics Pty Ltd - Product / Service
- CKAS Mechatronics Pty Ltd - Key offerings
- SWOT
- 16.9 Cruden
- Cruden - Overview
- Cruden - Product / Service
- Cruden - Key offerings
- SWOT
- 16.10 CXC Simulations
- CXC Simulations - Overview
- CXC Simulations - Product / Service
- CXC Simulations - Key offerings
- SWOT
- 16.11 D BOX Technologies Inc.
- D BOX Technologies Inc. - Overview
- D BOX Technologies Inc. - Product / Service
- D BOX Technologies Inc. - Key offerings
- SWOT
- 16.12 Eleetus LLC
- Eleetus LLC - Overview
- Eleetus LLC - Product / Service
- Eleetus LLC - Key offerings
- SWOT
- 16.13 GTR Simulators
- GTR Simulators - Overview
- GTR Simulators - Product / Service
- GTR Simulators - Key offerings
- SWOT
- 16.14 Guillemot Corp. SA
- Guillemot Corp. SA - Overview
- Guillemot Corp. SA - Business segments
- Guillemot Corp. SA - Key offerings
- Guillemot Corp. SA - Segment focus
- SWOT
- 16.15 Hammacher Schlemmer and Co. Inc.
- Hammacher Schlemmer and Co. Inc. - Overview
- Hammacher Schlemmer and Co. Inc. - Product / Service
- Hammacher Schlemmer and Co. Inc. - Key offerings
- SWOT
- 16.16 Playseat BV
- Playseat BV - Overview
- Playseat BV - Product / Service
- Playseat BV - Key offerings
- SWOT
- 16.17 RSEAT Ltd.
- RSEAT Ltd. - Overview
- RSEAT Ltd. - Product / Service
- RSEAT Ltd. - Key offerings
- SWOT
- 16.18 Vesaro Ltd.
- Vesaro Ltd. - Overview
- Vesaro Ltd. - Product / Service
- Vesaro Ltd. - Key offerings
- SWOT
17 Appendix
- 17.2 Inclusions and exclusions checklist
- Inclusions checklist
- Exclusions checklist
- 17.3 Currency conversion rates for US$
- Currency conversion rates for US$
- 17.4 Research methodology
- 17.7 Validation techniques employed for market sizing
- Validation techniques employed for market sizing
- 17.9 360 degree market analysis
- 360 degree market analysis
- 17.10 List of abbreviations