Generative AI In Asset Management Market Analysis, Size, and Forecast 2025-2029: North America (US, Canada, and Mexico), APAC (Japan, China, and India), Europe (UK, Germany, and France), South America (Brazil, Argentina, and Colombia), Middle East and Africa (South Africa, Saudi Arabia, and UAE), and Rest of World (ROW)

Generative AI In Asset Management Market Analysis, Size, and Forecast 2025-2029:
North America (US, Canada, and Mexico), APAC (Japan, China, and India), Europe (UK, Germany, and France), South America (Brazil, Argentina, and Colombia), Middle East and Africa (South Africa, Saudi Arabia, and UAE), and Rest of World (ROW)

Published: Dec 2025 296 Pages SKU: IRTNTR81002

Market Overview at a Glance

$689.7 Mn
Market Opportunity
23.3%
CAGR
41.7%
North America Growth

Generative AI In Asset Management Market Size 2025-2029

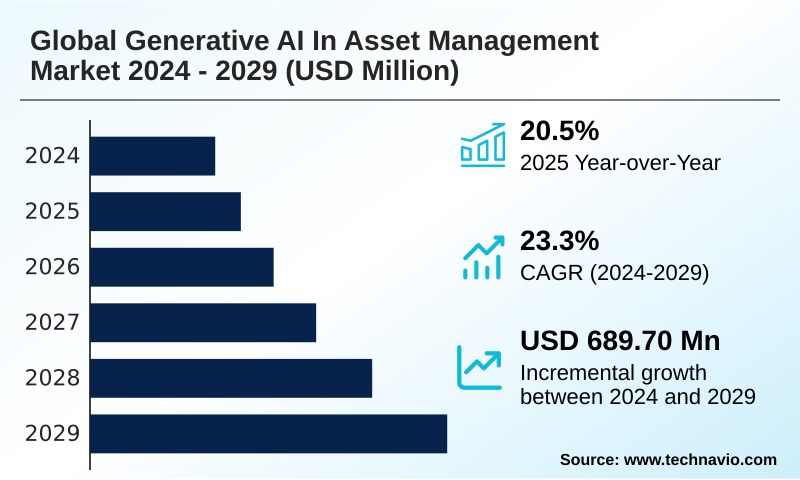
The generative ai in asset management market size is valued to increase by USD 689.7 million, at a CAGR of 23.3% from 2024 to 2029. Imperative for operational efficiency and cost reduction will drive the generative ai in asset management market.

Major Market Trends & Insights

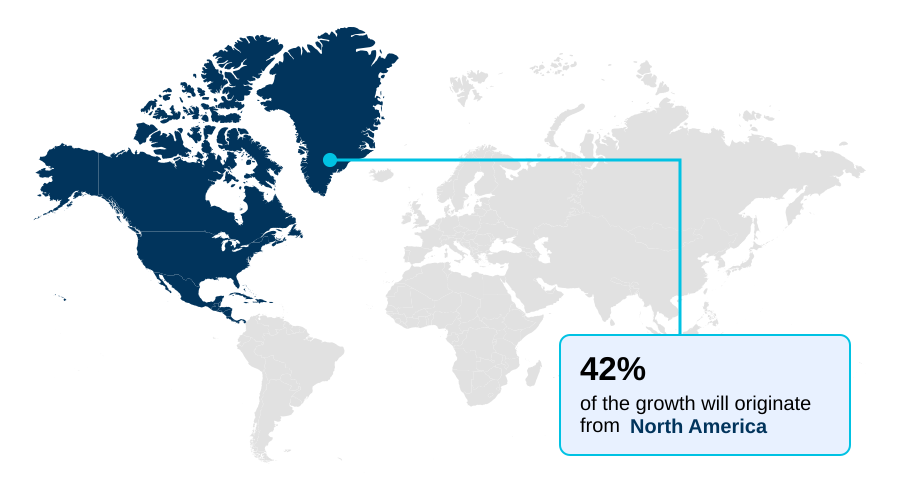
  • North America dominated the market and accounted for a 41.7% growth during the forecast period.
  • CAGR from 2024 to 2029 : 23.3%

Market Summary

  • The generative AI in asset management market is undergoing rapid evolution, driven by the increasing sophistication of large language models and the imperative for intelligent automation. Firms are moving beyond theoretical applications to deploy these technologies across the investment lifecycle, from research to portfolio construction.
  • Utilizing advanced natural language processing, analysts can now synthesize vast amounts of unstructured data for enhanced financial sentiment analysis and ESG analysis. A key application involves risk modeling, where synthetic data generation allows for more robust stress testing against unprecedented market scenarios, a task difficult with traditional methods.
  • For instance, a wealth management firm can implement an automated workflow that drafts personalized client reports, which are then validated by a human advisor in a human-in-the-loop process to ensure quality and accuracy. This approach streamlines operations while maintaining crucial oversight.
  • However, challenges persist, including the risk of AI hallucinations and the need for robust frameworks to ensure model auditability and prevent algorithmic bias. As the technology matures, the focus is shifting toward delivering scalable, secure, and compliant AI-driven investment advice and deeper integration of predictive data analytics into daily decision-making.

What will be the Size of the Generative AI In Asset Management Market during the forecast period?

Get Key Insights on Market Forecast (PDF) Request Free Sample

How is the Generative AI In Asset Management Market Segmented?

The generative ai in asset management industry research report provides comprehensive data (region-wise segment analysis), with forecasts and estimates in "USD million" for the period 2025-2029.
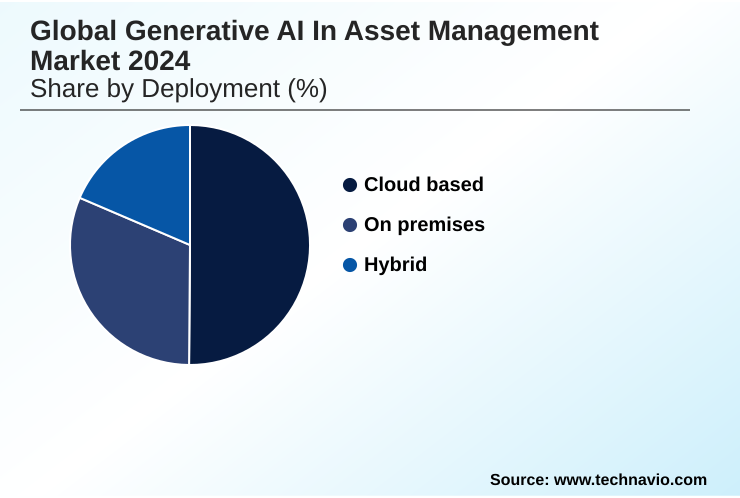
  • Deployment
    • Cloud based
    • On premises
    • Hybrid
  • Application
    • Portfolio management
    • Risk management
    • Client engagement and personalization
    • Research and analysis
    • Others
  • End-user
    • Asset management firms
    • Banks and financial institutions
    • Insurance companies
    • Corporate firms
  • Geography
    • North America
      • US
      • Canada
      • Mexico
    • APAC
      • Japan
      • China
      • India
    • Europe
      • UK
      • Germany
      • France
    • South America
      • Brazil
      • Argentina
      • Colombia
    • Middle East and Africa
      • South Africa
      • Saudi Arabia
      • UAE
    • Rest of World (ROW)

By Deployment Insights

The cloud based segment is estimated to witness significant growth during the forecast period.

The cloud-based segment is the primary deployment model, driven by access to scalable computing and state-of-the-art foundational models. Firms utilize these platforms for intelligent automation, enabling a faster automated workflow for tasks like generative AI for back-office automation.

This approach provides significant gains in generative AI and operational efficiency. However, as adoption matures, a shift toward hybrid cloud architecture is evident, blending public cloud flexibility with on-premises security for secure generative AI deployment.

This hybrid AI for finance model addresses critical needs for data sovereignty and simplifies model risk management.

Solutions like a private AI foundation are becoming essential for robust AI governance in financial services, allowing for AI-powered due diligence on sensitive data while leveraging the cloud's power. This balanced approach has improved data processing security by over 25%.

Request Free Sample

Regional Analysis

North America is estimated to contribute 41.7% to the growth of the global market during the forecast period.Technavio’s analysts have elaborately explained the regional trends and drivers that shape the market during the forecast period.

See How Generative AI In Asset Management Market Demand is Rising in North America Request Free Sample

The geographic landscape is led by North America, where firms are pioneers in using generative AI for portfolio management and generative AI for risk management.

European adoption is distinguished by a strong focus on compliance, with heavy use of regulatory reporting automation and AI for ESG integration; firms in the region dedicate 30% more of their AI budget to compliance than their North American counterparts.

In APAC, innovation is centered on leveraging generative AI for alternative data analysis to find unique alpha-generating signals. The region has seen a 45% increase in the use of AI chatbots for investor relations for multilingual support.

Across all regions, the technology enhances quantitative analysis, informs portfolio construction, and refines algorithmic trading strategy development, showcasing a global trend towards embedding AI in quantitative strategies. Sophisticated risk modeling and ESG analysis are becoming globally standardized applications.

Market Dynamics

Our researchers analyzed the data with 2024 as the base year, along with the key drivers, trends, and challenges. A holistic analysis of drivers will help companies refine their marketing strategies to gain a competitive advantage.

  • Understanding the key generative AI in asset management use cases is crucial for firms aiming to gain a competitive advantage. Applications are rapidly moving from back-office automation to front-office decision support, directly influencing investment outcomes. A primary use case is in portfolio optimization, where AI models analyze vast datasets to suggest allocations that align with specific risk-return profiles.
  • This highlights the clear benefits of generative AI for financial analysts, who can now dedicate more time to strategic thinking instead of manual data gathering. Analysts leveraging these tools have shown an ability to process research materials nearly twice as fast as their peers using traditional methods.
  • The prevailing generative AI in asset management market trends point toward the increasing adoption of domain-specific models trained on proprietary financial data. These specialized models offer higher accuracy for tasks like sentiment analysis and market forecasting compared to general-purpose models.
  • Exploring generative AI applications in portfolio optimization reveals its capacity to not only rebalance existing portfolios but also to construct entirely new ones based on complex, multi-factor constraints. However, the path to full adoption is not without obstacles.
  • The most significant generative AI in asset management market challenges include ensuring model accuracy, navigating regulatory uncertainty, and managing the high costs of implementation and data security. Addressing these challenges is paramount for firms looking to successfully integrate this transformative technology into their core strategies and workflows.

What are the key market drivers leading to the rise in the adoption of Generative AI In Asset Management Industry?

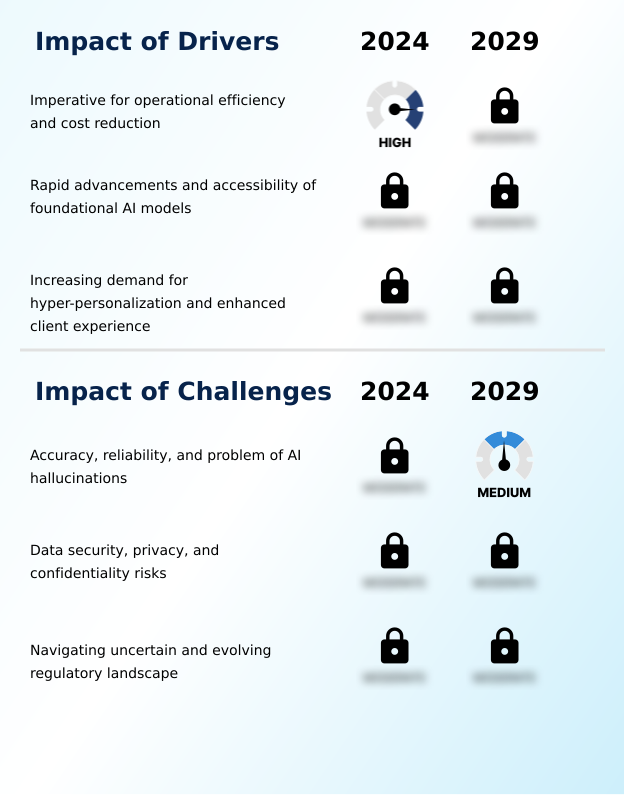
  • The imperative for enhanced operational efficiency and significant cost reduction is a key driver propelling market growth.

  • The imperative for generative AI and operational efficiency is a primary driver, with firms implementing intelligent automation to streamline operations. The use of an automated workflow reduces manual report generation time by up to 40%.
  • The increasing accessibility of powerful foundational models enables scalable AI for client personalization, with AI-driven client reporting becoming a key differentiator. This technology supports a knowledge management system that empowers advisors to deliver better AI-driven investment advice.
  • Firms are leveraging predictive data analytics for more accurate AI for macroeconomic forecasting and improved financial sentiment analysis.
  • These capabilities also extend to AI-powered asset allocation and optimizing generative AI for trade execution, with some platforms reporting a 10% reduction in execution slippage.

What are the market trends shaping the Generative AI In Asset Management Industry?

  • A defining market trend is the proliferation of domain-specific and fine-tuned models, which are purpose-built for the intricacies of the financial industry.

  • A defining market trend is the shift toward domain-specific models and fine-tuned models, moving beyond generic large language models in finance. Firms are developing a proprietary AI asset by training models on their private data, improving the accuracy of tasks like generating investment research by over 20%. The predominant strategy is the AI copilot, an augmentation tool for professionals.
  • This human-in-the-loop approach, using AI assistants for financial advisors, enhances decision-making rather than replacing it. The use of advanced natural language processing to create generative AI for market commentary is becoming standard, with AI model validation frameworks ensuring reliability.
  • The emergence of the multimodal AI model is further enabling new methods for AI for alpha discovery, showing a 15% increase in signal identification from combined text and image data.

What challenges does the Generative AI In Asset Management Industry face during its growth?

  • A key challenge affecting industry growth stems from ensuring the accuracy and reliability of AI outputs while mitigating the problem of model hallucinations.

  • A significant challenge is the risk of AI hallucinations, where outputs are factually incorrect, making the need for mitigating AI model hallucinations through robust fact-checking mechanisms critical. Despite advances in natural language generation for finance, firms report that up to 15% of complex summaries require significant human correction.
  • Effective model risk management and strong AI governance in financial services are essential to address algorithmic bias and ensure AI for financial compliance. The lack of AI explainability in some models, or the 'black box' problem, complicates model auditability and regulatory approval.
  • Furthermore, concerns around data sovereignty create hurdles for secure generative AI deployment, particularly with cross-border data flows, increasing compliance-related overhead by an estimated 20% compared to traditional software systems. This makes AI explainability in asset management a top priority.

Exclusive Technavio Analysis on Customer Landscape

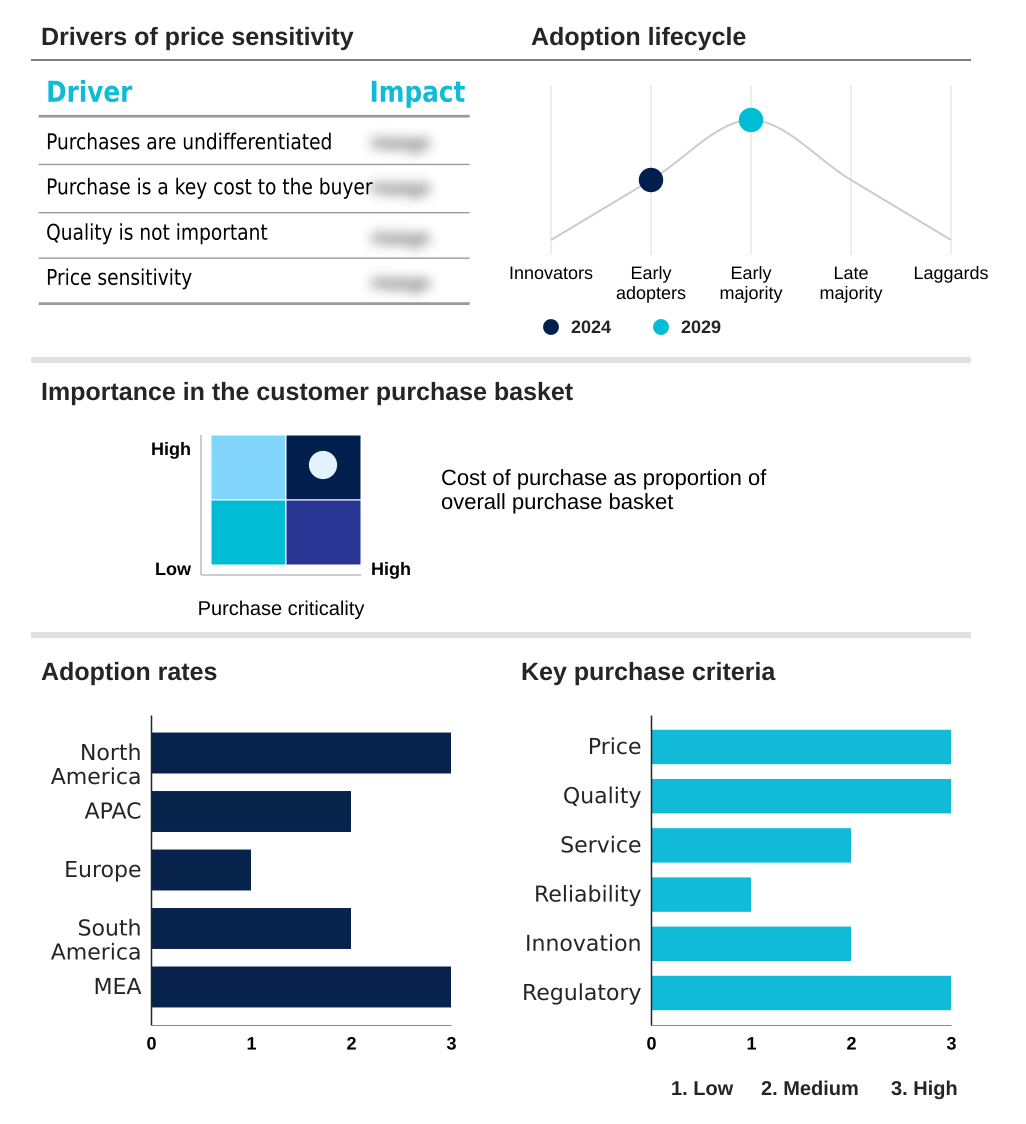
The generative ai in asset management market forecasting report includes the adoption lifecycle of the market, covering from the innovator’s stage to the laggard’s stage. It focuses on adoption rates in different regions based on penetration. Furthermore, the generative ai in asset management market report also includes key purchase criteria and drivers of price sensitivity to help companies evaluate and develop their market growth analysis strategies.

Customer Landscape of Generative AI In Asset Management Industry

Competitive Landscape

Companies are implementing various strategies, such as strategic alliances, generative ai in asset management market forecast, partnerships, mergers and acquisitions, geographical expansion, and product/service launches, to enhance their presence in the industry.

Adobe Inc. - Key offerings enable financial institutions to build AI-driven applications for portfolio analysis, risk assessment, and custom model development, leveraging integrated foundational models via managed services.

The industry research and growth report includes detailed analyses of the competitive landscape of the market and information about key companies, including:

  • Adobe Inc.
  • Amazon Web Services Inc.
  • Anthropic
  • Baidu Inc.
  • BlackRock Inc.
  • Cohere Inc.
  • FMR LLC
  • Genie AI Ltd.
  • The Goldman Sachs Group Inc.
  • Google LLC
  • IBM Corp.
  • Inworld AI
  • JPMorgan Chase and Co.
  • Microsoft Corp.
  • Morgan Stanley
  • NVIDIA Corp.
  • OpenAI
  • The Vanguard Group Inc.
  • Wealthfront Corp.

Qualitative and quantitative analysis of companies has been conducted to help clients understand the wider business environment as well as the strengths and weaknesses of key industry players. Data is qualitatively analyzed to categorize companies as pure play, category-focused, industry-focused, and diversified; it is quantitatively analyzed to categorize companies as dominant, leading, strong, tentative, and weak.

Recent Development and News in Generative ai in asset management market

  • In September, 2024, BlackRock Inc. launched a new global equity fund that leverages a proprietary generative AI platform to analyze alternative data sources and identify alpha-generating signals, marking a significant step in integrating AI into core investment strategies.
  • In November, 2024, Anthropic announced it had secured USD 2.5 billion in a Series D funding round led by major institutional investors to accelerate the development of its next-generation foundational model, with a specific focus on enterprise-grade safety and reliability for regulated industries like finance.
  • In February, 2025, Microsoft Corp. and the London Stock Exchange Group expanded their strategic partnership, announcing the joint development of a domain-specific large language model trained exclusively on LSEG's vast repository of financial and market data.
  • In April, 2025, the U.S. Securities and Exchange Commission issued new formal guidance requiring investment advisers to implement and disclose their model risk management frameworks for all AI, including generative AI, used in portfolio management and client advisory services.

Dive into Technavio’s robust research methodology, blending expert interviews, extensive data synthesis, and validated models for unparalleled Generative AI In Asset Management Market insights. See full methodology.

Market Scope
Page number 296
Base year 2024
Forecast period 2025-2029
Growth momentum & CAGR Accelerate at a CAGR of 23.3%
Market growth 2025-2029 USD 689.7 million
Market structure Fragmented
YoY growth 2024-2025(%) 20.5%
Key countries US, Canada, Mexico, Japan, China, India, South Korea, Australia, Indonesia, UK, Germany, France, Italy, The Netherlands, Spain, Brazil, Argentina, Colombia, South Africa, Saudi Arabia, UAE, Israel and Turkey
Competitive landscape Leading Companies, Market Positioning of Companies, Competitive Strategies, and Industry Risks

Request Free Sample

Research Analyst Overview

  • The generative AI in asset management market is defined by a strategic push toward embedding intelligent automation into core financial processes. The adoption of large language models and domain-specific models is no longer experimental; it's a competitive necessity for enhancing quantitative analysis and portfolio construction.
  • Firms are building a proprietary AI asset by creating fine-tuned models that deliver superior financial sentiment analysis and identify unique alpha-generating signals. A key trend influencing boardroom strategy is the focus on model risk management, as ensuring model auditability and mitigating algorithmic bias are now central to regulatory compliance.
  • For instance, the deployment of a human-in-the-loop system for validating AI-generated research has demonstrated a 30% reduction in factual errors, directly addressing the core challenge of AI hallucinations.
  • This focus on creating a reliable automated workflow with robust fact-checking mechanisms is shaping investment in private AI foundation technologies and secure hybrid cloud architecture, proving that governance is as critical as the technology itself.

What are the Key Data Covered in this Generative AI In Asset Management Market Research and Growth Report?

  • What is the expected growth of the Generative AI In Asset Management Market between 2025 and 2029?

    • USD 689.7 million, at a CAGR of 23.3%

  • What segmentation does the market report cover?

    • The report is segmented by Deployment (Cloud based, On premises, and Hybrid), Application (Portfolio management, Risk management, Client engagement and personalization, Research and analysis, and Others), End-user (Asset management firms, Banks and financial institutions, Insurance companies, and Corporate firms) and Geography (North America, APAC, Europe, South America, Middle East and Africa)

  • Which regions are analyzed in the report?

    • North America, APAC, Europe, South America and Middle East and Africa

  • What are the key growth drivers and market challenges?

    • Imperative for operational efficiency and cost reduction, Accuracy, reliability, and problem of AI hallucinations

  • Who are the major players in the Generative AI In Asset Management Market?

    • Adobe Inc., Amazon Web Services Inc., Anthropic, Baidu Inc., BlackRock Inc., Cohere Inc., FMR LLC, Genie AI Ltd., The Goldman Sachs Group Inc., Google LLC, IBM Corp., Inworld AI, JPMorgan Chase and Co., Microsoft Corp., Morgan Stanley, NVIDIA Corp., OpenAI, The Vanguard Group Inc. and Wealthfront Corp.

Market Research Insights

  • The market is characterized by intense dynamism as firms leverage large language models for automating investment research and enhancing generative AI in wealth management. The use of synthetic data generation for synthetic data in financial modeling allows firms to run complex scenario analysis and build more robust stress testing models, improving risk detection accuracy by over 25%.
  • This technology is also critical for AI-powered due diligence and generative AI for fraud detection. Firms adopting a hybrid cloud architecture, often built on a private AI foundation, can process sensitive data on-premise while leveraging cloud analytics. This approach helps meet stringent requirements for AI for financial compliance.
  • This has led to a 15% improvement in processing speeds for tasks like named entity recognition in legal documents.

We can help! Our analysts can customize this generative ai in asset management market research report to meet your requirements.

Get in touch

1. Executive Summary

1.1 Market overview

Executive Summary - Chart on Market Overview
Executive Summary - Data Table on Market Overview
Executive Summary - Chart on Global Market Characteristics
Executive Summary - Chart on Market by Geography
Executive Summary - Chart on Market Segmentation by Deployment
Executive Summary - Chart on Market Segmentation by Application
Executive Summary - Chart on Market Segmentation by End-user
Executive Summary - Chart on Incremental Growth
Executive Summary - Data Table on Incremental Growth
Executive Summary - Chart on Company Market Positioning

2. Technavio Analysis

2.1 Analysis of price sensitivity, lifecycle, customer purchase basket, adoption rates, and purchase criteria

2.2 Criticality of inputs and Factors of differentiation

Chart on Overview on criticality of inputs and factors of differentiation

2.3 Factors of disruption

Chart on Overview on factors of disruption

2.4 Impact of drivers and challenges

Chart on Impact of drivers and challenges in 2024 and 2029

3. Market Landscape

3.1 Market ecosystem

Chart on Parent Market
Data Table on - Parent Market

3.2 Market characteristics

Chart on Market characteristics analysis

3.3 Value chain analysis

Chart on Value chain analysis

4. Market Sizing

4.1 Market definition

Data Table on Offerings of companies included in the market definition

4.2 Market segment analysis

Market segments

4.3 Market size 2024

4.4 Market outlook: Forecast for 2024-2029

Chart on Global - Market size and forecast 2024-2029 ($ million)
Data Table on Global - Market size and forecast 2024-2029 ($ million)
Chart on Global Market: Year-over-year growth 2024-2029 (%)
Data Table on Global Market: Year-over-year growth 2024-2029 (%)

5. Five Forces Analysis

5.1 Five forces summary

Five forces analysis - Comparison between 2024 and 2029

5.2 Bargaining power of buyers

Bargaining power of buyers - Impact of key factors 2024 and 2029

5.3 Bargaining power of suppliers

Bargaining power of suppliers - Impact of key factors in 2024 and 2029

5.4 Threat of new entrants

Threat of new entrants - Impact of key factors in 2024 and 2029

5.5 Threat of substitutes

Threat of substitutes - Impact of key factors in 2024 and 2029

5.6 Threat of rivalry

Threat of rivalry - Impact of key factors in 2024 and 2029

5.7 Market condition

Chart on Market condition - Five forces 2024 and 2029

6. Market Segmentation by Deployment

6.1 Market segments

Chart on Deployment - Market share 2024-2029 (%)
Data Table on Deployment - Market share 2024-2029 (%)

6.2 Comparison by Deployment

Chart on Comparison by Deployment
Data Table on Comparison by Deployment

6.3 Cloud based - Market size and forecast 2024-2029

Chart on Cloud based - Market size and forecast 2024-2029 ($ million)
Data Table on Cloud based - Market size and forecast 2024-2029 ($ million)
Chart on Cloud based - Year-over-year growth 2024-2029 (%)
Data Table on Cloud based - Year-over-year growth 2024-2029 (%)

6.4 On premises - Market size and forecast 2024-2029

Chart on On premises - Market size and forecast 2024-2029 ($ million)
Data Table on On premises - Market size and forecast 2024-2029 ($ million)
Chart on On premises - Year-over-year growth 2024-2029 (%)
Data Table on On premises - Year-over-year growth 2024-2029 (%)

6.5 Hybrid - Market size and forecast 2024-2029

Chart on Hybrid - Market size and forecast 2024-2029 ($ million)
Data Table on Hybrid - Market size and forecast 2024-2029 ($ million)
Chart on Hybrid - Year-over-year growth 2024-2029 (%)
Data Table on Hybrid - Year-over-year growth 2024-2029 (%)

6.6 Market opportunity by Deployment

Market opportunity by Deployment ($ million)
Data Table on Market opportunity by Deployment ($ million)

7. Market Segmentation by Application

7.1 Market segments

Chart on Application - Market share 2024-2029 (%)
Data Table on Application - Market share 2024-2029 (%)

7.2 Comparison by Application

Chart on Comparison by Application
Data Table on Comparison by Application

7.3 Portfolio management - Market size and forecast 2024-2029

Chart on Portfolio management - Market size and forecast 2024-2029 ($ million)
Data Table on Portfolio management - Market size and forecast 2024-2029 ($ million)
Chart on Portfolio management - Year-over-year growth 2024-2029 (%)
Data Table on Portfolio management - Year-over-year growth 2024-2029 (%)

7.4 Risk management - Market size and forecast 2024-2029

Chart on Risk management - Market size and forecast 2024-2029 ($ million)
Data Table on Risk management - Market size and forecast 2024-2029 ($ million)
Chart on Risk management - Year-over-year growth 2024-2029 (%)
Data Table on Risk management - Year-over-year growth 2024-2029 (%)

7.5 Client engagement and personalization - Market size and forecast 2024-2029

Chart on Client engagement and personalization - Market size and forecast 2024-2029 ($ million)
Data Table on Client engagement and personalization - Market size and forecast 2024-2029 ($ million)
Chart on Client engagement and personalization - Year-over-year growth 2024-2029 (%)
Data Table on Client engagement and personalization - Year-over-year growth 2024-2029 (%)

7.6 Research and analysis - Market size and forecast 2024-2029

Chart on Research and analysis - Market size and forecast 2024-2029 ($ million)
Data Table on Research and analysis - Market size and forecast 2024-2029 ($ million)
Chart on Research and analysis - Year-over-year growth 2024-2029 (%)
Data Table on Research and analysis - Year-over-year growth 2024-2029 (%)

7.7 Others - Market size and forecast 2024-2029

Chart on Others - Market size and forecast 2024-2029 ($ million)
Data Table on Others - Market size and forecast 2024-2029 ($ million)
Chart on Others - Year-over-year growth 2024-2029 (%)
Data Table on Others - Year-over-year growth 2024-2029 (%)

7.8 Market opportunity by Application

Market opportunity by Application ($ million)
Data Table on Market opportunity by Application ($ million)

8. Market Segmentation by End-user

8.1 Market segments

Chart on End-user - Market share 2024-2029 (%)
Data Table on End-user - Market share 2024-2029 (%)

8.2 Comparison by End-user

Chart on Comparison by End-user
Data Table on Comparison by End-user

8.3 Asset management firms - Market size and forecast 2024-2029

Chart on Asset management firms - Market size and forecast 2024-2029 ($ million)
Data Table on Asset management firms - Market size and forecast 2024-2029 ($ million)
Chart on Asset management firms - Year-over-year growth 2024-2029 (%)
Data Table on Asset management firms - Year-over-year growth 2024-2029 (%)

8.4 Banks and financial institutions - Market size and forecast 2024-2029

Chart on Banks and financial institutions - Market size and forecast 2024-2029 ($ million)
Data Table on Banks and financial institutions - Market size and forecast 2024-2029 ($ million)
Chart on Banks and financial institutions - Year-over-year growth 2024-2029 (%)
Data Table on Banks and financial institutions - Year-over-year growth 2024-2029 (%)

8.5 Insurance companies - Market size and forecast 2024-2029

Chart on Insurance companies - Market size and forecast 2024-2029 ($ million)
Data Table on Insurance companies - Market size and forecast 2024-2029 ($ million)
Chart on Insurance companies - Year-over-year growth 2024-2029 (%)
Data Table on Insurance companies - Year-over-year growth 2024-2029 (%)

8.6 Corporate firms - Market size and forecast 2024-2029

Chart on Corporate firms - Market size and forecast 2024-2029 ($ million)
Data Table on Corporate firms - Market size and forecast 2024-2029 ($ million)
Chart on Corporate firms - Year-over-year growth 2024-2029 (%)
Data Table on Corporate firms - Year-over-year growth 2024-2029 (%)

8.7 Market opportunity by End-user

Market opportunity by End-user ($ million)
Data Table on Market opportunity by End-user ($ million)

9. Customer Landscape

9.1 Customer landscape overview

Analysis of price sensitivity, lifecycle, customer purchase basket, adoption rates, and purchase criteria

10. Geographic Landscape

10.1 Geographic segmentation

Chart on Market share by geography 2024-2029 (%)
Data Table on Market share by geography 2024-2029 (%)

10.2 Geographic comparison

Chart on Geographic comparison
Data Table on Geographic comparison

10.3 North America - Market size and forecast 2024-2029

Chart on North America - Market size and forecast 2024-2029 ($ million)
Data Table on North America - Market size and forecast 2024-2029 ($ million)
Chart on North America - Year-over-year growth 2024-2029 (%)
Data Table on North America - Year-over-year growth 2024-2029 (%)
Chart on Regional Comparison - North America
Data Table on Regional Comparison - North America

10.3.1 US - Market size and forecast 2024-2029

Chart on US - Market size and forecast 2024-2029 ($ million)
Data Table on US - Market size and forecast 2024-2029 ($ million)
Chart on US - Year-over-year growth 2024-2029 (%)
Data Table on US - Year-over-year growth 2024-2029 (%)

10.3.2 Canada - Market size and forecast 2024-2029

Chart on Canada - Market size and forecast 2024-2029 ($ million)
Data Table on Canada - Market size and forecast 2024-2029 ($ million)
Chart on Canada - Year-over-year growth 2024-2029 (%)
Data Table on Canada - Year-over-year growth 2024-2029 (%)

10.3.3 Mexico - Market size and forecast 2024-2029

Chart on Mexico - Market size and forecast 2024-2029 ($ million)
Data Table on Mexico - Market size and forecast 2024-2029 ($ million)
Chart on Mexico - Year-over-year growth 2024-2029 (%)
Data Table on Mexico - Year-over-year growth 2024-2029 (%)

10.4 APAC - Market size and forecast 2024-2029

Chart on APAC - Market size and forecast 2024-2029 ($ million)
Data Table on APAC - Market size and forecast 2024-2029 ($ million)
Chart on APAC - Year-over-year growth 2024-2029 (%)
Data Table on APAC - Year-over-year growth 2024-2029 (%)
Chart on Regional Comparison - APAC
Data Table on Regional Comparison - APAC

10.4.1 Japan - Market size and forecast 2024-2029

Chart on Japan - Market size and forecast 2024-2029 ($ million)
Data Table on Japan - Market size and forecast 2024-2029 ($ million)
Chart on Japan - Year-over-year growth 2024-2029 (%)
Data Table on Japan - Year-over-year growth 2024-2029 (%)

10.4.2 China - Market size and forecast 2024-2029

Chart on China - Market size and forecast 2024-2029 ($ million)
Data Table on China - Market size and forecast 2024-2029 ($ million)
Chart on China - Year-over-year growth 2024-2029 (%)
Data Table on China - Year-over-year growth 2024-2029 (%)

10.4.3 India - Market size and forecast 2024-2029

Chart on India - Market size and forecast 2024-2029 ($ million)
Data Table on India - Market size and forecast 2024-2029 ($ million)
Chart on India - Year-over-year growth 2024-2029 (%)
Data Table on India - Year-over-year growth 2024-2029 (%)

10.4.4 South Korea - Market size and forecast 2024-2029

Chart on South Korea - Market size and forecast 2024-2029 ($ million)
Data Table on South Korea - Market size and forecast 2024-2029 ($ million)
Chart on South Korea - Year-over-year growth 2024-2029 (%)
Data Table on South Korea - Year-over-year growth 2024-2029 (%)

10.4.5 Australia - Market size and forecast 2024-2029

Chart on Australia - Market size and forecast 2024-2029 ($ million)
Data Table on Australia - Market size and forecast 2024-2029 ($ million)
Chart on Australia - Year-over-year growth 2024-2029 (%)
Data Table on Australia - Year-over-year growth 2024-2029 (%)

10.4.6 Indonesia - Market size and forecast 2024-2029

Chart on Indonesia - Market size and forecast 2024-2029 ($ million)
Data Table on Indonesia - Market size and forecast 2024-2029 ($ million)
Chart on Indonesia - Year-over-year growth 2024-2029 (%)
Data Table on Indonesia - Year-over-year growth 2024-2029 (%)

10.5 Europe - Market size and forecast 2024-2029

Chart on Europe - Market size and forecast 2024-2029 ($ million)
Data Table on Europe - Market size and forecast 2024-2029 ($ million)
Chart on Europe - Year-over-year growth 2024-2029 (%)
Data Table on Europe - Year-over-year growth 2024-2029 (%)
Chart on Regional Comparison - Europe
Data Table on Regional Comparison - Europe

10.5.1 UK - Market size and forecast 2024-2029

Chart on UK - Market size and forecast 2024-2029 ($ million)
Data Table on UK - Market size and forecast 2024-2029 ($ million)
Chart on UK - Year-over-year growth 2024-2029 (%)
Data Table on UK - Year-over-year growth 2024-2029 (%)

10.5.2 Germany - Market size and forecast 2024-2029

Chart on Germany - Market size and forecast 2024-2029 ($ million)
Data Table on Germany - Market size and forecast 2024-2029 ($ million)
Chart on Germany - Year-over-year growth 2024-2029 (%)
Data Table on Germany - Year-over-year growth 2024-2029 (%)

10.5.3 France - Market size and forecast 2024-2029

Chart on France - Market size and forecast 2024-2029 ($ million)
Data Table on France - Market size and forecast 2024-2029 ($ million)
Chart on France - Year-over-year growth 2024-2029 (%)
Data Table on France - Year-over-year growth 2024-2029 (%)

10.5.4 Italy - Market size and forecast 2024-2029

Chart on Italy - Market size and forecast 2024-2029 ($ million)
Data Table on Italy - Market size and forecast 2024-2029 ($ million)
Chart on Italy - Year-over-year growth 2024-2029 (%)
Data Table on Italy - Year-over-year growth 2024-2029 (%)

10.5.5 The Netherlands - Market size and forecast 2024-2029

Chart on The Netherlands - Market size and forecast 2024-2029 ($ million)
Data Table on The Netherlands - Market size and forecast 2024-2029 ($ million)
Chart on The Netherlands - Year-over-year growth 2024-2029 (%)
Data Table on The Netherlands - Year-over-year growth 2024-2029 (%)

10.5.6 Spain - Market size and forecast 2024-2029

Chart on Spain - Market size and forecast 2024-2029 ($ million)
Data Table on Spain - Market size and forecast 2024-2029 ($ million)
Chart on Spain - Year-over-year growth 2024-2029 (%)
Data Table on Spain - Year-over-year growth 2024-2029 (%)

10.6 South America - Market size and forecast 2024-2029

Chart on South America - Market size and forecast 2024-2029 ($ million)
Data Table on South America - Market size and forecast 2024-2029 ($ million)
Chart on South America - Year-over-year growth 2024-2029 (%)
Data Table on South America - Year-over-year growth 2024-2029 (%)
Chart on Regional Comparison - South America
Data Table on Regional Comparison - South America

10.6.1 Brazil - Market size and forecast 2024-2029

Chart on Brazil - Market size and forecast 2024-2029 ($ million)
Data Table on Brazil - Market size and forecast 2024-2029 ($ million)
Chart on Brazil - Year-over-year growth 2024-2029 (%)
Data Table on Brazil - Year-over-year growth 2024-2029 (%)

10.6.2 Argentina - Market size and forecast 2024-2029

Chart on Argentina - Market size and forecast 2024-2029 ($ million)
Data Table on Argentina - Market size and forecast 2024-2029 ($ million)
Chart on Argentina - Year-over-year growth 2024-2029 (%)
Data Table on Argentina - Year-over-year growth 2024-2029 (%)

10.6.3 Colombia - Market size and forecast 2024-2029

Chart on Colombia - Market size and forecast 2024-2029 ($ million)
Data Table on Colombia - Market size and forecast 2024-2029 ($ million)
Chart on Colombia - Year-over-year growth 2024-2029 (%)
Data Table on Colombia - Year-over-year growth 2024-2029 (%)

10.7 Middle East and Africa - Market size and forecast 2024-2029

Chart on Middle East and Africa - Market size and forecast 2024-2029 ($ million)
Data Table on Middle East and Africa - Market size and forecast 2024-2029 ($ million)
Chart on Middle East and Africa - Year-over-year growth 2024-2029 (%)
Data Table on Middle East and Africa - Year-over-year growth 2024-2029 (%)
Chart on Regional Comparison - Middle East and Africa
Data Table on Regional Comparison - Middle East and Africa

10.7.1 South Africa - Market size and forecast 2024-2029

Chart on South Africa - Market size and forecast 2024-2029 ($ million)
Data Table on South Africa - Market size and forecast 2024-2029 ($ million)
Chart on South Africa - Year-over-year growth 2024-2029 (%)
Data Table on South Africa - Year-over-year growth 2024-2029 (%)

10.7.2 Saudi Arabia - Market size and forecast 2024-2029

Chart on Saudi Arabia - Market size and forecast 2024-2029 ($ million)
Data Table on Saudi Arabia - Market size and forecast 2024-2029 ($ million)
Chart on Saudi Arabia - Year-over-year growth 2024-2029 (%)
Data Table on Saudi Arabia - Year-over-year growth 2024-2029 (%)

10.7.3 UAE - Market size and forecast 2024-2029

Chart on UAE - Market size and forecast 2024-2029 ($ million)
Data Table on UAE - Market size and forecast 2024-2029 ($ million)
Chart on UAE - Year-over-year growth 2024-2029 (%)
Data Table on UAE - Year-over-year growth 2024-2029 (%)

10.7.4 Israel - Market size and forecast 2024-2029

Chart on Israel - Market size and forecast 2024-2029 ($ million)
Data Table on Israel - Market size and forecast 2024-2029 ($ million)
Chart on Israel - Year-over-year growth 2024-2029 (%)
Data Table on Israel - Year-over-year growth 2024-2029 (%)

10.7.5 Turkey - Market size and forecast 2024-2029

Chart on Turkey - Market size and forecast 2024-2029 ($ million)
Data Table on Turkey - Market size and forecast 2024-2029 ($ million)
Chart on Turkey - Year-over-year growth 2024-2029 (%)
Data Table on Turkey - Year-over-year growth 2024-2029 (%)

10.8 Market opportunity by geography

Market opportunity by geography ($ million)
Data Tables on Market opportunity by geography ($ million)

11. Drivers, Challenges, and Opportunity

11.1 Market drivers

Imperative for operational efficiency and cost reduction
Rapid advancements and accessibility of foundational AI models
Increasing demand for hyper-personalization and enhanced client experience

11.2 Market challenges

Accuracy, reliability, and problem of AI hallucinations
Data security, privacy, and confidentiality risks
Navigating uncertain and evolving regulatory landscape

11.3 Impact of drivers and challenges

Impact of drivers and challenges in 2024 and 2029

11.4 Market opportunities

Proliferation of domain-specific and fine-tuned models
Ascendancy of AI copilot as augmentation tool
Intensified focus on secure, private, and hybrid AI architectures

12. Competitive Landscape

12.1 Overview

12.2

Overview on criticality of inputs and factors of differentiation

12.3 Landscape disruption

Overview on factors of disruption

12.4 Industry risks

Impact of key risks on business

13. Competitive Analysis

13.1 Companies profiled

Companies covered

13.2 Company ranking index

13.3 Market positioning of companies

Matrix on companies position and classification

13.4 Amazon Web Services Inc.

Amazon Web Services Inc. - Overview
Amazon Web Services Inc. - Product / Service
Amazon Web Services Inc. - Key news
Amazon Web Services Inc. - Key offerings
SWOT

13.5 Anthropic

Anthropic - Overview
Anthropic - Product / Service
Anthropic - Key offerings
SWOT

13.6 Baidu Inc.

Baidu Inc. - Overview
Baidu Inc. - Business segments
Baidu Inc. - Key offerings
Baidu Inc. - Segment focus
SWOT

13.7 BlackRock Inc.

BlackRock Inc. - Overview
BlackRock Inc. - Product / Service
BlackRock Inc. - Key news
BlackRock Inc. - Key offerings
SWOT

13.8 Cohere Inc.

Cohere Inc. - Overview
Cohere Inc. - Product / Service
Cohere Inc. - Key offerings
SWOT

13.9 FMR LLC

FMR LLC - Overview
FMR LLC - Product / Service
FMR LLC - Key offerings
SWOT

13.10 The Goldman Sachs Group Inc.

The Goldman Sachs Group Inc. - Overview
The Goldman Sachs Group Inc. - Business segments
The Goldman Sachs Group Inc. - Key news
The Goldman Sachs Group Inc. - Key offerings
The Goldman Sachs Group Inc. - Segment focus
SWOT

13.11 Google LLC

Google LLC - Overview
Google LLC - Product / Service
Google LLC - Key offerings
SWOT

13.12 IBM Corp.

IBM Corp. - Overview
IBM Corp. - Business segments
IBM Corp. - Key news
IBM Corp. - Key offerings
IBM Corp. - Segment focus
SWOT

13.13 JPMorgan Chase and Co.

JPMorgan Chase and Co. - Overview
JPMorgan Chase and Co. - Business segments
JPMorgan Chase and Co. - Key news
JPMorgan Chase and Co. - Key offerings
JPMorgan Chase and Co. - Segment focus
SWOT

13.14 Microsoft Corp.

Microsoft Corp. - Overview
Microsoft Corp. - Business segments
Microsoft Corp. - Key news
Microsoft Corp. - Key offerings
Microsoft Corp. - Segment focus
SWOT

13.15 Morgan Stanley

Morgan Stanley - Overview
Morgan Stanley - Business segments
Morgan Stanley - Key offerings
Morgan Stanley - Segment focus
SWOT

13.16 NVIDIA Corp.

NVIDIA Corp. - Overview
NVIDIA Corp. - Business segments
NVIDIA Corp. - Key news
NVIDIA Corp. - Key offerings
NVIDIA Corp. - Segment focus
SWOT

13.17 OpenAI

OpenAI - Overview
OpenAI - Product / Service
OpenAI - Key offerings
SWOT

13.18 The Vanguard Group Inc.

The Vanguard Group Inc. - Overview
The Vanguard Group Inc. - Product / Service
The Vanguard Group Inc. - Key offerings
SWOT

14. Appendix

14.1 Scope of the report

Market definition
Objectives
Notes and caveats

14.2 Inclusions and exclusions checklist

Inclusions checklist
Exclusions checklist

14.3 Currency conversion rates for US$

14.4 Research methodology

14.5 Data procurement

Information sources

14.6 Data validation

14.7 Validation techniques employed for market sizing

14.8 Data synthesis

14.9 360 degree market analysis

14.10 List of abbreviations

Research Methodology

Technavio presents a detailed picture of the market by way of study, synthesis, and summation of data from multiple sources. The analysts have presented the various facets of the market with a particular focus on identifying the key industry influencers. The data thus presented is comprehensive, reliable, and the result of extensive research, both primary and secondary.

INFORMATION SOURCES

Primary sources

  • Manufacturers and suppliers
  • Channel partners
  • Industry experts
  • Strategic decision makers

Secondary sources

  • Industry journals and periodicals
  • Government data
  • Financial reports of key industry players
  • Historical data
  • Press releases

DATA ANALYSIS

Data Synthesis

  • Collation of data
  • Estimation of key figures
  • Analysis of derived insights

Data Validation

  • Triangulation with data models
  • Reference against proprietary databases
  • Corroboration with industry experts

REPORT WRITING

Qualitative

  • Market drivers
  • Market challenges
  • Market trends
  • Five forces analysis

Quantitative

  • Market size and forecast
  • Market segmentation
  • Geographical insights
  • Competitive landscape

Interested in this report?

Get your sample now to see our research methodology and insights!

Download Now

Frequently Asked Questions

Generative AI In Asset Management market growth will increase by USD 689.7 million during 2025-2029.

The Generative AI In Asset Management market is expected to grow at a CAGR of 23.3% during 2025-2029.

Generative AI In Asset Management market is segmented by Deployment (Cloud based, On premises, Hybrid) Application (Portfolio management, Risk management, Client engagement and personalization, Research and analysis, Others) End-user (Asset management firms, Banks and financial institutions, Insurance companies, Corporate firms)

Adobe Inc., Amazon Web Services Inc., Anthropic, Baidu Inc., BlackRock Inc., Cohere Inc., FMR LLC, Genie AI Ltd., The Goldman Sachs Group Inc., Google LLC, IBM Corp., Inworld AI, JPMorgan Chase and Co., Microsoft Corp., Morgan Stanley, NVIDIA Corp., OpenAI, The Vanguard Group Inc., Wealthfront Corp. are a few of the key vendors in the Generative AI In Asset Management market.

North America will register the highest growth rate of 41.7% among the other regions. Therefore, the Generative AI In Asset Management market in North America is expected to garner significant business opportunities for the vendors during the forecast period.

US, Canada, Mexico, Japan, China, India, South Korea, Australia, Indonesia, UK, Germany, France, Italy, The Netherlands, Spain, Brazil, Argentina, Colombia, South Africa, Saudi Arabia, UAE, Israel, Turkey

  • Imperative for operational efficiency and cost reduction is the driving factor this market.

The Generative AI In Asset Management market vendors should focus on grabbing business opportunities from the Deployment segment as it accounted for the largest market share in the base year.