Ginger Oil Market Analysis, Size, and Forecast 2024-2028: North America (Canada and Mexico), Europe (France, Germany, and UK), Middle East and Africa (UAE), APAC (China, India, Indonesia, Japan, Malaysia, South Korea, and Thailand), South America (Brazil), and Rest of World (ROW)

Ginger Oil Market Analysis, Size, and Forecast 2024-2028:
North America (Canada and Mexico), Europe (France, Germany, and UK), Middle East and Africa (UAE), APAC (China, India, Indonesia, Japan, Malaysia, South Korea, and Thailand), South America (Brazil), and Rest of World (ROW)

Published: Jun 2024 133 Pages SKU: IRTNTR73761

Market Overview at a Glance

$79.9 Mn
Market Opportunity
10.04%
CAGR
8.9
YoY growth 2023-2024(%)

Ginger Oil Market Size 2024-2028

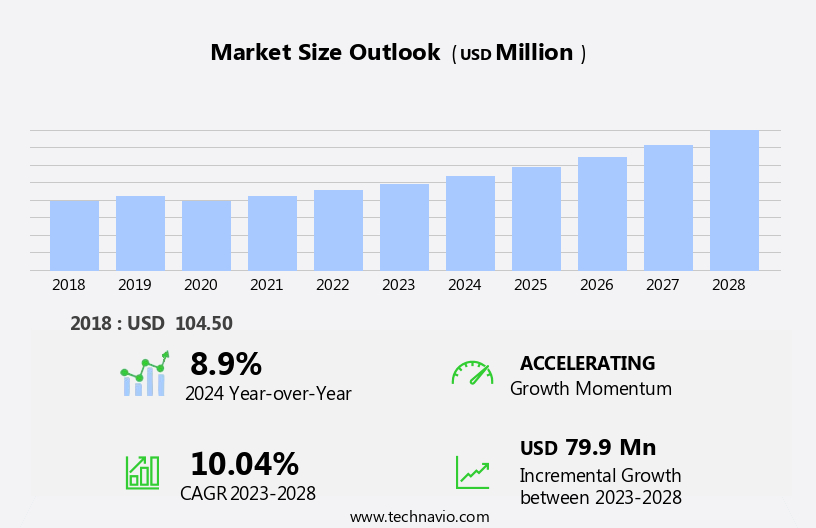
The ginger oil market size is forecast to increase by USD 79.9 million, at a CAGR of 10.04% between 2023 and 2028.

  • The market is driven by the growing recognition of its perceived health benefits, which include anti-inflammatory, antioxidant, botanical extracts and digestive properties. This has led to an increasing demand for ginger oil in various industries, such as food and beverage, cosmetics, and pharmaceuticals. Another key trend in the market is the expanding retail space, with an increasing number of specialty stores and online platforms offering ginger oil and related products. However, companies operating in this market face challenges, including stringent regulations on labeling requirements for ginger oil.
  • Producers must ensure compliance with these regulations to maintain market access and consumer trust. To capitalize on market opportunities and navigate challenges effectively, companies should focus on innovation, quality, and transparency in their operations and marketing strategies. By staying informed of regulatory developments and consumer preferences, they can differentiate themselves in a competitive market and build long-term success.

What will be the Size of the Ginger Oil Market during the forecast period?

Ginger Oil Market Size

Explore in-depth regional segment analysis with market size data - historical 2018-2022 and forecasts 2024-2028 - in the full report.  
Request Free Sample

The market exhibits a dynamic and evolving nature, with ongoing research and development efforts shaping its landscape. Oxidation prevention methods are a critical focus, as ginger oil's volatile nature necessitates effective preservation techniques to maintain its quality and potency. Food additive regulations continue to shape the market, with sensory evaluation metrics and quality control parameters playing essential roles in ensuring compliance. The storage temperature effect on ginger oil's chemical composition is a subject of ongoing investigation, with zingiberene quantification and extraction yield optimization key areas of interest. Steam distillation remains a popular method for extracting ginger oil, but alternative techniques, such as supercritical CO2 extraction and ginger rhizome extraction, are gaining traction.

The processing technology impact on ginger oil's chemical composition is another area of research, with HPLC chromatographic separation and GC-MS analysis methods used to identify and quantify volatile organic compounds and terpenoids. Anti-inflammatory properties, gastric motility effects, and nausea relief efficacy are among the therapeutic applications driving market growth. Quality assurance protocols, including ingredient standardization and microbial contamination control, are crucial for ensuring the consistency and safety of ginger oil products. Light sensitivity and shelf life stability are also important considerations, with cosmetic ingredient grade and pharmaceutical application markets presenting unique challenges and opportunities. The ongoing research and development efforts in the market reflect its continued evolution, with new applications and processing techniques continually emerging. The market's dynamics are shaped by a complex interplay of factors, including regulatory requirements, consumer preferences, and technological advancements.

How is this Ginger Oil Industry segmented?

The ginger oil industry research report provides comprehensive data (region-wise segment analysis), with forecasts and estimates in "USD million" for the period 2024-2028, as well as historical data from 2018-2022 for the following segments.

  • Type
    • Organic
    • Conventional
  • Application
    • Food and Beverage
    • Cosmetics
    • Pharmaceuticals
    • Aromatherapy
  • Distribution Channel
    • B2B
    • Online Retail
    • Specialty Stores
    • Pharmacies
  • Geography
    • North America
      • US
      • Canada
      • Mexico
    • Europe
      • France
      • Germany
      • UK
    • Middle East and Africa
      • UAE
    • APAC
      • China
      • India
      • Indonesia
      • Japan
      • Malaysia
      • South Korea
      • Thailand
    • South America
      • Brazil
    • Rest of World (ROW)

By Type Insights

The organic segment is estimated to witness significant growth during the forecast period.

The market is marked by a focus on ensuring product quality and adherence to regulations. Oxidation prevention methods are crucial to maintain the aroma and therapeutic properties of ginger oil. Food additive regulations, particularly in the cosmetic industry, impact market dynamics. Sensory evaluation metrics and quality control parameters are essential for consumer acceptance and regulatory compliance. The storage temperature effect on ginger oil's chemical composition is a significant concern, necessitating proper handling and packaging. Zingiberene quantification and extraction yield optimization are key areas of research to enhance production efficiency. Steam distillation is a common method for extracting ginger oil, but supercritical CO2 extraction is gaining popularity due to its selectivity and environmental benefits.

Ginger oil adulteration is a persistent issue, necessitating HPLC chromatographic separation and other analytical techniques for identification. Anti-inflammatory properties are a primary driver for ginger oil's use in therapeutic dosage forms. The impact of processing technology on gingerol concentration levels and shogaol content analysis is an active area of research. The cosmetic industry's demand for cosmetic ingredient grade ginger oil necessitates strict microbial contamination control. The aroma compound profiling and antioxidant capacity assay are essential for understanding ginger oil's therapeutic potential. GC-MS analysis method is commonly used for identifying volatile organic compounds and chemical composition variation. Quality assurance protocols and packaging material selection are crucial for maintaining shelf life stability and preserving ginger oil's therapeutic properties.

The pharmaceutical application of ginger oil is a growing area of interest, with terpenoid identification and therapeutic dosage forms being key research areas. The light sensitivity impact on ginger oil's stability and gastric motility effects on its therapeutic efficacy are also subjects of ongoing research. Overall, the market is dynamic, with a focus on enhancing production efficiency, ensuring product quality, and exploring new applications.

Ginger Oil Market Size

Request Free Sample

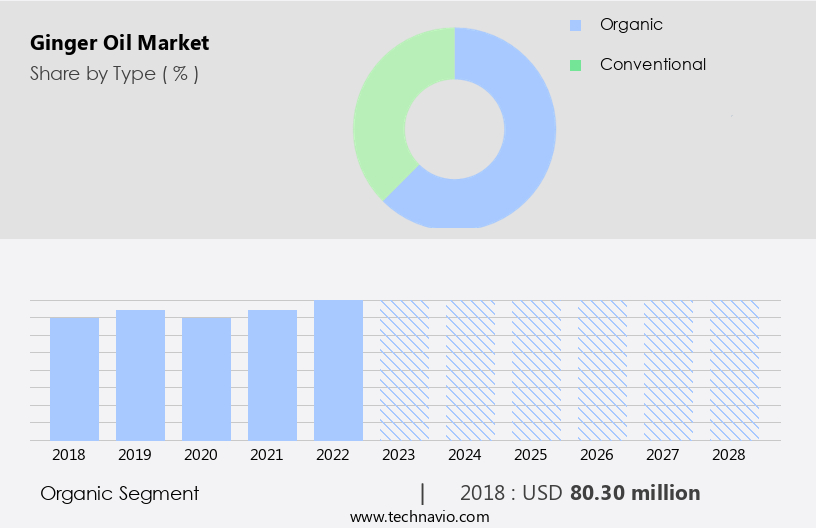
The Organic segment was valued at USD 80.30 million in 2018 and showed a gradual increase during the forecast period.
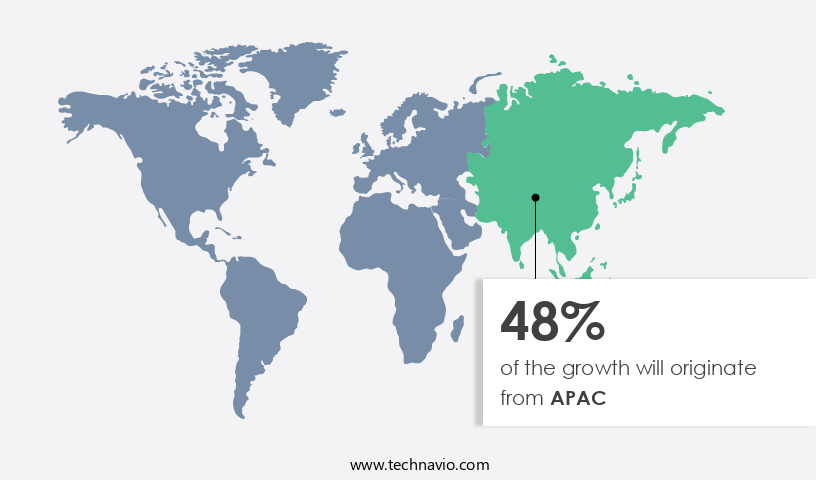
Regional Analysis

APAC is estimated to contribute 48% to the growth of the global market during the forecast period.Technavio's analysts have elaborately explained the regional trends and drivers that shape the market during the forecast period.

Ginger Oil Market Share by Geography

 Request Free Sample

Ginger oil, derived from the rhizomes of the ginger plant, is a valuable essential oil used in various industries due to its unique properties. To maintain its quality, oxidation prevention methods are crucial, including protective packaging and limiting exposure to light. Food additive regulations dictate stringent standards for its use, ensuring safety and efficacy. Sensory evaluation metrics and quality control parameters are essential for assessing its aroma, taste, and purity. Storage temperature significantly impacts ginger oil's stability, with cooler temperatures preserving its volatile organic compounds. Zingiberene quantification and extraction yield optimization are ongoing research areas to enhance production efficiency.

Steam distillation is a common method for extracting ginger oil, but supercritical CO2 extraction is gaining popularity for its selectivity and reduced environmental impact. Ginger oil's anti-inflammatory properties have led to its use in various therapeutic applications, including pharmaceuticals and cosmetics. HPLC chromatographic separation and GC-MS analysis methods are used for identifying and quantifying aroma compounds, shogaol content, and gingerol concentration levels. Shelf life stability is crucial for maintaining the oil's potency, with antioxidant capacity assays and quality assurance protocols essential for ensuring consistency. Processing technology impacts ginger oil's chemical composition variation, with terpenoid identification crucial for understanding its therapeutic effects.

Microbial contamination control is essential for food and pharmaceutical applications, while packaging material selection plays a role in maintaining the oil's integrity. Ginger oil's gastric motility effects and nausea relief efficacy are areas of ongoing research, with potential applications in digestive health products.

Market Dynamics

Our researchers analyzed the data with 2023 as the base year, along with the key drivers, trends, and challenges. A holistic analysis of drivers will help companies refine their marketing strategies to gain a competitive advantage.

The global ginger oil market size and forecast projects growth, driven by ginger oil market trends 2024-2028. B2B ginger oil supply solutions leverage advanced extraction technologies for potency. Ginger oil market growth opportunities 2025 include ginger oil for wellness and organic ginger oil products, meeting demand. Ginger oil supply chain software optimizes operations, while ginger oil market competitive analysis highlights key suppliers. Sustainable ginger oil practices align with eco-friendly ingredient trends. Ginger oil regulations 2024-2028 shapes ginger oil demand in Asia 2025. High-purity ginger oil solutions and premium ginger oil insights boost adoption. Ginger oil for food flavoring and customized ginger oil formulations target niches. Ginger oil market challenges and solutions address sourcing, with direct procurement strategies for ginger oil and ginger oil pricing optimization enhancing profitability. Data-driven ginger oil analytics and natural ingredient trends drive innovation.

What are the key market drivers leading to the rise in the adoption of Ginger Oil Industry?

  • The primary factor driving the market is the perceived health benefits linked to ginger oil. This essential oil, derived from the ginger root, is renowned for its medicinal properties, including anti-inflammatory, antioxidant, and anti-emetic effects, making it a highly sought-after ingredient in various industries such as food, cosmetics, and pharmaceuticals. 
  • The market is experiencing significant growth due to the increasing consumer awareness regarding the health benefits of this essential oil. Ginger oil is known for its stress-relieving properties and is used as a natural relaxant. It is commonly used to alleviate symptoms of mental conditions such as anxiety, depression, and fatigue. Additionally, ginger oil's anti-inflammatory properties make it an effective skincare cosmetic ingredient for reducing skin inflammation. The essential oil is rich in compounds like eugenol, citronella, and linalool, which contribute to its therapeutic benefits. To ensure the quality and safety of ginger oil, essential oil distillation follows strict quality assurance protocols.
  • These protocols include microbial contamination control and terpenoid identification to maintain the oil's purity and potency. Furthermore, pharmaceutical applications of ginger oil are increasing due to its therapeutic properties. In the production process, careful packaging material selection is crucial to preserve the oil's quality and aroma. The market for ginger oil is expected to continue growing as more consumers seek natural alternatives for stress relief and skin care.

What are the market trends shaping the Ginger Oil Industry?

  • Expanding retail space is currently a significant trend in the market. This can be attributed to various factors, including the increasing consumer demand for more shopping options and the evolution of retail formats such as pop-up shops and e-commerce stores.
  • The market is experiencing growth due to the expanding retail sector and increasing demand for natural food additives. Key players in the market include Walmart Inc, Amazon.Com Inc., Costco Wholesale Corporation, Kroger, and Schwarz GmbH & Co KG. In Asia Pacific, the retail market is growing faster than in Europe and North America, driving market expansion. Ginger oil is primarily distributed through supermarkets and hypermarkets, convenience stores, discount stores, and online portals. E-commerce sales are increasing in popularity and are expected to contribute significantly to market growth. To maintain ginger oil's quality, oxidation prevention methods are essential.
  • Food additive regulations vary by region, and sensory evaluation metrics and quality control parameters must be met. Proper storage temperature is crucial for preserving the oil's aroma and flavor. Zingiberene quantification and extraction yield optimization are essential for ensuring product authenticity and consistency. Despite these challenges, the market is expected to grow due to its numerous health benefits and applications in food, beverages, and cosmetics. However, adulteration is a concern, and methods for detecting and preventing it are under ongoing research. The steam distillation method is commonly used for extracting ginger oil, but other methods, such as solvent extraction and CO2 extraction, are also being explored for yield optimization.

What challenges does the Ginger Oil Industry face during its growth?

  • The stringent regulations governing the labeling of ginger oil pose a significant challenge to the industry's growth, requiring companies to adhere to strict standards to ensure accurate and compliant product labeling. 
  • The market faces regulatory challenges due to stringent government regulations on sales, marketing, and labeling of essential oils. These regulations include permit requirements, restrictions on new entrants, residual management issues, and product expiry dates. In Europe, essential oils are classified as hazardous chemical substances, and their use depends on the final product. If marketed as a medicinal product, the essential oil must comply with specific pharmaceutical requirements. Regulatory compliance adds complexity to the production process, impacting processing technology and ingredient standardization. Ginger oil is extracted through methods such as supercritical CO2 extraction and ginger rhizome extraction. Shelf life stability is crucial for ginger oil due to its light sensitivity, which can affect its anti-inflammatory properties.
  • Ginger oil's gastric motility effects make it a valuable ingredient in food and beverage industries. Despite these challenges, the market continues to grow due to the increasing demand for natural ingredients with anti-inflammatory properties. HPLC chromatographic separation is used to ensure ingredient standardization and maintain product quality. Producers must navigate these regulatory hurdles while maintaining the integrity of the ginger oil's beneficial properties.

Exclusive Customer Landscape

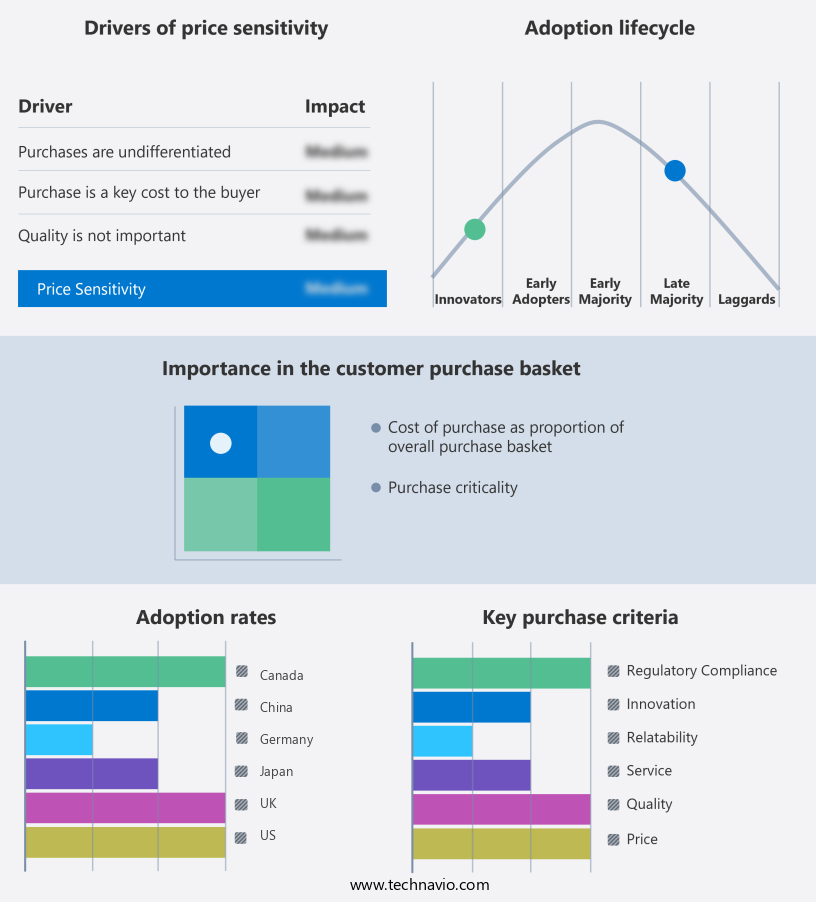
The ginger oil market forecasting report includes the adoption lifecycle of the market, covering from the innovator's stage to the laggard's stage. It focuses on adoption rates in different regions based on penetration. Furthermore, the ginger oil market report also includes key purchase criteria and drivers of price sensitivity to help companies evaluate and develop their market growth analysis strategies.

Ginger Oil Market Share by Geography

 Customer Landscape

Key Companies & Market Insights

Companies are implementing various strategies, such as strategic alliances, ginger oil market forecast, partnerships, mergers and acquisitions, geographical expansion, and product/service launches, to enhance their presence in the industry.

A.G. Groups - Ginger oil, derived from the rhizome of the ginger plant, holds a significant role in folk medicine. Known for its therapeutic properties, it is commonly used to alleviate symptoms of fevers, respiratory discomfort, nausea, stomachaches, menstrual complaints, arthritis, and rheumatism. This essential oil has gained recognition for its potential health benefits, making it a valuable addition to various wellness practices.

The industry research and growth report includes detailed analyses of the competitive landscape of the market and information about key companies, including:

  • A.G. Groups
  • Alchem International Pvt. Ltd.
  • AOS Products Pvt. Ltd.
  • Azelis SA
  • Bo International
  • Edens Garden
  • GR HERBALS
  • International Flavors and Fragrances Inc.
  • Katyani Exports
  • K. K. Enterprise
  • LorAnn Oils Inc.
  • Mane Kancor Ingredients Pvt. Ltd.
  • Manohar Botanical Extracts Pvt. Ltd.
  • New Directions Aromatics Inc.
  • Ozone Naturals
  • Phoenix Aromas and Essential Oils LLC
  • Rakesh Sandal Industries
  • Rocky Mountain Oils LLC
  • Sami Labs Ltd.
  • Synthite Industries Pvt. Ltd.
  • The Lebermuth Co. Inc.
  • Universal Oleoresins
  • Young Living Essential Oils LC

Qualitative and quantitative analysis of companies has been conducted to help clients understand the wider business environment as well as the strengths and weaknesses of key industry players. Data is qualitatively analyzed to categorize companies as pure play, category-focused, industry-focused, and diversified; it is quantitatively analyzed to categorize companies as dominant, leading, strong, tentative, and weak.

Recent Development and News in Ginger Oil Market

  • In January 2024, DoTerra, a leading essential oils company, announced the launch of a new line of certified pure ginger essential oil derived from sustainably sourced ginger roots. This expansion aimed to cater to the growing demand for natural health and wellness products (Source: DoTerra Press Release).
  • In March 2024, Firmenich, a global leader in flavors and fragrances, entered into a strategic partnership with the Indian Spices Board to explore new opportunities in the market. This collaboration aimed to leverage Firmenich's expertise in the fragrance industry and the Spices Board's rich resources to develop innovative ginger oil-based products (Source: Firmenich Press Release).
  • In May 2024, Young Living, another major player in the essential oils market, announced a significant investment of USD10 million in a new ginger oil distillery in Madagascar. This investment was aimed at increasing the company's ginger oil production capacity and ensuring a steady supply of high-quality ginger oil to meet growing demand (Source: Young Living Press Release).
  • In January 2025, the European Commission approved the use of ginger oil as a natural food flavoring. This approval marked a significant regulatory milestone for the market, enabling its use in various food applications across Europe (Source: European Commission Press Release).

Research Analyst Overview

  • Ginger oil, derived from the rhizome of the ginger plant, holds significant market value due to its diverse applications. In the cosmetics industry, ginger oil is utilized for its aroma therapy benefits, enhancing product sensory properties. For pharmaceutical applications, ginger oil components are integrated into drug delivery systems for nausea relief and anti-inflammatory research. The oil extraction process plays a crucial role in yield improvement and cost reduction, with solvent selection and waste management solutions being essential considerations. Quality assessment methods, product safety evaluation, and regulatory compliance are integral to ensuring ginger oil's efficacy and safety. Sustainability practices, such as intellectual property rights and environmental impact assessment, are also vital in the market.
  • Gastric motility studies and antioxidant activity testing further highlight ginger oil's potential in the food industry. Oral ingestion protocols and inhalation administration expand its application methods, while sensory property evaluation and chemical characterization aid in product formulation techniques. Biological activity testing and use in pharmaceuticals underscore ginger oil's potential as a valuable ingredient in various industries.

Dive into Technavio's robust research methodology, blending expert interviews, extensive data synthesis, and validated models for unparalleled Ginger Oil Market insights. See full methodology.

Market Scope

Report Coverage

Details

Page number

133

Base year

2023

Historic period

2018-2022

Forecast period

2024-2028

Growth momentum & CAGR

Accelerate at a CAGR of 10.04%

Market growth 2024-2028

USD 79.9 million

Market structure

Fragmented

YoY growth 2023-2024(%)

8.9

Key countries

US, Malaysia, Indonesia, Germany, UK, South Korea, France, Canada, Brazil, Thailand, UAE, Mexico, China, Japan, and India

Competitive landscape

Leading Companies, Market Positioning of Companies, Competitive Strategies, and Industry Risks

Request Free Sample

What are the Key Data Covered in this Ginger Oil Market Research and Growth Report?

  • CAGR of the Ginger Oil industry during the forecast period
  • Detailed information on factors that will drive the growth and forecasting between 2024 and 2028
  • Precise estimation of the size of the market and its contribution of the industry in focus to the parent market
  • Accurate predictions about upcoming growth and trends and changes in consumer behaviour
  • Growth of the market across APAC, Europe, North America, Middle East and Africa, and South America
  • Thorough analysis of the market's competitive landscape and detailed information about companies
  • Comprehensive analysis of factors that will challenge the ginger oil market growth of industry companies

We can help! Our analysts can customize this ginger oil market research report to meet your requirements.

Get in touch

1 Executive Summary

  • 1.1 Market overview
    • Executive Summary - Chart on Market Overview
    • Executive Summary - Data Table on Market Overview
    • Executive Summary - Chart on Global Market Characteristics
    • Executive Summary - Chart on Market by Geography
    • Executive Summary - Chart on Market Segmentation by Type
    • Executive Summary - Chart on Incremental Growth
    • Executive Summary - Data Table on Incremental Growth
    • Executive Summary - Chart on Company Market Positioning

2 Market Landscape

  • 2.1 Market ecosystem
    • Parent Market
    • Data Table on - Parent Market
  • 2.2 Market characteristics
    • Market characteristics analysis
  • 2.3 Value chain analysis
    • Value Chain Analysis

3 Market Sizing

  • 3.1 Market definition
    • Offerings of companies included in the market definition
  • 3.2 Market segment analysis
    • Market segments
  • 3.3 Market size 2023
    • 3.4 Market outlook: Forecast for 2023-2028
      • Chart on Global - Market size and forecast 2023-2028 ($ million)
      • Data Table on Global - Market size and forecast 2023-2028 ($ million)
      • Chart on Global Market: Year-over-year growth 2023-2028 (%)
      • Data Table on Global Market: Year-over-year growth 2023-2028 (%)

    4 Historic Market Size

    • 4.1 Global Ginger Oil Market 2018 - 2022
      • Historic Market Size - Data Table on Global Ginger Oil Market 2018 - 2022 ($ million)
    • 4.2 Type segment analysis 2018 - 2022
      • Historic Market Size - Type Segment 2018 - 2022 ($ million)
    • 4.3 Geography segment analysis 2018 - 2022
      • Historic Market Size - Geography Segment 2018 - 2022 ($ million)
    • 4.4 Country segment analysis 2018 - 2022
      • Historic Market Size - Country Segment 2018 - 2022 ($ million)

    5 Five Forces Analysis

    • 5.1 Five forces summary
      • Five forces analysis - Comparison between 2023 and 2028
    • 5.2 Bargaining power of buyers
      • Bargaining power of buyers - Impact of key factors 2023 and 2028
    • 5.3 Bargaining power of suppliers
      • Bargaining power of suppliers - Impact of key factors in 2023 and 2028
    • 5.4 Threat of new entrants
      • Threat of new entrants - Impact of key factors in 2023 and 2028
    • 5.5 Threat of substitutes
      • Threat of substitutes - Impact of key factors in 2023 and 2028
    • 5.6 Threat of rivalry
      • Threat of rivalry - Impact of key factors in 2023 and 2028
    • 5.7 Market condition
      • Chart on Market condition - Five forces 2023 and 2028

    6 Market Segmentation by Type

    • 6.1 Market segments
      • Chart on Type - Market share (2023-2028) (%)
      • Data Table on Type - Market share (2023-2028) (%)
    • 6.2 Comparison by Type
      • Chart on Comparison by Type
      • Data Table on Comparison by Type
    • 6.3 Organic - Market size and forecast (2023-2028)
      • Chart on Organic - Market size and forecast (2023-2028) ($ million)
      • Data Table on Organic - Market size and forecast (2023-2028) ($ million)
      • Chart on Organic - Year-over-year growth (2023-2028) (%)
      • Data Table on Organic - Year-over-year growth (2023-2028) (%)
    • 6.4 Conventional - Market size and forecast (2023-2028)
      • Chart on Conventional - Market size and forecast (2023-2028) ($ million)
      • Data Table on Conventional - Market size and forecast (2023-2028) ($ million)
      • Chart on Conventional - Year-over-year growth (2023-2028) (%)
      • Data Table on Conventional - Year-over-year growth (2023-2028) (%)
    • 6.5 Market opportunity by Type
      • Market opportunity by Type ($ million)
      • Data Table on Market opportunity by Type ($ million)

    7 Market Segmentation by Application

    • 7.1 Market segments
      • Chart on Application - Market share (2023-2028) (%)
      • Data Table on Application - Market share (2023-2028) (%)
    • 7.2 Comparison by Application
      • Chart on Comparison by Application
      • Data Table on Comparison by Application
    • 7.3 Food and Beverage - Market size and forecast (2023-2028)
      • Chart on Food and Beverage - Market size and forecast (2023-2028) ($ million)
      • Data Table on Food and Beverage - Market size and forecast (2023-2028) ($ million)
      • Chart on Food and Beverage - Year-over-year growth (2023-2028) (%)
      • Data Table on Food and Beverage - Year-over-year growth (2023-2028) (%)
    • 7.4 Cosmetics - Market size and forecast (2023-2028)
      • Chart on Cosmetics - Market size and forecast (2023-2028) ($ million)
      • Data Table on Cosmetics - Market size and forecast (2023-2028) ($ million)
      • Chart on Cosmetics - Year-over-year growth (2023-2028) (%)
      • Data Table on Cosmetics - Year-over-year growth (2023-2028) (%)
    • 7.5 Pharmaceuticals - Market size and forecast (2023-2028)
      • Chart on Pharmaceuticals - Market size and forecast (2023-2028) ($ million)
      • Data Table on Pharmaceuticals - Market size and forecast (2023-2028) ($ million)
      • Chart on Pharmaceuticals - Year-over-year growth (2023-2028) (%)
      • Data Table on Pharmaceuticals - Year-over-year growth (2023-2028) (%)
    • 7.6 Aromatherapy - Market size and forecast (2023-2028)
      • Chart on Aromatherapy - Market size and forecast (2023-2028) ($ million)
      • Data Table on Aromatherapy - Market size and forecast (2023-2028) ($ million)
      • Chart on Aromatherapy - Year-over-year growth (2023-2028) (%)
      • Data Table on Aromatherapy - Year-over-year growth (2023-2028) (%)
    • 7.7 Market opportunity by Application
      • Market opportunity by Application ($ million)
      • Data Table on Market opportunity by Application ($ million)

    8 Market Segmentation by Distribution Channel

    • 8.1 Market segments
      • Chart on Distribution Channel - Market share (2023-2028) (%)
      • Data Table on Distribution Channel - Market share (2023-2028) (%)
    • 8.2 Comparison by Distribution Channel
      • Chart on Comparison by Distribution Channel
      • Data Table on Comparison by Distribution Channel
    • 8.3 B2B - Market size and forecast (2023-2028)
      • Chart on B2B - Market size and forecast (2023-2028) ($ million)
      • Data Table on B2B - Market size and forecast (2023-2028) ($ million)
      • Chart on B2B - Year-over-year growth (2023-2028) (%)
      • Data Table on B2B - Year-over-year growth (2023-2028) (%)
    • 8.4 Online Retail - Market size and forecast (2023-2028)
      • Chart on Online Retail - Market size and forecast (2023-2028) ($ million)
      • Data Table on Online Retail - Market size and forecast (2023-2028) ($ million)
      • Chart on Online Retail - Year-over-year growth (2023-2028) (%)
      • Data Table on Online Retail - Year-over-year growth (2023-2028) (%)
    • 8.5 Specialty Stores - Market size and forecast (2023-2028)
      • Chart on Specialty Stores - Market size and forecast (2023-2028) ($ million)
      • Data Table on Specialty Stores - Market size and forecast (2023-2028) ($ million)
      • Chart on Specialty Stores - Year-over-year growth (2023-2028) (%)
      • Data Table on Specialty Stores - Year-over-year growth (2023-2028) (%)
    • 8.6 Pharmacies - Market size and forecast (2023-2028)
      • Chart on Pharmacies - Market size and forecast (2023-2028) ($ million)
      • Data Table on Pharmacies - Market size and forecast (2023-2028) ($ million)
      • Chart on Pharmacies - Year-over-year growth (2023-2028) (%)
      • Data Table on Pharmacies - Year-over-year growth (2023-2028) (%)
    • 8.7 Market opportunity by Distribution Channel
      • Market opportunity by Distribution Channel ($ million)
      • Data Table on Market opportunity by Distribution Channel ($ million)

    9 Customer Landscape

    • 9.1 Customer landscape overview
      • Analysis of price sensitivity, lifecycle, customer purchase basket, adoption rates, and purchase criteria

    10 Geographic Landscape

    • 10.1 Geographic segmentation
      • Chart on Market share by geography 2023-2028 (%)
      • Data Table on Market share by geography 2023-2028 (%)
    • 10.2 Geographic comparison
      • Chart on Geographic comparison
      • Data Table on Geographic comparison
    • 10.3 APAC - Market size and forecast 2023-2028
      • Chart on APAC - Market size and forecast 2023-2028 ($ million)
      • Data Table on APAC - Market size and forecast 2023-2028 ($ million)
      • Chart on APAC - Year-over-year growth 2023-2028 (%)
      • Data Table on APAC - Year-over-year growth 2023-2028 (%)
    • 10.4 Europe - Market size and forecast 2023-2028
      • Chart on Europe - Market size and forecast 2023-2028 ($ million)
      • Data Table on Europe - Market size and forecast 2023-2028 ($ million)
      • Chart on Europe - Year-over-year growth 2023-2028 (%)
      • Data Table on Europe - Year-over-year growth 2023-2028 (%)
    • 10.5 North America - Market size and forecast 2023-2028
      • Chart on North America - Market size and forecast 2023-2028 ($ million)
      • Data Table on North America - Market size and forecast 2023-2028 ($ million)
      • Chart on North America - Year-over-year growth 2023-2028 (%)
      • Data Table on North America - Year-over-year growth 2023-2028 (%)
    • 10.6 Middle East and Africa - Market size and forecast 2023-2028
      • Chart on Middle East and Africa - Market size and forecast 2023-2028 ($ million)
      • Data Table on Middle East and Africa - Market size and forecast 2023-2028 ($ million)
      • Chart on Middle East and Africa - Year-over-year growth 2023-2028 (%)
      • Data Table on Middle East and Africa - Year-over-year growth 2023-2028 (%)
    • 10.7 South America - Market size and forecast 2023-2028
      • Chart on South America - Market size and forecast 2023-2028 ($ million)
      • Data Table on South America - Market size and forecast 2023-2028 ($ million)
      • Chart on South America - Year-over-year growth 2023-2028 (%)
      • Data Table on South America - Year-over-year growth 2023-2028 (%)
    • 10.8 China - Market size and forecast 2023-2028
      • Chart on China - Market size and forecast 2023-2028 ($ million)
      • Data Table on China - Market size and forecast 2023-2028 ($ million)
      • Chart on China - Year-over-year growth 2023-2028 (%)
      • Data Table on China - Year-over-year growth 2023-2028 (%)
    • 10.9 US - Market size and forecast 2023-2028
      • Chart on US - Market size and forecast 2023-2028 ($ million)
      • Data Table on US - Market size and forecast 2023-2028 ($ million)
      • Chart on US - Year-over-year growth 2023-2028 (%)
      • Data Table on US - Year-over-year growth 2023-2028 (%)
    • 10.10 Japan - Market size and forecast 2023-2028
      • Chart on Japan - Market size and forecast 2023-2028 ($ million)
      • Data Table on Japan - Market size and forecast 2023-2028 ($ million)
      • Chart on Japan - Year-over-year growth 2023-2028 (%)
      • Data Table on Japan - Year-over-year growth 2023-2028 (%)
    • 10.11 Germany - Market size and forecast 2023-2028
      • Chart on Germany - Market size and forecast 2023-2028 ($ million)
      • Data Table on Germany - Market size and forecast 2023-2028 ($ million)
      • Chart on Germany - Year-over-year growth 2023-2028 (%)
      • Data Table on Germany - Year-over-year growth 2023-2028 (%)
    • 10.12 UK - Market size and forecast 2023-2028
      • Chart on UK - Market size and forecast 2023-2028 ($ million)
      • Data Table on UK - Market size and forecast 2023-2028 ($ million)
      • Chart on UK - Year-over-year growth 2023-2028 (%)
      • Data Table on UK - Year-over-year growth 2023-2028 (%)
    • 10.13 Canada - Market size and forecast 2023-2028
      • Chart on Canada - Market size and forecast 2023-2028 ($ million)
      • Data Table on Canada - Market size and forecast 2023-2028 ($ million)
      • Chart on Canada - Year-over-year growth 2023-2028 (%)
      • Data Table on Canada - Year-over-year growth 2023-2028 (%)
    • 10.14 Market opportunity by geography
      • Market opportunity by geography ($ million)
      • Data Tables on Market opportunity by geography ($ million)
    • 10.15 US - Market size and forecast (2023-2028)
      • Chart on US - Market size and forecast (2023-2028) ($ million)
      • Data Table on US - Market size and forecast (2023-2028) ($ million)
      • Chart on US - Year-over-year growth (2023-2028) (%)
      • Data Table on US - Year-over-year growth (2023-2028) (%)
    • 10.16 Malaysia - Market size and forecast (2023-2028)
      • Chart on Malaysia - Market size and forecast (2023-2028) ($ million)
      • Data Table on Malaysia - Market size and forecast (2023-2028) ($ million)
      • Chart on Malaysia - Year-over-year growth (2023-2028) (%)
      • Data Table on Malaysia - Year-over-year growth (2023-2028) (%)
    • 10.17 Indonesia - Market size and forecast (2023-2028)
      • Chart on Indonesia - Market size and forecast (2023-2028) ($ million)
      • Data Table on Indonesia - Market size and forecast (2023-2028) ($ million)
      • Chart on Indonesia - Year-over-year growth (2023-2028) (%)
      • Data Table on Indonesia - Year-over-year growth (2023-2028) (%)
    • 10.18 South Korea - Market size and forecast (2023-2028)
      • Chart on South Korea - Market size and forecast (2023-2028) ($ million)
      • Data Table on South Korea - Market size and forecast (2023-2028) ($ million)
      • Chart on South Korea - Year-over-year growth (2023-2028) (%)
      • Data Table on South Korea - Year-over-year growth (2023-2028) (%)
    • 10.19 France - Market size and forecast (2023-2028)
      • Chart on France - Market size and forecast (2023-2028) ($ million)
      • Data Table on France - Market size and forecast (2023-2028) ($ million)
      • Chart on France - Year-over-year growth (2023-2028) (%)
      • Data Table on France - Year-over-year growth (2023-2028) (%)
    • 10.20 Brazil - Market size and forecast (2023-2028)
      • Chart on Brazil - Market size and forecast (2023-2028) ($ million)
      • Data Table on Brazil - Market size and forecast (2023-2028) ($ million)
      • Chart on Brazil - Year-over-year growth (2023-2028) (%)
      • Data Table on Brazil - Year-over-year growth (2023-2028) (%)
    • 10.21 Thailand - Market size and forecast (2023-2028)
      • Chart on Thailand - Market size and forecast (2023-2028) ($ million)
      • Data Table on Thailand - Market size and forecast (2023-2028) ($ million)
      • Chart on Thailand - Year-over-year growth (2023-2028) (%)
      • Data Table on Thailand - Year-over-year growth (2023-2028) (%)
    • 10.22 UAE - Market size and forecast (2023-2028)
      • Chart on UAE - Market size and forecast (2023-2028) ($ million)
      • Data Table on UAE - Market size and forecast (2023-2028) ($ million)
      • Chart on UAE - Year-over-year growth (2023-2028) (%)
      • Data Table on UAE - Year-over-year growth (2023-2028) (%)
    • 10.23 Mexico - Market size and forecast (2023-2028)
      • Chart on Mexico - Market size and forecast (2023-2028) ($ million)
      • Data Table on Mexico - Market size and forecast (2023-2028) ($ million)
      • Chart on Mexico - Year-over-year growth (2023-2028) (%)
      • Data Table on Mexico - Year-over-year growth (2023-2028) (%)
    • 10.24 India - Market size and forecast (2023-2028)
      • Chart on India - Market size and forecast (2023-2028) ($ million)
      • Data Table on India - Market size and forecast (2023-2028) ($ million)
      • Chart on India - Year-over-year growth (2023-2028) (%)
      • Data Table on India - Year-over-year growth (2023-2028) (%)
    • 10.25 Rest of World (ROW) - Market size and forecast (2023-2028)
      • Chart on Rest of World (ROW) - Market size and forecast (2023-2028) ($ million)
      • Data Table on Rest of World (ROW) - Market size and forecast (2023-2028) ($ million)
      • Chart on Rest of World (ROW) - Year-over-year growth (2023-2028) (%)
      • Data Table on Rest of World (ROW) - Year-over-year growth (2023-2028) (%)

    11 Drivers, Challenges, and Opportunity/Restraints

    • 11.1 Market drivers
      • 11.2 Market challenges
        • 11.3 Impact of drivers and challenges
          • Impact of drivers and challenges in 2023 and 2028
        • 11.4 Market opportunities/restraints

          12 Competitive Landscape

          • 12.1 Overview
            • 12.2 Competitive Landscape
              • Overview on criticality of inputs and factors of differentiation
            • 12.3 Landscape disruption
              • Overview on factors of disruption
            • 12.4 Industry risks
              • Impact of key risks on business

            13 Competitive Analysis

            • 13.1 Companies profiled
              • Companies covered
            • 13.2 Market positioning of companies
              • Matrix on companies position and classification
            • 13.3 AOS Products Pvt. Ltd.
              • AOS Products Pvt. Ltd. - Overview
              • AOS Products Pvt. Ltd. - Product / Service
              • AOS Products Pvt. Ltd. - Key offerings
            • 13.4 Bo International
              • Bo International - Overview
              • Bo International - Product / Service
              • Bo International - Key offerings
            • 13.5 GR HERBALS
              • GR HERBALS - Overview
              • GR HERBALS - Product / Service
              • GR HERBALS - Key offerings
            • 13.6 Katyani Exports
              • Katyani Exports - Overview
              • Katyani Exports - Product / Service
              • Katyani Exports - Key offerings
            • 13.7 LorAnn Oils Inc.
              • LorAnn Oils Inc. - Overview
              • LorAnn Oils Inc. - Product / Service
              • LorAnn Oils Inc. - Key offerings
            • 13.8 Mane Kancor Ingredients Pvt. Ltd.
              • Mane Kancor Ingredients Pvt. Ltd. - Overview
              • Mane Kancor Ingredients Pvt. Ltd. - Product / Service
              • Mane Kancor Ingredients Pvt. Ltd. - Key offerings
            • 13.9 Manohar Botanical Extracts Pvt. Ltd.
              • Manohar Botanical Extracts Pvt. Ltd. - Overview
              • Manohar Botanical Extracts Pvt. Ltd. - Product / Service
              • Manohar Botanical Extracts Pvt. Ltd. - Key offerings
            • 13.10 Phoenix Aromas and Essential Oils LLC
              • Phoenix Aromas and Essential Oils LLC - Overview
              • Phoenix Aromas and Essential Oils LLC - Product / Service
              • Phoenix Aromas and Essential Oils LLC - Key offerings
            • 13.11 The Lebermuth Co. Inc.
              • The Lebermuth Co. Inc. - Overview
              • The Lebermuth Co. Inc. - Product / Service
              • The Lebermuth Co. Inc. - Key offerings
            • 13.12 Universal Oleoresins
              • Universal Oleoresins - Overview
              • Universal Oleoresins - Product / Service
              • Universal Oleoresins - Key offerings

            14 Appendix

            • 14.1 Scope of the report
              • 14.2 Inclusions and exclusions checklist
                • Inclusions checklist
                • Exclusions checklist
              • 14.3 Currency conversion rates for US$
                • Currency conversion rates for US$
              • 14.4 Research methodology
                • Research methodology
              • 14.5 Data procurement
                • Information sources
              • 14.6 Data validation
                • Data validation
              • 14.7 Validation techniques employed for market sizing
                • Validation techniques employed for market sizing
              • 14.8 Data synthesis
                • Data synthesis
              • 14.9 360 degree market analysis
                • 360 degree market analysis
              • 14.10 List of abbreviations
                • List of abbreviations

              Research Methodology

              Technavio presents a detailed picture of the market by way of study, synthesis, and summation of data from multiple sources. The analysts have presented the various facets of the market with a particular focus on identifying the key industry influencers. The data thus presented is comprehensive, reliable, and the result of extensive research, both primary and secondary.

              INFORMATION SOURCES

              Primary sources

              • Manufacturers and suppliers
              • Channel partners
              • Industry experts
              • Strategic decision makers

              Secondary sources

              • Industry journals and periodicals
              • Government data
              • Financial reports of key industry players
              • Historical data
              • Press releases

              DATA ANALYSIS

              Data Synthesis

              • Collation of data
              • Estimation of key figures
              • Analysis of derived insights

              Data Validation

              • Triangulation with data models
              • Reference against proprietary databases
              • Corroboration with industry experts

              REPORT WRITING

              Qualitative

              • Market drivers
              • Market challenges
              • Market trends
              • Five forces analysis

              Quantitative

              • Market size and forecast
              • Market segmentation
              • Geographical insights
              • Competitive landscape

              Interested in this report?

              Get your sample now to see our research methodology and insights!

              Download Now

              Frequently Asked Questions

              Ginger Oil market growth will increase by $ 79.9 mn during 2024-2028.

              The Ginger Oil market is expected to grow at a CAGR of 10.04% during 2024-2028.

              Ginger Oil market is segmented by Type( Organic, Conventional) Application( Food and Beverage, Cosmetics, Pharmaceuticals, Aromatherapy)

              A.G. Groups, Alchem International Pvt. Ltd., AOS Products Pvt. Ltd., Azelis SA, Bo International, Edens Garden, GR HERBALS, International Flavors and Fragrances Inc., Katyani Exports, K. K. Enterprise, LorAnn Oils Inc., Mane Kancor Ingredients Pvt. Ltd., Manohar Botanical Extracts Pvt. Ltd., New Directions Aromatics Inc., Ozone Naturals, Phoenix Aromas and Essential Oils LLC, Rakesh Sandal Industries, Rocky Mountain Oils LLC, Sami Labs Ltd., Synthite Industries Pvt. Ltd., The Lebermuth Co. Inc., Universal Oleoresins, Young Living Essential Oils LC are a few of the key vendors in the Ginger Oil market.

              APAC will register the highest growth rate of 48% among the other regions. Therefore, the Ginger Oil market in APAC is expected to garner significant business opportunities for the vendors during the forecast period.

              US, Malaysia, Indonesia, Germany, UK, South Korea, France, Canada, Brazil, Thailand, UAE, Mexico, China, Japan, India

              • Perceived health benefits associated with ginger oilOne of the growth drivers of the global ginger oil market is the health benefits of ginger oil. The awareness among consumers about the health benefits of ginger oil is increasing is the driving factor this market.
              • which is expected to increase the demand for ginger oil during the forecast period. Some of the health benefits of ginger oil are mentioned below.Ginger oil helps in relieving stress. Ginger oil is a natural relaxant oil. The oil is the driving factor this market.
              • applied topically or inhaled is the driving factor this market.
              • provides relief from migraines is the driving factor this market.
              • nervous tension is the driving factor this market.
              • anxiety is the driving factor this market.
              • depression is the driving factor this market.
              • fatigue is the driving factor this market.
              • mental strain is the driving factor this market.
              • and other mental conditions. Ginger oil contains eugenol is the driving factor this market.
              • citronella is the driving factor this market.
              • and linalool is the driving factor this market.
              • which help in reducing skin inflammation. It can soothe stings by honey bees is the driving factor this market.
              • insects is the driving factor this market.
              • and snakes.Ginger oil is used for treating indigestion is the driving factor this market.
              • constipation is the driving factor this market.
              • stomach cramps is the driving factor this market.
              • and flatulence. It is also used for alleviating bowel pain. Ginger oil is also used as a muscle relaxant. Massaging with ginger oil provides relief from fatigue is the driving factor this market.
              • aching muscles is the driving factor this market.
              • sore muscles is the driving factor this market.
              • and muscle pains. Ginger oil contains phytochemicals that help in maintaining healthy skin and protect skin cells and tissues through selective fortification.These health benefits of ginger oil are expected to promote the sales of ginger oil is the driving factor this market.
              • which in turn is the driving factor this market.
              • is expected to drive the growth of the global ginger oil market during the forecast period. is the driving factor this market.

              The Ginger Oil market vendors should focus on grabbing business opportunities from the Organic segment as it accounted for the largest market share in the base year.