Glass Curtain Wall Market Analysis, Size, and Forecast 2026-2030: APAC (China, India, and Japan), North America (US, Canada, and Mexico), Europe (Germany, UK, and France), South America (Brazil, Argentina, and Colombia), Middle East and Africa (Saudi Arabia, UAE, and South Africa), and Rest of World (ROW)

Glass Curtain Wall Market Analysis, Size, and Forecast 2026-2030:
APAC (China, India, and Japan), North America (US, Canada, and Mexico), Europe (Germany, UK, and France), South America (Brazil, Argentina, and Colombia), Middle East and Africa (Saudi Arabia, UAE, and South Africa), and Rest of World (ROW)

Published: May 2026 309 Pages SKU: IRTNTR45673

Market Overview at a Glance

$37.20 B
Market Opportunity
8.7%
CAGR 2025 - 2030
39.7%
APAC Growth
$43.02 B
Unitized segment 2024

Glass Curtain Wall Market Size 2026-2030

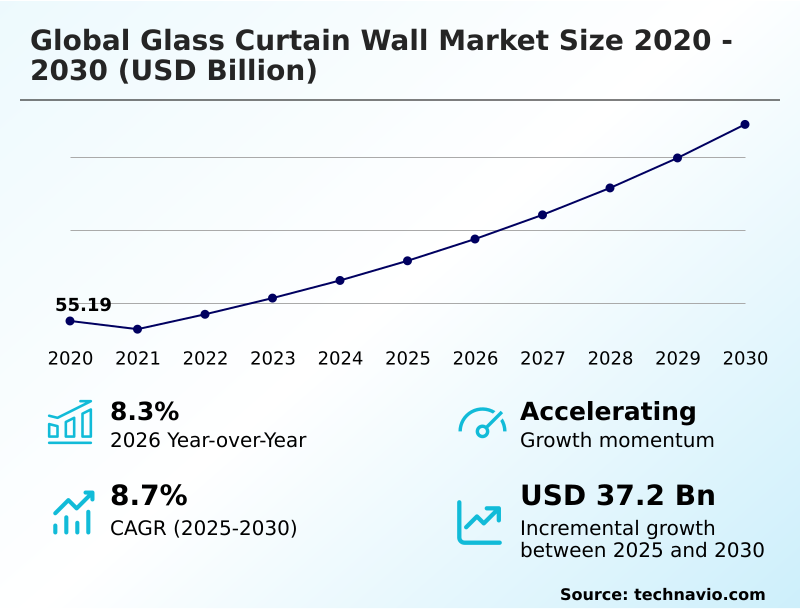
The glass curtain wall market size is valued to increase by USD 37.20 billion, at a CAGR of 8.7% from 2025 to 2030. Rising global demand for energy efficiency and sustainable construction frameworks will drive the glass curtain wall market.

Major Market Trends & Insights

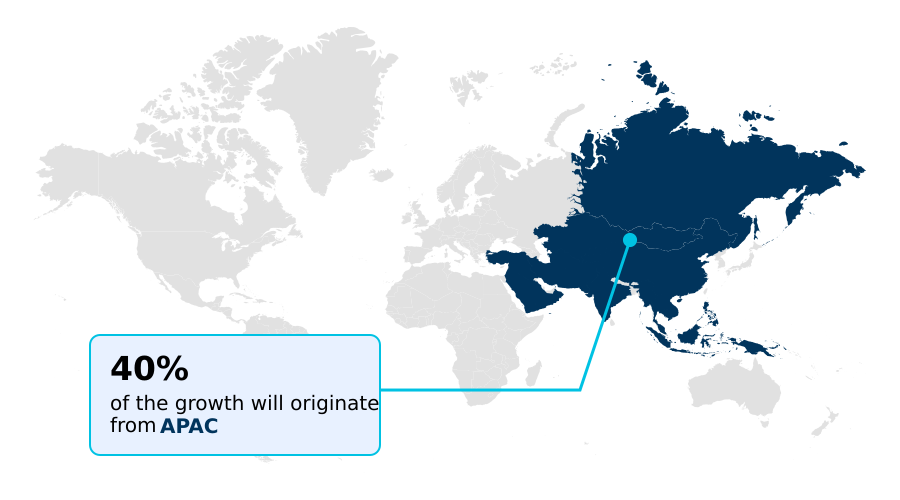
  • APAC dominated the market and accounted for a 39.7% growth during the forecast period.
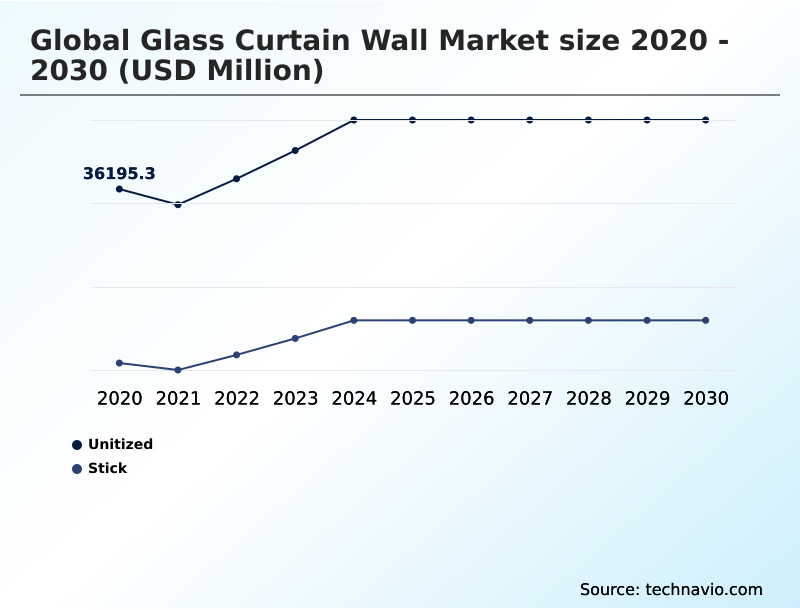
  • By Type - Unitized segment was valued at USD 43.02 billion in 2024
  • By End-user - Commercial segment accounted for the largest market revenue share in 2024

Market Size & Forecast

  • Market Opportunities: USD 53.62 billion
  • Market Future Opportunities: USD 37.20 billion
  • CAGR from 2025 to 2030 : 8.7%

Market Summary

  • The Glass Curtain Wall Market operates as a highly technical sector driven by the urgent need for sustainable, climate-responsive building exteriors in rapidly expanding urban centers. Developers continually integrate low emissivity coatings and thermal break systems to combat intense solar radiation and minimize thermal transmittance.
  • To overcome chronic skilled workforce shortages, construction firms have shifted toward unitized assembly, yielding a 35% reduction in overall installation timelines compared to traditional stick-built approaches. The rising global demand for energy efficiency acts as the primary driver, compelling real estate owners to deploy advanced insulated glazing units that dramatically decrease reliance on mechanical cooling.
  • Conversely, high capital expenditure and extreme price volatility in raw aluminum markets create formidable challenges, frequently inflating initial project budgets by 18% and causing logistical delays. The continuous refinement of structural weather sealants and dynamic shading louvers ensures that modern commercial facilities achieve strict environmental compliance while maintaining architectural elegance.

What will be the Size of the Glass Curtain Wall Market during the forecast period?

Get Key Insights on Market Forecast (PDF) Get Free Sample

How is the Glass Curtain Wall Market Segmented?

The glass curtain wall industry research report provides comprehensive data (region-wise segment analysis), with forecasts and estimates in "USD million" for the period 2026-2030, as well as historical data from 2020-2024 for the following segments.

  • Type
    • Unitized
    • Stick
  • End-user
    • Commercial
    • Public
    • Residential
  • Product type
    • Double glazed
    • Three glazed
    • Single glazed
  • Product
    • Exterior glazed
    • Interior glazed
  • Geography
    • APAC
      • China
      • India
      • Japan
      • South Korea
      • Australia
      • Indonesia
    • North America
      • US
      • Canada
      • Mexico
    • Europe
      • Germany
      • UK
      • France
      • Italy
      • Spain
      • The Netherlands
    • South America
      • Brazil
      • Argentina
      • Colombia
    • Middle East and Africa
      • Saudi Arabia
      • UAE
      • South Africa
      • Turkey
      • Israel

By Type Insights

The unitized segment is estimated to witness significant growth during the forecast period.

The unitized segment redefines architectural envelope engineering by assembling hermetically sealed cavities and unitized facade panels within controlled manufacturing environments.

This prefabricated modular construction method drastically accelerates project timelines by enabling rapid installation on high-rise structures, directly yielding a 40% improvement in on site labor reduction compared to traditional methods.

By shifting complex sealing operations off-site, developers mitigate weather-related delays and ensure superior quality control, which translates into a 25% decrease in overall installation defect rates.

This operational shift allows construction teams to enclose building exteriors at an unprecedented pace, facilitating earlier commencement of interior finishing work.

Real estate investors increasingly favor this approach to optimize labor utilization and compress project delivery schedules, thereby accelerating return on investment and minimizing urban site congestion.

Get Free Sample

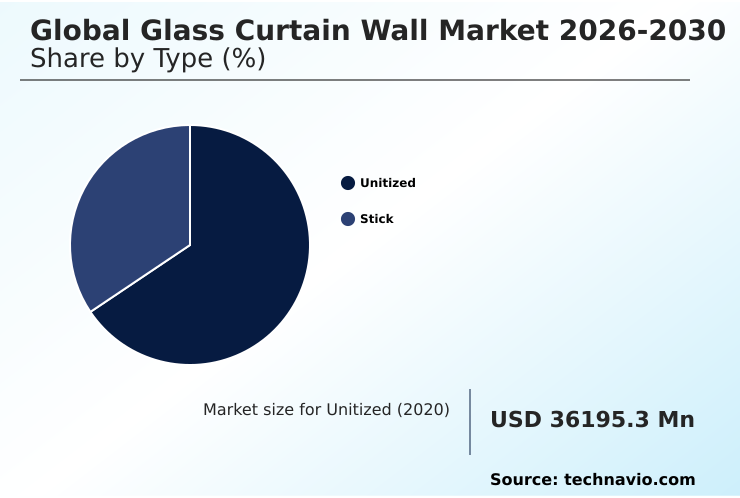
The Unitized segment was valued at USD 43.02 billion in 2024 and showed a gradual increase during the forecast period.

Get Free Sample

Regional Analysis

APAC is estimated to contribute 39.7% to the growth of the global market during the forecast period.Technavio’s analysts have elaborately explained the regional trends and drivers that shape the market during the forecast period.

See How Glass Curtain Wall Market Demand is Rising in APAC Get Free Sample

Regional variations in the Global Glass Curtain Wall Market 2026-2030 underscore distinct operational priorities and regulatory environments across major economic zones.

APAC experiences rapid vertical expansion, where developers leverage seismic load accommodating designs and high wind load resistance to secure towering structures against frequent tectonic activity, achieving a 30% faster project completion rate than European counterparts.

In contrast, North America heavily prioritizes extreme weather resilience and carbon footprint mitigation, driven by stringent municipal codes that penalize inefficient thermal envelopes.

By integrating high-performance building materials, US developers secure prestigious green building certification, which directly elevates premium leasing rates by 12% in competitive commercial real estate hubs.

This stark contrast demonstrates how supply chains in APAC focus on rapid volumetric output, while Western markets emphasize lifecycle sustainability and stringent compliance frameworks to maximize long-term asset valuation.

Market Dynamics

Our researchers analyzed the data with 2025 as the base year, along with the key drivers, trends, and challenges. A holistic analysis of drivers will help companies refine their marketing strategies to gain a competitive advantage.

  • The transition toward sustainable urban infrastructure demands precise integration of advanced exterior envelopes that balance visual transparency with uncompromising environmental functionality. Facility managers increasingly rely on energy efficient double glazed facades to drastically reduce electricity consumption by up to 22% during peak summer operations.
  • To bypass severe skilled labor shortages and chaotic urban logistics, construction firms mandate prefabricated unitized glass curtain installation, which accelerates project delivery and minimizes on-site assembly errors. In geologically active metropolitan centers, the deployment of seismic resistant structural glass systems serves as a critical compliance measure, preventing catastrophic material failure during tectonic events.
  • Simultaneously, achieving optimal commercial high rise thermal insulation requires the strategic utilization of low emissivity coated architectural glass, reflecting infrared radiation while maximizing natural light. This operational pivot allows real estate developers to elevate property valuations by 15% compared to legacy structures, ensuring that long-term energy savings successfully offset the initial premium capital investments associated with high-performance building exteriors.

What are the key market drivers leading to the rise in the adoption of Glass Curtain Wall Industry?

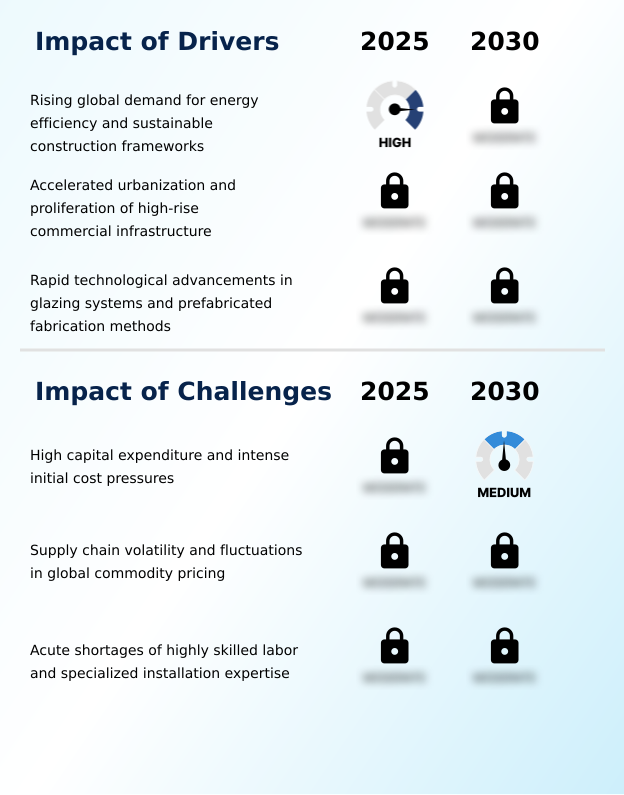
  • The rising global demand for energy efficiency and sustainable construction frameworks acts as the fundamental driver accelerating industry expansion.

  • The intensifying mandate for absolute energy efficiency serves as a formidable driver propelling the Global Glass Curtain Wall Market 2026-2030. Regulatory authorities universally enforce strict environmental codes that demand profound improvements in interior thermal regulation for new commercial developments.
  • Consequently, architects universally deploy heavy-duty insulated glazing units paired with sophisticated low emissivity coatings to radically reflect solar heat gain and prevent winter heat loss. This advanced thermal management directly cuts operational HVAC expenditures by 30%, drastically improving building profitability.
  • Additionally, the strategic implementation of thermal break systems prevents conductive energy transfer through aluminum frames. The resulting artificial illumination reduction, achieved by maximizing daylight penetration, slashes daily electricity usage by 18%.
  • This undeniable operational cost reduction empowers asset owners to quickly recover the premium capital investments required for advanced exterior facades.

What are the market trends shaping the Glass Curtain Wall Industry?

  • The proliferation of minimalist frameless aesthetics and expansive structural glazing serves as the primary trend redefining contemporary architectural designs.

  • The architectural transition toward biophilic facade configurations and structural silicone glazing represents a definitive trend shaping the Global Glass Curtain Wall Market 2026-2030. Modern corporate developers aggressively implement point supported glass to create visually seamless, uninterrupted transparent boundaries that seamlessly merge indoor workspaces with natural exterior environments.
  • This aesthetic evolution directly fuels urban skyline modernization, allowing premium commercial properties to command a 15% increase in baseline lease rates. By drastically minimizing visible metal framing, these advanced systems maximize natural light entry and improve overall tenant well-being. Furthermore, rigorous facade lifecycle assessment protocols now compel engineers to specify materials that offer unparalleled durability alongside striking visual minimalism.
  • This shift fundamentally alters real estate product strategy, forcing supply chains to innovate highly resilient yet virtually invisible anchoring mechanisms to satisfy the uncompromising aesthetic demands of elite urban architectural projects.

What challenges does the Glass Curtain Wall Industry face during its growth?

  • High capital expenditure and intense initial cost pressures remain the most significant challenges hindering widespread adoption across cost-sensitive developments.

  • Extreme vulnerability to global commodity price volatility and complex supply chain material sourcing remain profound challenges restricting the Global Glass Curtain Wall Market 2026-2030. The continuous fabrication of high-grade laminated safety glass and tempered float glass demands massive energy inputs, leaving manufacturers completely exposed to sudden spikes in international fossil fuel and raw mineral costs.
  • These sudden material inflations frequently bloat initial project budgets by up to 20%, forcing developers to value-engineer away from premium vacuum insulated glazing toward less efficient alternatives. Furthermore, executing installations in hyper-dense metropolitan cores introduces severe exterior spatial constraints, drastically increasing the logistical expenses associated with heavy crane rentals and specialized rigging crews.
  • This combination of unpredictable material procurement costs and highly restrictive urban installation environments drastically compresses profit margins, often delaying critical commercial infrastructure upgrades across emerging and established economic regions alike.

Exclusive Technavio Analysis on Customer Landscape

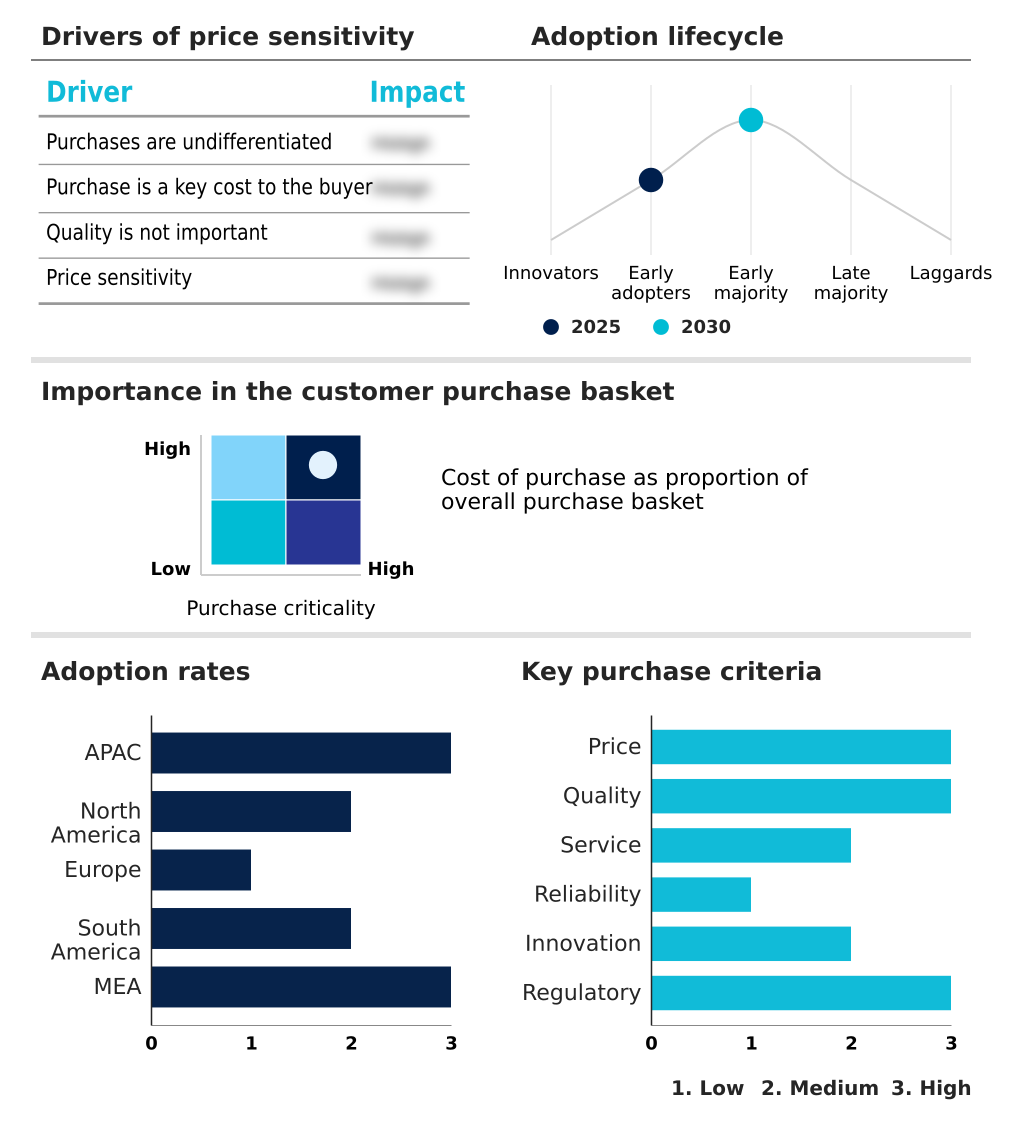
The glass curtain wall market forecasting report includes the adoption lifecycle of the market, covering from the innovator’s stage to the laggard’s stage. It focuses on adoption rates in different regions based on penetration. Furthermore, the glass curtain wall market report also includes key purchase criteria and drivers of price sensitivity to help companies evaluate and develop their market growth analysis strategies.

Customer Landscape of Glass Curtain Wall Industry

Competitive Landscape

Companies are implementing various strategies, such as strategic alliances, glass curtain wall market forecast, partnerships, mergers and acquisitions, geographical expansion, and product/service launches, to enhance their presence in the industry.

AGC Inc. - Delivers advanced architectural building envelopes, including high-performance vision, stratobel, and sunergy facade solutions, engineered to optimize natural daylight penetration and structural integrity for modern commercial infrastructure.

The industry research and growth report includes detailed analyses of the competitive landscape of the market and information about key companies, including:

  • AGC Inc.
  • Apogee Enterprises Inc
  • Arcadia Inc
  • Arconic Corp.
  • Central Glass Co Ltd
  • Compagnie de Saint Gobain SA
  • Guangxi Yuanda Glass
  • Guangzhou Materials Co. Ltd.
  • Guardian Industries Holdings
  • Hainan Haikong Special Glass
  • Kawneer Co Inc
  • Nippon Sheet Glass Co. Ltd.
  • Oldcastle BuildingEnvelope
  • Permasteelisa Spa
  • Qinhuangdao Yongyu Glass Products
  • SCHOTT AG
  • Shanghai Curtain Wall Co. Ltd.
  • Vetrina Windows
  • Vitro SAB De CV
  • Xinyi Glass Holdings Ltd.

Qualitative and quantitative analysis of companies has been conducted to help clients understand the wider business environment as well as the strengths and weaknesses of key industry players. Data is qualitatively analyzed to categorize companies as pure play, category-focused, industry-focused, and diversified; it is quantitatively analyzed to categorize companies as dominant, leading, strong, tentative, and weak.

Recent Development and News in Glass curtain wall market

  • In the Construction Materials industry, the European Union enforcement of the Carbon Border Adjustment Mechanism has mandated strict emissions reporting for imported raw aluminum, directly impacting Glass Curtain Wall demand by accelerating the shift toward domestic post-consumer recycled framing alternatives that reduce compliance costs by up to 15%.
  • In the Construction Materials industry, the widespread adoption of hydrometallurgical recycling for flat glass cullet reclamation has established a viable closed-loop supply chain, directly impacting Glass Curtain Wall demand by lowering primary melting energy requirements and enabling developers to meet LEED v4.1 certification thresholds.
  • In the Construction Materials industry, the implementation of automated robotic extrusion processes for structural aluminum profiles has increased manufacturing throughput by 22%, directly impacting Glass Curtain Wall demand by stabilizing supply networks and reducing fabrication lead times for large-scale urban developments.
  • In the Construction Materials industry, new municipal zoning regulations restricting total embodied carbon limits in commercial real estate construction have penalized heavy masonry usage, directly impacting Glass Curtain Wall demand by driving a 30% increase in the specification of lightweight, building-integrated photovoltaic exterior systems.

Dive into Technavio’s robust research methodology, blending expert interviews, extensive data synthesis, and validated models for unparalleled Glass Curtain Wall Market insights. See full methodology.

Market Scope
Page number 309
Base year 2025
Historic period 2020-2024
Forecast period 2026-2030
Growth momentum & CAGR Accelerate at a CAGR of 8.7%
Market growth 2026-2030 USD 37203.2 million
Market structure Fragmented
YoY growth 2025-2026(%) 8.3%
Key countries China, India, Japan, South Korea, Australia, Indonesia, US, Canada, Mexico, Germany, UK, France, Italy, Spain, The Netherlands, Brazil, Argentina, Colombia, Saudi Arabia, UAE, South Africa, Turkey and Israel
Competitive landscape Leading Companies, Market Positioning of Companies, Competitive Strategies, and Industry Risks

Request Free Sample

Research Analyst Overview

  • The continuous evolution of the Global Glass Curtain Wall Market 2026-2030 illustrates a profound shift toward intelligent, climate-responsive architectural ecosystems. Developers increasingly prioritize building integrated photovoltaics and electrochromic smart glass to transform passive exterior walls into active energy-generating assets.
  • This technological integration directly addresses stringent net zero building compliance, allowing commercial asset owners to reduce overall mechanical energy consumption by an impressive 28%. The integration of dynamic shading louvers and advanced structural silicone glazing enables real estate portfolios to optimize interior climates dynamically, which significantly enhances occupant comfort and workplace productivity.
  • Furthermore, the strategic shift toward utilizing post consumer recycled aluminum in extruded profiles represents a massive advancement in closed loop recycling networks, cutting embodied carbon emissions by 40% during material fabrication. These progressive compliance strategies and high-performance product integrations dictate board-level budgeting decisions, ensuring that premium transparent envelopes remain indispensable for future-proofing high-value corporate infrastructure against escalating environmental regulations.

What are the Key Data Covered in this Glass Curtain Wall Market Research and Growth Report?

  • What is the expected growth of the Glass Curtain Wall Market between 2026 and 2030?

    • USD 37.20 billion, at a CAGR of 8.7%

  • What segmentation does the market report cover?

    • The report is segmented by Type (Unitized, and Stick), End-user (Commercial, Public, and Residential), Product Type (Double glazed, Three glazed, and Single glazed), Product (Exterior glazed, and Interior glazed) and Geography (APAC, North America, Europe, South America, Middle East and Africa)

  • Which regions are analyzed in the report?

    • APAC, North America, Europe, South America and Middle East and Africa

  • What are the key growth drivers and market challenges?

    • Rising global demand for energy efficiency and sustainable construction frameworks, High capital expenditure and intense initial cost pressures

  • Who are the major players in the Glass Curtain Wall Market?

    • AGC Inc., Apogee Enterprises Inc, Arcadia Inc, Arconic Corp., Central Glass Co Ltd, Compagnie de Saint Gobain SA, Guangxi Yuanda Glass, Guangzhou Materials Co. Ltd., Guardian Industries Holdings, Hainan Haikong Special Glass, Kawneer Co Inc, Nippon Sheet Glass Co. Ltd., Oldcastle BuildingEnvelope, Permasteelisa Spa, Qinhuangdao Yongyu Glass Products, SCHOTT AG, Shanghai Curtain Wall Co. Ltd., Vetrina Windows, Vitro SAB De CV and Xinyi Glass Holdings Ltd.

Market Research Insights

  • The Global Glass Curtain Wall Market 2026-2030 remains a critical component of modern urban skyline modernization, driven by the absolute necessity to balance aesthetic transparency with severe environmental performance mandates. Real estate developers prioritize natural daylight penetration and interior thermal regulation, which collectively improve tenant productivity metrics by 18% while lowering utility overheads.
  • By adopting advanced architectural sealants and precision-engineered mullions, commercial properties achieve a 25% improvement in acoustic insulation, directly enhancing indoor environmental quality. Strict energy conservation mandates heavily influence procurement strategies, forcing a transition toward sustainable construction frameworks.
  • Consequently, stakeholders strategically utilize high-performance double glazed systems to offset the 15% rise in operational costs associated with mechanical cooling reliance, ensuring long-term asset viability.

We can help! Our analysts can customize this glass curtain wall market research report to meet your requirements.

Get in touch

1. Executive Summary

1.1 Market overview

Executive Summary - Chart on Market Overview
Executive Summary - Data Table on Market Overview
Executive Summary - Chart on Global Market Characteristics
Executive Summary - Chart on Market by Geography
Executive Summary - Chart on Market Segmentation by Type
Executive Summary - Chart on Market Segmentation by End-user
Executive Summary - Chart on Market Segmentation by Product Type
Executive Summary - Chart on Market Segmentation by Product
Executive Summary - Chart on Incremental Growth
Executive Summary - Data Table on Incremental Growth
Executive Summary - Chart on Company Market Positioning

2. Technavio Analysis

2.1 Analysis of price sensitivity, lifecycle, customer purchase basket, adoption rates, and purchase criteria

2.2 Criticality of inputs and Factors of differentiation

Chart on Overview on criticality of inputs and factors of differentiation

2.3 Factors of disruption

Chart on Overview on factors of disruption

2.4 Impact of drivers and challenges

Chart on Impact of drivers and challenges in 2025 and 2030

3. Market Landscape

3.1 Market ecosystem

Chart on Parent Market
Data Table on - Parent Market

3.2 Market characteristics

Chart on Market characteristics analysis

3.3 Value chain analysis

Chart on Value chain analysis

4. Market Sizing

4.1 Market definition

Data Table on Offerings of companies included in the market definition

4.2 Market segment analysis

Market segments

4.3 Market size 2025

4.4 Market outlook: Forecast for 2025-2030

Chart on Global - Market size and forecast 2025-2030 ($ million)
Data Table on Global - Market size and forecast 2025-2030 ($ million)
Chart on Global Market: Year-over-year growth 2025-2030 (%)
Data Table on Global Market: Year-over-year growth 2025-2030 (%)

5. Historic Market Size

5.1 Global Glass Curtain Wall Market 2020 - 2024

Historic Market Size - Data Table on Global Glass Curtain Wall Market 2020 - 2024 ($ million)

5.2 Type segment analysis 2020 - 2024

Historic Market Size - Type Segment 2020 - 2024 ($ million)

5.3 End-user segment analysis 2020 - 2024

Historic Market Size - End-user Segment 2020 - 2024 ($ million)

5.4 Product Type segment analysis 2020 - 2024

Historic Market Size - Product Type Segment 2020 - 2024 ($ million)

5.5 Product segment analysis 2020 - 2024

Historic Market Size - Product Segment 2020 - 2024 ($ million)

5.6 Geography segment analysis 2020 - 2024

Historic Market Size - Geography Segment 2020 - 2024 ($ million)

5.7 Country segment analysis 2020 - 2024

Historic Market Size - Country Segment 2020 - 2024 ($ million)

6. Qualitative Analysis

6.1 Impact of AI on global glass curtain wall market

6.2 Impact of geopolitical conflicts on global glass curtain wall market

7. Five Forces Analysis

7.1 Five forces summary

Five forces analysis - Comparison between 2025 and 2030

7.2 Bargaining power of buyers

Bargaining power of buyers - Impact of key factors 2025 and 2030

7.3 Bargaining power of suppliers

Bargaining power of suppliers - Impact of key factors in 2025 and 2030

7.4 Threat of new entrants

Threat of new entrants - Impact of key factors in 2025 and 2030

7.5 Threat of substitutes

Threat of substitutes - Impact of key factors in 2025 and 2030

7.6 Threat of rivalry

Threat of rivalry - Impact of key factors in 2025 and 2030

7.7 Market condition

Chart on Market condition - Five forces 2025 and 2030

8. Market Segmentation by Type

8.1 Market segments

Chart on Type - Market share 2025-2030 (%)
Data Table on Type - Market share 2025-2030 (%)

8.2 Comparison by Type

Chart on Comparison by Type
Data Table on Comparison by Type

8.3 Unitized - Market size and forecast 2025-2030

Chart on Unitized - Market size and forecast 2025-2030 ($ million)
Data Table on Unitized - Market size and forecast 2025-2030 ($ million)
Chart on Unitized - Year-over-year growth 2025-2030 (%)
Data Table on Unitized - Year-over-year growth 2025-2030 (%)

8.4 Stick - Market size and forecast 2025-2030

Chart on Stick - Market size and forecast 2025-2030 ($ million)
Data Table on Stick - Market size and forecast 2025-2030 ($ million)
Chart on Stick - Year-over-year growth 2025-2030 (%)
Data Table on Stick - Year-over-year growth 2025-2030 (%)

8.5 Market opportunity by Type

Market opportunity by Type ($ million)
Data Table on Market opportunity by Type ($ million)

9. Market Segmentation by End-user

9.1 Market segments

Chart on End-user - Market share 2025-2030 (%)
Data Table on End-user - Market share 2025-2030 (%)

9.2 Comparison by End-user

Chart on Comparison by End-user
Data Table on Comparison by End-user

9.3 Commercial - Market size and forecast 2025-2030

Chart on Commercial - Market size and forecast 2025-2030 ($ million)
Data Table on Commercial - Market size and forecast 2025-2030 ($ million)
Chart on Commercial - Year-over-year growth 2025-2030 (%)
Data Table on Commercial - Year-over-year growth 2025-2030 (%)

9.4 Public - Market size and forecast 2025-2030

Chart on Public - Market size and forecast 2025-2030 ($ million)
Data Table on Public - Market size and forecast 2025-2030 ($ million)
Chart on Public - Year-over-year growth 2025-2030 (%)
Data Table on Public - Year-over-year growth 2025-2030 (%)

9.5 Residential - Market size and forecast 2025-2030

Chart on Residential - Market size and forecast 2025-2030 ($ million)
Data Table on Residential - Market size and forecast 2025-2030 ($ million)
Chart on Residential - Year-over-year growth 2025-2030 (%)
Data Table on Residential - Year-over-year growth 2025-2030 (%)

9.6 Market opportunity by End-user

Market opportunity by End-user ($ million)
Data Table on Market opportunity by End-user ($ million)

10. Market Segmentation by Product Type

10.1 Market segments

Chart on Product Type - Market share 2025-2030 (%)
Data Table on Product Type - Market share 2025-2030 (%)

10.2 Comparison by Product Type

Chart on Comparison by Product Type
Data Table on Comparison by Product Type

10.3 Double glazed - Market size and forecast 2025-2030

Chart on Double glazed - Market size and forecast 2025-2030 ($ million)
Data Table on Double glazed - Market size and forecast 2025-2030 ($ million)
Chart on Double glazed - Year-over-year growth 2025-2030 (%)
Data Table on Double glazed - Year-over-year growth 2025-2030 (%)

10.4 Three glazed - Market size and forecast 2025-2030

Chart on Three glazed - Market size and forecast 2025-2030 ($ million)
Data Table on Three glazed - Market size and forecast 2025-2030 ($ million)
Chart on Three glazed - Year-over-year growth 2025-2030 (%)
Data Table on Three glazed - Year-over-year growth 2025-2030 (%)

10.5 Single glazed - Market size and forecast 2025-2030

Chart on Single glazed - Market size and forecast 2025-2030 ($ million)
Data Table on Single glazed - Market size and forecast 2025-2030 ($ million)
Chart on Single glazed - Year-over-year growth 2025-2030 (%)
Data Table on Single glazed - Year-over-year growth 2025-2030 (%)

10.6 Market opportunity by Product Type

Market opportunity by Product Type ($ million)
Data Table on Market opportunity by Product Type ($ million)

11. Market Segmentation by Product

11.1 Market segments

Chart on Product - Market share 2025-2030 (%)
Data Table on Product - Market share 2025-2030 (%)

11.2 Comparison by Product

Chart on Comparison by Product
Data Table on Comparison by Product

11.3 Exterior glazed - Market size and forecast 2025-2030

Chart on Exterior glazed - Market size and forecast 2025-2030 ($ million)
Data Table on Exterior glazed - Market size and forecast 2025-2030 ($ million)
Chart on Exterior glazed - Year-over-year growth 2025-2030 (%)
Data Table on Exterior glazed - Year-over-year growth 2025-2030 (%)

11.4 Interior glazed - Market size and forecast 2025-2030

Chart on Interior glazed - Market size and forecast 2025-2030 ($ million)
Data Table on Interior glazed - Market size and forecast 2025-2030 ($ million)
Chart on Interior glazed - Year-over-year growth 2025-2030 (%)
Data Table on Interior glazed - Year-over-year growth 2025-2030 (%)

11.5 Market opportunity by Product

Market opportunity by Product ($ million)
Data Table on Market opportunity by Product ($ million)

12. Customer Landscape

12.1 Customer landscape overview

Analysis of price sensitivity, lifecycle, customer purchase basket, adoption rates, and purchase criteria

13. Geographic Landscape

13.1 Geographic segmentation

Chart on Market share by geography 2025-2030 (%)
Data Table on Market share by geography 2025-2030 (%)

13.2 Geographic comparison

Chart on Geographic comparison
Data Table on Geographic comparison

13.3 APAC - Market size and forecast 2025-2030

Chart on APAC - Market size and forecast 2025-2030 ($ million)
Data Table on APAC - Market size and forecast 2025-2030 ($ million)
Chart on APAC - Year-over-year growth 2025-2030 (%)
Data Table on APAC - Year-over-year growth 2025-2030 (%)
Chart on Regional Comparison - APAC
Data Table on Regional Comparison - APAC

13.3.1 China - Market size and forecast 2025-2030

Chart on China - Market size and forecast 2025-2030 ($ million)
Data Table on China - Market size and forecast 2025-2030 ($ million)
Chart on China - Year-over-year growth 2025-2030 (%)
Data Table on China - Year-over-year growth 2025-2030 (%)

13.3.2 India - Market size and forecast 2025-2030

Chart on India - Market size and forecast 2025-2030 ($ million)
Data Table on India - Market size and forecast 2025-2030 ($ million)
Chart on India - Year-over-year growth 2025-2030 (%)
Data Table on India - Year-over-year growth 2025-2030 (%)

13.3.3 Japan - Market size and forecast 2025-2030

Chart on Japan - Market size and forecast 2025-2030 ($ million)
Data Table on Japan - Market size and forecast 2025-2030 ($ million)
Chart on Japan - Year-over-year growth 2025-2030 (%)
Data Table on Japan - Year-over-year growth 2025-2030 (%)

13.3.4 South Korea - Market size and forecast 2025-2030

Chart on South Korea - Market size and forecast 2025-2030 ($ million)
Data Table on South Korea - Market size and forecast 2025-2030 ($ million)
Chart on South Korea - Year-over-year growth 2025-2030 (%)
Data Table on South Korea - Year-over-year growth 2025-2030 (%)

13.3.5 Australia - Market size and forecast 2025-2030

Chart on Australia - Market size and forecast 2025-2030 ($ million)
Data Table on Australia - Market size and forecast 2025-2030 ($ million)
Chart on Australia - Year-over-year growth 2025-2030 (%)
Data Table on Australia - Year-over-year growth 2025-2030 (%)

13.3.6 Indonesia - Market size and forecast 2025-2030

Chart on Indonesia - Market size and forecast 2025-2030 ($ million)
Data Table on Indonesia - Market size and forecast 2025-2030 ($ million)
Chart on Indonesia - Year-over-year growth 2025-2030 (%)
Data Table on Indonesia - Year-over-year growth 2025-2030 (%)

13.4 North America - Market size and forecast 2025-2030

Chart on North America - Market size and forecast 2025-2030 ($ million)
Data Table on North America - Market size and forecast 2025-2030 ($ million)
Chart on North America - Year-over-year growth 2025-2030 (%)
Data Table on North America - Year-over-year growth 2025-2030 (%)
Chart on Regional Comparison - North America
Data Table on Regional Comparison - North America

13.4.1 US - Market size and forecast 2025-2030

Chart on US - Market size and forecast 2025-2030 ($ million)
Data Table on US - Market size and forecast 2025-2030 ($ million)
Chart on US - Year-over-year growth 2025-2030 (%)
Data Table on US - Year-over-year growth 2025-2030 (%)

13.4.2 Canada - Market size and forecast 2025-2030

Chart on Canada - Market size and forecast 2025-2030 ($ million)
Data Table on Canada - Market size and forecast 2025-2030 ($ million)
Chart on Canada - Year-over-year growth 2025-2030 (%)
Data Table on Canada - Year-over-year growth 2025-2030 (%)

13.4.3 Mexico - Market size and forecast 2025-2030

Chart on Mexico - Market size and forecast 2025-2030 ($ million)
Data Table on Mexico - Market size and forecast 2025-2030 ($ million)
Chart on Mexico - Year-over-year growth 2025-2030 (%)
Data Table on Mexico - Year-over-year growth 2025-2030 (%)

13.5 Europe - Market size and forecast 2025-2030

Chart on Europe - Market size and forecast 2025-2030 ($ million)
Data Table on Europe - Market size and forecast 2025-2030 ($ million)
Chart on Europe - Year-over-year growth 2025-2030 (%)
Data Table on Europe - Year-over-year growth 2025-2030 (%)
Chart on Regional Comparison - Europe
Data Table on Regional Comparison - Europe

13.5.1 Germany - Market size and forecast 2025-2030

Chart on Germany - Market size and forecast 2025-2030 ($ million)
Data Table on Germany - Market size and forecast 2025-2030 ($ million)
Chart on Germany - Year-over-year growth 2025-2030 (%)
Data Table on Germany - Year-over-year growth 2025-2030 (%)

13.5.2 UK - Market size and forecast 2025-2030

Chart on UK - Market size and forecast 2025-2030 ($ million)
Data Table on UK - Market size and forecast 2025-2030 ($ million)
Chart on UK - Year-over-year growth 2025-2030 (%)
Data Table on UK - Year-over-year growth 2025-2030 (%)

13.5.3 France - Market size and forecast 2025-2030

Chart on France - Market size and forecast 2025-2030 ($ million)
Data Table on France - Market size and forecast 2025-2030 ($ million)
Chart on France - Year-over-year growth 2025-2030 (%)
Data Table on France - Year-over-year growth 2025-2030 (%)

13.5.4 Italy - Market size and forecast 2025-2030

Chart on Italy - Market size and forecast 2025-2030 ($ million)
Data Table on Italy - Market size and forecast 2025-2030 ($ million)
Chart on Italy - Year-over-year growth 2025-2030 (%)
Data Table on Italy - Year-over-year growth 2025-2030 (%)

13.5.5 Spain - Market size and forecast 2025-2030

Chart on Spain - Market size and forecast 2025-2030 ($ million)
Data Table on Spain - Market size and forecast 2025-2030 ($ million)
Chart on Spain - Year-over-year growth 2025-2030 (%)
Data Table on Spain - Year-over-year growth 2025-2030 (%)

13.5.6 The Netherlands - Market size and forecast 2025-2030

Chart on The Netherlands - Market size and forecast 2025-2030 ($ million)
Data Table on The Netherlands - Market size and forecast 2025-2030 ($ million)
Chart on The Netherlands - Year-over-year growth 2025-2030 (%)
Data Table on The Netherlands - Year-over-year growth 2025-2030 (%)

13.6 South America - Market size and forecast 2025-2030

Chart on South America - Market size and forecast 2025-2030 ($ million)
Data Table on South America - Market size and forecast 2025-2030 ($ million)
Chart on South America - Year-over-year growth 2025-2030 (%)
Data Table on South America - Year-over-year growth 2025-2030 (%)
Chart on Regional Comparison - South America
Data Table on Regional Comparison - South America

13.6.1 Brazil - Market size and forecast 2025-2030

Chart on Brazil - Market size and forecast 2025-2030 ($ million)
Data Table on Brazil - Market size and forecast 2025-2030 ($ million)
Chart on Brazil - Year-over-year growth 2025-2030 (%)
Data Table on Brazil - Year-over-year growth 2025-2030 (%)

13.6.2 Argentina - Market size and forecast 2025-2030

Chart on Argentina - Market size and forecast 2025-2030 ($ million)
Data Table on Argentina - Market size and forecast 2025-2030 ($ million)
Chart on Argentina - Year-over-year growth 2025-2030 (%)
Data Table on Argentina - Year-over-year growth 2025-2030 (%)

13.6.3 Colombia - Market size and forecast 2025-2030

Chart on Colombia - Market size and forecast 2025-2030 ($ million)
Data Table on Colombia - Market size and forecast 2025-2030 ($ million)
Chart on Colombia - Year-over-year growth 2025-2030 (%)
Data Table on Colombia - Year-over-year growth 2025-2030 (%)

13.7 Middle East and Africa - Market size and forecast 2025-2030

Chart on Middle East and Africa - Market size and forecast 2025-2030 ($ million)
Data Table on Middle East and Africa - Market size and forecast 2025-2030 ($ million)
Chart on Middle East and Africa - Year-over-year growth 2025-2030 (%)
Data Table on Middle East and Africa - Year-over-year growth 2025-2030 (%)
Chart on Regional Comparison - Middle East and Africa
Data Table on Regional Comparison - Middle East and Africa

13.7.1 Saudi Arabia - Market size and forecast 2025-2030

Chart on Saudi Arabia - Market size and forecast 2025-2030 ($ million)
Data Table on Saudi Arabia - Market size and forecast 2025-2030 ($ million)
Chart on Saudi Arabia - Year-over-year growth 2025-2030 (%)
Data Table on Saudi Arabia - Year-over-year growth 2025-2030 (%)

13.7.2 UAE - Market size and forecast 2025-2030

Chart on UAE - Market size and forecast 2025-2030 ($ million)
Data Table on UAE - Market size and forecast 2025-2030 ($ million)
Chart on UAE - Year-over-year growth 2025-2030 (%)
Data Table on UAE - Year-over-year growth 2025-2030 (%)

13.7.3 South Africa - Market size and forecast 2025-2030

Chart on South Africa - Market size and forecast 2025-2030 ($ million)
Data Table on South Africa - Market size and forecast 2025-2030 ($ million)
Chart on South Africa - Year-over-year growth 2025-2030 (%)
Data Table on South Africa - Year-over-year growth 2025-2030 (%)

13.7.4 Turkey - Market size and forecast 2025-2030

Chart on Turkey - Market size and forecast 2025-2030 ($ million)
Data Table on Turkey - Market size and forecast 2025-2030 ($ million)
Chart on Turkey - Year-over-year growth 2025-2030 (%)
Data Table on Turkey - Year-over-year growth 2025-2030 (%)

13.7.5 Israel - Market size and forecast 2025-2030

Chart on Israel - Market size and forecast 2025-2030 ($ million)
Data Table on Israel - Market size and forecast 2025-2030 ($ million)
Chart on Israel - Year-over-year growth 2025-2030 (%)
Data Table on Israel - Year-over-year growth 2025-2030 (%)

13.8 Market opportunity by geography

Market opportunity by geography ($ million)
Data Tables on Market opportunity by geography ($ million)

14. Drivers, Challenges, and Opportunity

14.1 Market drivers

Rising global demand for energy efficiency and sustainable construction frameworks
Accelerated urbanization and proliferation of high-rise commercial infrastructure
Rapid technological advancements in glazing systems and prefabricated fabrication methods

14.2 Market challenges

High capital expenditure and intense initial cost pressures
Supply chain volatility and fluctuations in global commodity pricing
Acute shortages of highly skilled labor and specialized installation expertise

14.3 Impact of drivers and challenges

Impact of drivers and challenges in 2025 and 2030

14.4 Market opportunities

Proliferation of minimalist frameless aesthetics and expansive structural glazing
Integration of circular economy principles and recycled material streams
Rising application of biophilic design elements and organic facade configurations

15. Competitive Landscape

15.1 Overview

15.2

Overview on criticality of inputs and factors of differentiation

15.3 Landscape disruption

Overview on factors of disruption

15.4 Industry risks

Impact of key risks on business

16. Competitive Analysis

16.1 Companies profiled

Companies covered

16.2 Company ranking index

16.3 Market positioning of companies

Matrix on companies position and classification

16.4 AGC Inc.

AGC Inc. - Overview
AGC Inc. - Business segments
AGC Inc. - Key news
AGC Inc. - Key offerings
AGC Inc. - Segment focus
SWOT

16.5 Apogee Enterprises Inc

Apogee Enterprises Inc - Overview
Apogee Enterprises Inc - Business segments
Apogee Enterprises Inc - Key offerings
Apogee Enterprises Inc - Segment focus
SWOT

16.6 Arcadia Inc

Arcadia Inc - Overview
Arcadia Inc - Product / Service
Arcadia Inc - Key offerings
SWOT

16.7 Arconic Corp.

Arconic Corp. - Overview
Arconic Corp. - Product / Service
Arconic Corp. - Key offerings
SWOT

16.8 Central Glass Co Ltd

Central Glass Co Ltd - Overview
Central Glass Co Ltd - Product / Service
Central Glass Co Ltd - Key offerings
SWOT

16.9 Compagnie de Saint Gobain SA

Compagnie de Saint Gobain SA - Overview
Compagnie de Saint Gobain SA - Business segments
Compagnie de Saint Gobain SA - Key offerings
Compagnie de Saint Gobain SA - Segment focus
SWOT

16.10 Guardian Industries Holdings

Guardian Industries Holdings - Overview
Guardian Industries Holdings - Product / Service
Guardian Industries Holdings - Key offerings
SWOT

16.11 Hainan Haikong Special Glass

Hainan Haikong Special Glass - Overview
Hainan Haikong Special Glass - Product / Service
Hainan Haikong Special Glass - Key offerings
SWOT

16.12 Kawneer Co Inc

Kawneer Co Inc - Overview
Kawneer Co Inc - Product / Service
Kawneer Co Inc - Key offerings
SWOT

16.13 Nippon Sheet Glass Co. Ltd.

Nippon Sheet Glass Co. Ltd. - Overview
Nippon Sheet Glass Co. Ltd. - Business segments
Nippon Sheet Glass Co. Ltd. - Key offerings
Nippon Sheet Glass Co. Ltd. - Segment focus
SWOT

16.14 Oldcastle BuildingEnvelope

Oldcastle BuildingEnvelope - Overview
Oldcastle BuildingEnvelope - Product / Service
Oldcastle BuildingEnvelope - Key offerings
SWOT

16.15 Permasteelisa Spa

Permasteelisa Spa - Overview
Permasteelisa Spa - Product / Service
Permasteelisa Spa - Key offerings
SWOT

16.16 SCHOTT AG

SCHOTT AG - Overview
SCHOTT AG - Product / Service
SCHOTT AG - Key offerings
SWOT

16.17 Vitro SAB De CV

Vitro SAB De CV - Overview
Vitro SAB De CV - Business segments
Vitro SAB De CV - Key offerings
Vitro SAB De CV - Segment focus
SWOT

16.18 Xinyi Glass Holdings Ltd.

Xinyi Glass Holdings Ltd. - Overview
Xinyi Glass Holdings Ltd. - Business segments
Xinyi Glass Holdings Ltd. - Key offerings
Xinyi Glass Holdings Ltd. - Segment focus
SWOT

17. Appendix

17.1 Scope of the report

Market definition
Objectives
Notes and caveats

17.2 Inclusions and exclusions checklist

Inclusions checklist
Exclusions checklist

17.3 Currency conversion rates for US$

17.4 Research methodology

17.5 Data procurement

Information sources

17.6 Data validation

17.7 Validation techniques employed for market sizing

17.8 Data synthesis

17.9 360 degree market analysis

17.10 List of abbreviations

Research Methodology

Technavio presents a detailed picture of the market by way of study, synthesis, and summation of data from multiple sources. The analysts have presented the various facets of the market with a particular focus on identifying the key industry influencers. The data thus presented is comprehensive, reliable, and the result of extensive research, both primary and secondary.

INFORMATION SOURCES

Primary sources

  • Manufacturers and suppliers
  • Channel partners
  • Industry experts
  • Strategic decision makers

Secondary sources

  • Industry journals and periodicals
  • Government data
  • Financial reports of key industry players
  • Historical data
  • Press releases

DATA ANALYSIS

Data Synthesis

  • Collation of data
  • Estimation of key figures
  • Analysis of derived insights

Data Validation

  • Triangulation with data models
  • Reference against proprietary databases
  • Corroboration with industry experts

REPORT WRITING

Qualitative

  • Market drivers
  • Market challenges
  • Market trends
  • Five forces analysis

Quantitative

  • Market size and forecast
  • Market segmentation
  • Geographical insights
  • Competitive landscape

Interested in this report?

Get your sample now to see our research methodology and insights!

Download Now

Frequently Asked Questions

Glass Curtain Wall market growth will increase by USD 37203.2 million during 2026-2030.

The Glass Curtain Wall market is expected to grow at a CAGR of 8.7% during 2026-2030.

Glass Curtain Wall market is segmented by Type (Unitized, Stick) End-user (Commercial, Public, Residential) Product type (Double glazed, Three glazed, Single glazed) Product (Exterior glazed, Interior glazed)

AGC Inc., Apogee Enterprises Inc, Arcadia Inc, Arconic Corp., Central Glass Co Ltd, Compagnie de Saint Gobain SA, Guangxi Yuanda Glass, Guangzhou Materials Co. Ltd., Guardian Industries Holdings, Hainan Haikong Special Glass, Kawneer Co Inc, Nippon Sheet Glass Co. Ltd., Oldcastle BuildingEnvelope, Permasteelisa Spa, Qinhuangdao Yongyu Glass Products, SCHOTT AG, Shanghai Curtain Wall Co. Ltd., Vetrina Windows, Vitro SAB De CV, Xinyi Glass Holdings Ltd. are a few of the key vendors in the Glass Curtain Wall market.

APAC will register the highest growth rate of 39.7% among the other regions. Therefore, the Glass Curtain Wall market in APAC is expected to garner significant business opportunities for the vendors during the forecast period.

China, India, Japan, South Korea, Australia, Indonesia, US, Canada, Mexico, Germany, UK, France, Italy, Spain, The Netherlands, Brazil, Argentina, Colombia, Saudi Arabia, UAE, South Africa, Turkey, Israel

  • Rising global demand for energy efficiency and sustainable construction frameworks is the driving factor this market.

The Glass Curtain Wall market vendors should focus on grabbing business opportunities from the Type segment as it accounted for the largest market share in the base year.
RIA - Research AI Assistant
Ask RIA