
UAE Logistics Market Size 2026-2030
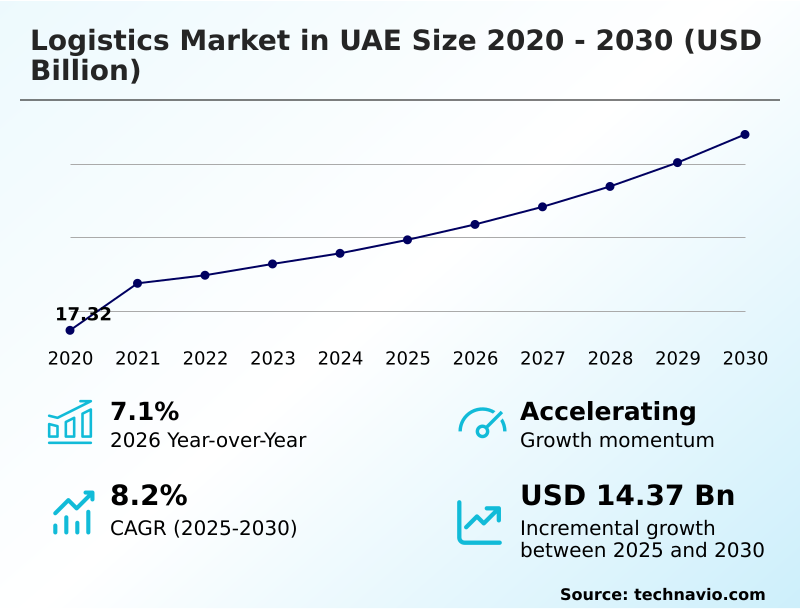
The uae logistics market size is valued to increase by USD 14.37 billion, at a CAGR of 8.2% from 2025 to 2030. Growing e-commerce industry will drive the uae logistics market.
Major Market Trends & Insights
- By Application - Transportation segment was valued at USD 19.68 billion in 2024
- By End-user - Manufacturing segment accounted for the largest market revenue share in 2024
Market Size & Forecast
- Market Opportunities: USD 26.71 billion
- Market Future Opportunities: USD 14.37 billion
- CAGR from 2025 to 2030 : 8.2%
Market Summary
- The logistics market in UAE is a sophisticated ecosystem centered on the planning, execution, and control of resource movement. This market is integral to supply chain management, encompassing services from freight forwarding to multimodal transport.
- Growth is significantly propelled by the burgeoning e-commerce sector and the increasing outsourcing of logistics services by companies seeking to reduce operational costs and focus on core competencies.
- For instance, a retail enterprise leverages an outsourced partner for e-commerce fulfillment, utilizing advanced warehousing and last-mile delivery to meet consumer demands for rapid shipping, thereby enhancing customer loyalty without incurring the high capital cost of a proprietary distribution network.
- Key trends shaping the industry include digital transformation through the adoption of telematics and blockchain technology for enhanced transparency and efficiency. However, the market also contends with challenges such as high operational costs, supply-demand imbalances, and increased lead times stemming from global disruptions, which require strategic management to maintain a competitive edge.
What will be the Size of the UAE Logistics Market during the forecast period?
Get Key Insights on Market Forecast (PDF) Get Free Sample
How is the UAE Logistics Market Segmented?
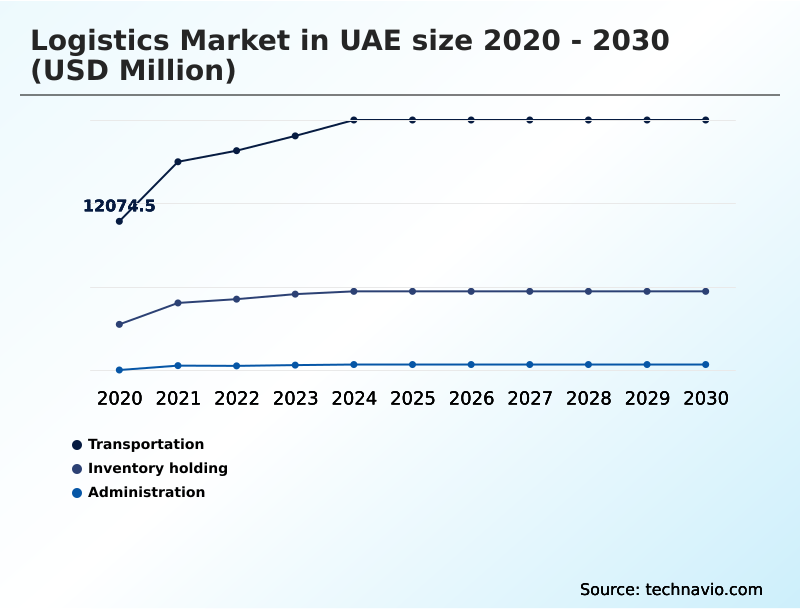
The uae logistics industry research report provides comprehensive data (region-wise segment analysis), with forecasts and estimates in "USD million" for the period 2026-2030, as well as historical data from 2020-2024 for the following segments.
- Application
- Transportation
- Inventory holding
- Administration
- End-user
- Manufacturing
- Retail
- Healthcare
- Automobile
- Others
- Channel
- B2B
- B2C
- Type
- 3PL
- 2PL
- 4PL
- 1PL
- Geography
- Middle East and Africa
- UAE
- Middle East and Africa
By Application Insights
The transportation segment is estimated to witness significant growth during the forecast period.
The transportation segment is the foundation of the logistics market in UAE, encompassing road, sea, and air freight. Its dominance is driven by strategic geography and world-class infrastructure, including major ports and airports that facilitate global trade.
Road freight, critical for last-mile delivery and regional distribution, is evolving with the adoption of real-time fleet management and digital freight matching.
Sea freight remains the backbone for international trade and re-export volumes, while air freight is vital for time-sensitive cargo.
A key focus is on enhancing operational excellence through technology, with telematics adoption leading to an increase in capacity utilization by over 15%.
This segment's trajectory is shaped by a move towards integrated logistics solutions, sustainability, and digitalization, including drayage optimization and enhanced carrier onboarding processes.
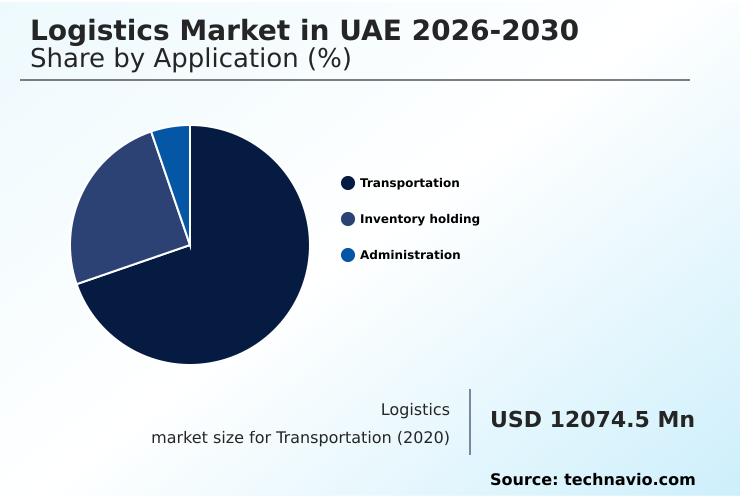
The Transportation segment was valued at USD 19.68 billion in 2024 and showed a gradual increase during the forecast period.
Market Dynamics
Our researchers analyzed the data with 2025 as the base year, along with the key drivers, trends, and challenges. A holistic analysis of drivers will help companies refine their marketing strategies to gain a competitive advantage.
- The impact of e-commerce on logistics has fundamentally reshaped supply chain strategies, placing a premium on optimizing last mile delivery efficiency. To meet consumer demands for speed and accuracy, companies are increasingly turning to technology in warehouse automation systems, which can process orders at a rate significantly faster than manual operations.
- The role of 4PL in logistics is expanding as businesses seek strategic partners to orchestrate complex, end-to-end supply chains. A key enabler in this transformation is blockchain for supply chain transparency, which provides an immutable record of transactions, crucial for managing cold chain logistics compliance and verifying product provenance.
- Simultaneously, multimodal transport solutions for freight are being refined to seamlessly integrate sea, air, and land routes, offering a balanced approach to speed and expense. Despite these advancements, the cost of high operational logistics remains a persistent issue, compelling firms to find innovative ways of reducing lead time in logistics.
- Here, AI in predictive inventory management is proving instrumental; firms leveraging these systems report inventory holding cost reductions that are more than twice as effective compared to those using traditional forecasting methods, thereby mitigating the risk of stockouts while minimizing capital tied up in inventory. This holistic approach is essential for navigating the intricate demands of the modern logistics landscape.
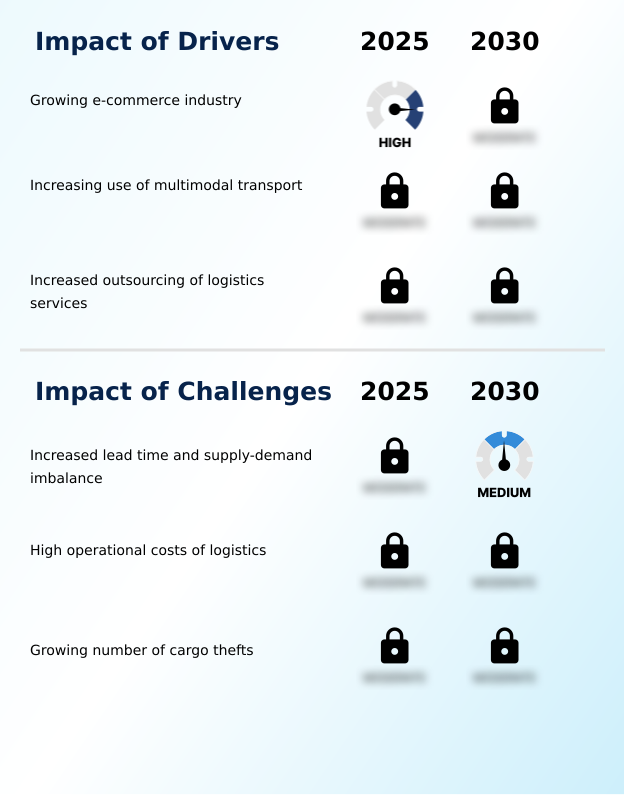
What are the key market drivers leading to the rise in the adoption of UAE Logistics Industry?
- The significant growth of the e-commerce industry is a primary driver fueling the expansion of the logistics market.
- The primary driver of the logistics market is the exponential growth of e-commerce, which necessitates advanced e-commerce delivery solutions and streamlined reverse logistics processes.
- This has accelerated the adoption of automation in fulfillment centers, boosting order fulfillment accuracy to over 99.5%. Simultaneously, an increasing reliance on multimodal transport strategies is helping reduce transit times by up to 15% on key trade lanes.
- The push for operational efficiency is also encouraging the outsourcing of logistics, with a focus on comprehensive supply chain management and contract logistics. This allows businesses to leverage specialized fleet management and telematics without significant capital outlay.
- The demand for specialized services, such as roll-on/roll-off shipping and pre-delivery inspection, further propels market expansion.
What are the market trends shaping the UAE Logistics Industry?
- The integration of blockchain technology is an emerging trend within the logistics industry. This innovation aims to enhance operational visibility and secure product tracking throughout the supply chain process.
- Key trends in the logistics market are centered on digitalization and security. The adoption of blockchain technology for enhancing supply chain transparency is a major focus, as trials have demonstrated its potential to reduce documentation errors by over 90%.
- This is complemented by the integration of advanced freight tracking systems and carrier onboarding platforms, which are becoming standard for managing complex global shipments. Furthermore, digital platforms are improving real-time visibility and customer experience metrics by at least 20%. The use of intelligent systems, including intralogistics automation and fourth-party logistics (4PL) management, offers sophisticated control over the entire supply chain.
- Security measures are also advancing, with a greater emphasis on solutions that improve data security and streamline customs processes.
What challenges does the UAE Logistics Industry face during its growth?
- Increased lead times and a notable imbalance between supply and demand present a key challenge impacting the industry's growth trajectory.
- The logistics market faces significant challenges, primarily high operational costs and supply chain disruptions. Geopolitical instability and port congestion have increased average lead times by nearly 20% in some sectors, creating a pressing need for more resilient supply chain management.
- Rising fuel, labor, and warehouse rental expenses have collectively pushed operational costs up by approximately 10% year-over-year, squeezing margins for service providers. Furthermore, the complexity of customs brokerage and managing drayage operations adds to administrative burdens.
- The necessity of maintaining a robust cold chain logistics infrastructure for sensitive goods, coupled with the intricate demands of fourth-party logistics, requires substantial and continuous investment, making it difficult for some players to compete effectively.
Exclusive Technavio Analysis on Customer Landscape
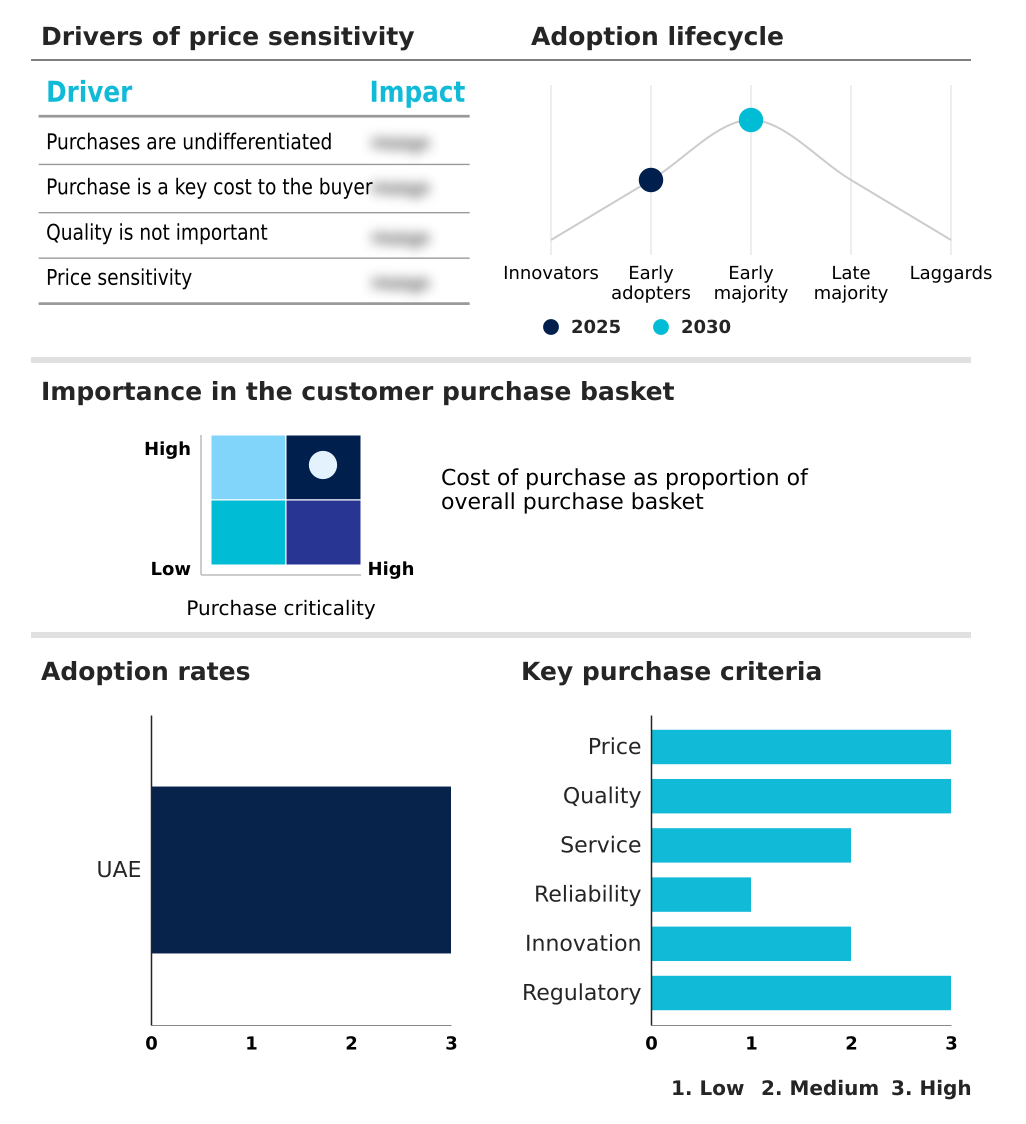
The uae logistics market forecasting report includes the adoption lifecycle of the market, covering from the innovator’s stage to the laggard’s stage. It focuses on adoption rates in different regions based on penetration. Furthermore, the uae logistics market report also includes key purchase criteria and drivers of price sensitivity to help companies evaluate and develop their market growth analysis strategies.
Customer Landscape of UAE Logistics Industry
Competitive Landscape
Companies are implementing various strategies, such as strategic alliances, uae logistics market forecast, partnerships, mergers and acquisitions, geographical expansion, and product/service launches, to enhance their presence in the industry.
Al Futtaim Logistics Co LLC - Delivers integrated contract logistics and green supply chain solutions, specializing in warehousing, global transportation, and fulfillment services to optimize complex operational demands.
The industry research and growth report includes detailed analyses of the competitive landscape of the market and information about key companies, including:
- Al Futtaim Logistics Co LLC
- Almajdouie
- Aramex International LLC
- CEVA Logistics SA
- CSS Group.
- DHL International GmbH
- DP World
- DSV AS
- FedEx Corp.
- Gulf Agency Co. Ltd.
- Gulftainer Co. Ltd.
- Hellmann Worldwide Logistics
- iMile Delivery Services LLC
- JAS Worldwide Inc.
- Kuehne Nagel Management AG
- Modern Freight Company LLC
- RSA Global DWC LLC
- Schenker AG
- Tristar Group
- United Parcel Service Inc.
Qualitative and quantitative analysis of companies has been conducted to help clients understand the wider business environment as well as the strengths and weaknesses of key industry players. Data is qualitatively analyzed to categorize companies as pure play, category-focused, industry-focused, and diversified; it is quantitatively analyzed to categorize companies as dominant, leading, strong, tentative, and weak.
Recent Development and News in Uae logistics market
- In August 2024, Kuehne Nagel Management AG announced the launch of a fully autonomous fulfillment center in Dubai South, leveraging advanced robotics to enhance order processing speed and accuracy for its e-commerce clients.
- In October 2024, DP World initiated a USD 24.5 million investment for the second phase of its Jafza Logistics Park, aimed at developing advanced warehousing to meet escalating demand from multinational corporations.
- In January 2025, Aramex International LLC partnered with a leading technology provider to deploy a blockchain-based platform, enhancing freight tracking capabilities and data security across its supply chain network.
- In April 2025, DHL International GmbH expanded its green logistics services in the region by introducing a new fleet of electric vehicles dedicated to last-mile delivery, reinforcing its commitment to reducing carbon emissions.
Dive into Technavio’s robust research methodology, blending expert interviews, extensive data synthesis, and validated models for unparalleled UAE Logistics Market insights. See full methodology.
| Market Scope | |
|---|---|
| Page number | 203 |
| Base year | 2025 |
| Historic period | 2020-2024 |
| Forecast period | 2026-2030 |
| Growth momentum & CAGR | Accelerate at a CAGR of 8.2% |
| Market growth 2026-2030 | USD 14370.9 million |
| Market structure | Fragmented |
| YoY growth 2025-2026(%) | 7.1% |
| Key countries | UAE |
| Competitive landscape | Leading Companies, Market Positioning of Companies, Competitive Strategies, and Industry Risks |
Research Analyst Overview
- The logistics market is characterized by a rapid technological evolution, where supply chain management is no longer a cost center but a strategic enabler of business growth. The imperative for operational resilience is driving board-level decisions on investments in blockchain technology and telematics to mitigate risks and enhance transparency.
- The integration of warehouse management systems with freight forwarding and customs brokerage services creates a seamless flow of goods. Firms that adopt comprehensive warehouse management systems have reported a 30% reduction in order processing times. The shift towards multimodal transport, including roll-on/roll-off services, coupled with sophisticated fleet management, optimizes both cost and delivery speed.
- Core services like contract logistics are being augmented with value-added offerings such as pre-delivery inspection, driven by the need for customized solutions in sectors requiring cold chain logistics and reverse logistics. This convergence of physical infrastructure and digital capabilities, including advanced freight tracking and e-commerce delivery solutions, defines the competitive landscape.
What are the Key Data Covered in this UAE Logistics Market Research and Growth Report?
-
What is the expected growth of the UAE Logistics Market between 2026 and 2030?
-
USD 14.37 billion, at a CAGR of 8.2%
-
-
What segmentation does the market report cover?
-
The report is segmented by Application (Transportation, Inventory holding, and Administration), End-user (Manufacturing, Retail, Healthcare, Automobile, and Others), Channel (B2B, and B2C), Type (3PL, 2PL, 4PL, and 1PL) and Geography (Middle East and Africa)
-
-
Which regions are analyzed in the report?
-
Middle East and Africa
-
-
What are the key growth drivers and market challenges?
-
Growing e-commerce industry, Increased lead time and supply-demand imbalance
-
-
Who are the major players in the UAE Logistics Market?
-
Al Futtaim Logistics Co LLC, Almajdouie, Aramex International LLC, CEVA Logistics SA, CSS Group., DHL International GmbH, DP World, DSV AS, FedEx Corp., Gulf Agency Co. Ltd., Gulftainer Co. Ltd., Hellmann Worldwide Logistics, iMile Delivery Services LLC, JAS Worldwide Inc., Kuehne Nagel Management AG, Modern Freight Company LLC, RSA Global DWC LLC, Schenker AG, Tristar Group and United Parcel Service Inc.
-
Market Research Insights
- The logistics market is undergoing a dynamic shift, driven by technological adoption and evolving service models. The implementation of supply chain visibility platforms has been shown to reduce shipment delays by up to 25% for early adopters, highlighting a clear return on investment.
- Furthermore, the use of automated sorting systems in fulfillment centers is demonstrating a 40% improvement in order processing speeds compared to manual methods. This evolution is fostering the growth of integrated logistics solutions and on-demand warehousing, which offers businesses greater flexibility.
- As companies increasingly adopt predictive inventory management, they are achieving better alignment between stock levels and market demand, with some reporting a reduction in carrying costs by over 15% through optimized forecasting and resource allocation.
We can help! Our analysts can customize this uae logistics market research report to meet your requirements.
 RIA -
RIA - 
