Graphic Film Market Analysis APAC, North America, Europe, Middle East and Africa, South America - US, China, Japan, Germany, UK, India, Australia, Canada, France, Italy - Size and Forecast 2024-2028

Graphic Film Market Analysis APAC, North America, Europe, Middle East and Africa, South America - US, China, Japan, Germany, UK, India, Australia, Canada, France, Italy - Size and Forecast 2024-2028

Published: Nov 2024 166 Pages SKU: IRTNTR74288

Market Overview at a Glance

$8.86 B
Market Opportunity
6.1%
CAGR
5.6
YoY growth 2023-2024(%)

Graphic Film Market Size 2024-2028 

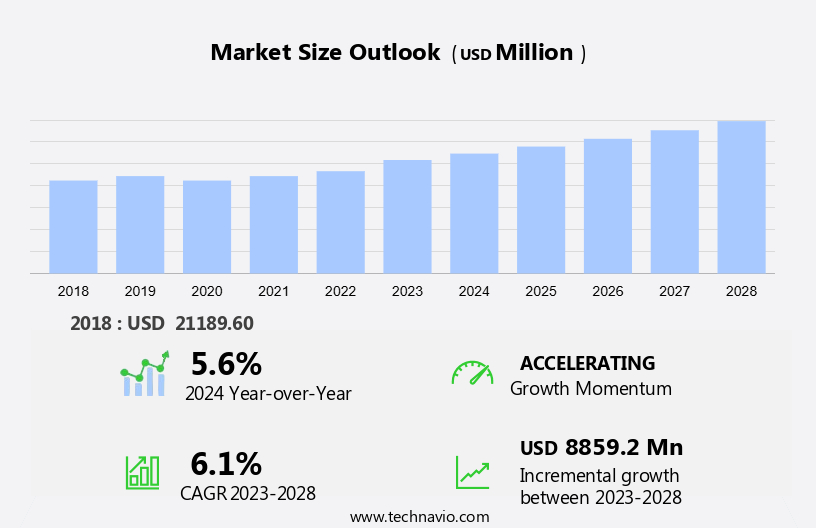
The graphic film market size is forecast to increase by USD 8.86 billion at a CAGR of 6.1% between 2023 and 2028.

  • The market is experiencing significant growth due to the increasing demand for safety signs and decorative elements in various industries. High-quality printability is a key trend in this market, enabling vibrant and clear visuals for vehicle customization and advertising solutions. Advanced printing technologies, such as digital printing, are driving innovation, offering faster turnaround times and improved precision. Additionally, there is a growing preference for environmentally friendly materials, including recyclable films and biodegradable films, as sustainability becomes a priority. Decals and window tinting continue to gain popularity for their protective benefits, while raw material prices remain a challenge for market participants. Overall, the market is poised for continued growth, with a focus on delivering high-quality, eco-friendly solutions for a wide range of applications.

What will be the Size of the Market During the Forecast Period?

Graphic Film Market Size

 Request Free Sample

  • The market is a dynamic industry that caters to various sectors, including architectural designs, signage, branding, and visual communication. This market is driven by the increasing demand for high-quality printability and artistic appeal in advertising solutions. Graphic films come in various forms, such as petroleum-based products and environmentally friendly materials like bioplastics and biodegradable materials. Cellulose, a natural material, is also gaining popularity due to its eco-friendly properties. Vehicle wraps and window graphics are popular applications of graphic films. These films offer excellent advertising opportunities for businesses, allowing them to customize their vehicles and buildings with branding and promotional messages.
  • Safety signs and decorative elements are other applications that contribute to the growth of the market. Printing technologies, such as digital printing, rotogravure, and other techniques, are essential in producing high-quality graphic films. Polymer compounds, including polypropylene, polyvinylchloride, and polyethylene, are commonly used in the production of these films. The market is witnessing significant advancements in the area of environmentally friendly materials. Biodegradable materials and those with a protective layer are becoming increasingly popular due to their reduced environmental impact. Information labelling is another application that benefits from the use of eco-friendly graphic films. Product security is a critical consideration in the market.
  • Films with a protective layer ensure that the graphic designs remain vibrant and intact, even in harsh weather conditions. This feature is especially important for outdoor applications, such as vehicle wraps and window graphics. In conclusion, the market is a thriving industry that offers various opportunities for growth. The increasing demand for high-quality printability, artistic appeal, and eco-friendly materials is driving the market forward. Advancements in printing technologies and the use of biodegradable materials are expected to further fuel the growth of the market.

How is this market segmented and which is the largest segment?

The market research report provides comprehensive data (region-wise segment analysis), with forecasts and estimates in "USD Billion" for the period 2024-2028, as well as historical data from 2018-2022 for the following segments.
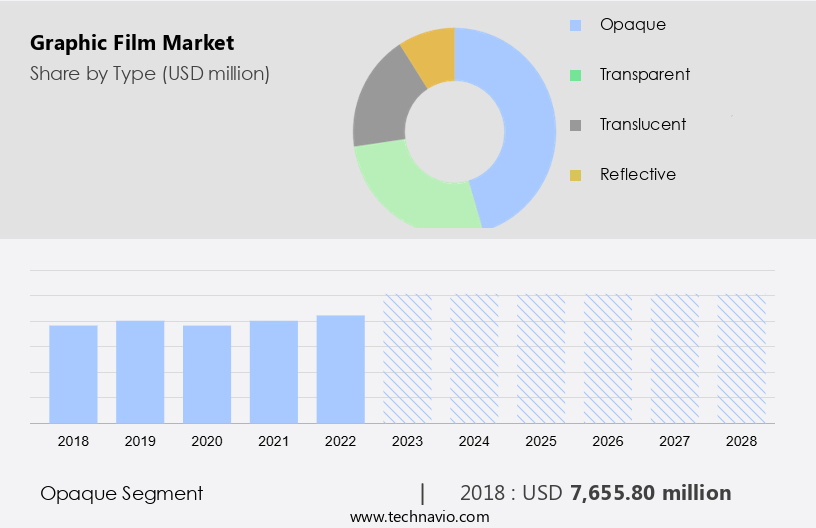
  • Type
    • Opaque
    • Transparent
    • Translucent
    • Reflective
  • Geography
    • APAC
      • China
      • India
      • Japan
    • North America
      • Canada
      • US
    • Europe
      • Germany
      • UK
      • France
      • Italy
    • Middle East and Africa
    • South America

By Type Insights

  • The opaque segment is estimated to witness significant growth during the forecast period.

Graphic films, particularly those made from polyvinyl chloride (PVC) and other polymers such as polypropylene and polyethylene, play a significant role in various industries, including home décor and advertising. These films offer high-resolution graphics and are suitable for information labelling, product security, and protective layers. Monomeric and polymeric films are ideal for use on smooth and slightly curved surfaces, both indoors and outdoors. Advertising graphic films are highly printable and compatible with various commercial ink systems, including latex, eco-solvent, and solvent. For car wraps, fleet graphics, outdoor signs, and building wraps, urethane films are becoming increasingly popular due to their superior qualities.

The demand for these applications is projected to drive the growth of the opaque segment of The market. PVC films are commonly used for vehicle advertising graphics, windows, showcases, illuminated and non-illuminated signs, and channel lettering. Monomeric and polymeric films are suitable for various applications, including both indoor and outdoor use. Advertising graphic films are highly versatile and can be printed using a wide range of commercial ink systems. Urethane films, a newer choice in the wide-format digital printing market, offer superior qualities for car wraps, fleet graphics, outdoor signs, and building wraps. The increasing demand for these applications is expected to fuel the growth of the opaque segment of The market during the forecast period.

Graphic films, including those made from PVC and other polymers, are essential in various industries, including home décor and advertising. These films offer high-resolution graphics and are suitable for information labelling, product security, and protective layers. Monomeric and polymeric films are ideal for use on smooth and slightly curved surfaces, both indoors and outdoors. Advertising graphic films are highly printable and compatible with various commercial ink systems, including latex, eco-solvent, and solvent. Urethane films, a newer choice in the wide-format digital printing market, offer superior qualities for car wraps, fleet graphics, outdoor signs, and building wraps. The increasing demand for these applications is expected to fuel the growth of the opaque segment of The market during the forecast period.

Graphic Film Market Size

Get a glance at the market report of share of various segments Request Free Sample

The Opaque segment was valued at USD 76.55 Billion in 2018 and showed a gradual increase during the forecast period.

Regional Analysis

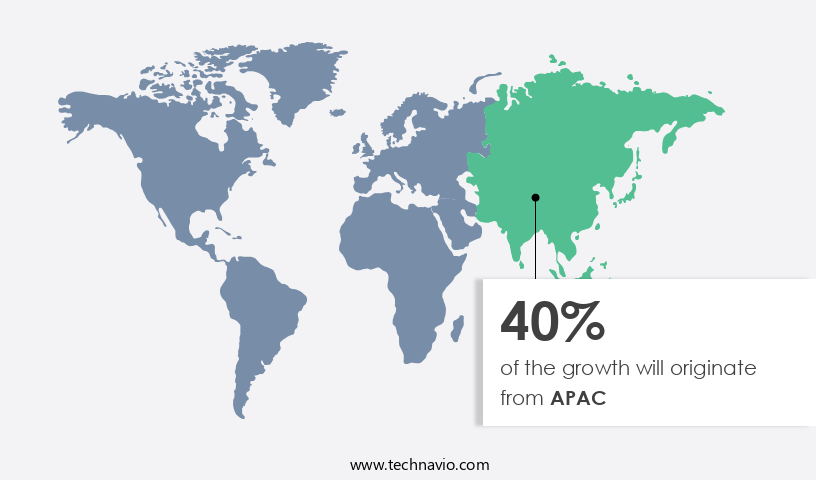
  • APAC is estimated to contribute 40% to the growth of the global market during the forecast period.

Technavio's analysts have elaborately explained the regional trends and drivers that shape the market during the forecast period.

Graphic Film Market Share by Geography

For more insights on the market share of various regions Request Free Sample

The Asia Pacific region is the leading consumer and producer of PVC films in the global market for personalized gifts. The region's expanding manufacturing sector, particularly in China, is driving the demand for graphic films due to their superior properties, including high strength, weather resistance, waterproofing, and flexibility.

Market Dynamics

Our researchers analyzed the data with 2023 as the base year, along with the key drivers, trends, and challenges. A holistic analysis of drivers will help companies refine their marketing strategies to gain a competitive advantage.

What are the key market drivers leading to the rise in adoption of Graphic Film Market?

Increased demand for barrier packaging is the key driver of the market.

  • In the realm of product protection, barrier packaging plays a pivotal role by safeguarding the quality and integrity of various goods. This type of packaging acts as a shield against intrusion by water, light, moisture, oil, aroma, and flavor, ensuring that the product's formulation and shelf life remain unaffected. Flexible plastic films, specifically barrier packaging films, have garnered significant attention in industries such as food, pharmaceuticals, textiles, and automotive due to their effectiveness. The food and pharmaceutical sectors, in particular, demand high-performance packaging solutions to preserve the products' integrity and prolong their shelf life.
  • Transparent barrier packaging films are gaining traction in the market due to their versatility. They are utilized in the production of various packaging items, including clamshell packaging, skin packaging, windowed packaging, and other packaging solutions like blister packaging, wrapping cups, and trays.  It is essential to maintain a formal and knowledgeable tone while discussing the importance of barrier packaging and its applications in diverse industries. Such factors will increase the market growth during the forecast period.

What are the market trends shaping the Graphic Film Market?

Increased use of LLDPE over other forms of polyethylene is the upcoming trend in the market.

  • Graphic films, a versatile solution for safety signs, decorative elements, and advertising applications, are manufactured using various polyethylene forms, including linear low-density polyethylene (LLDPE), low-density polyethylene (LDPE), and high-density polyethylene (HDPE). While LDPE was once the preferred choice for graphic films, LLDPE has gained popularity due to its superior properties. LLDPE offers enhanced mechanical strength, superior comfortability, and exceptional optical clarity. It is also more pliable and softer than LDPE, making it an ideal choice for films requiring high impact absorption without puncture or tear. In the realm of graphic film manufacturing, advancements in printing technologies, such as digital printing, have led to the production of high-quality prints on environmentally friendly materials.
  • Recyclable films and biodegradable films are increasingly being adopted for vehicle customization and window tinting, offering protective benefits while reducing environmental impact. The shift towards eco-friendly solutions is a significant trend in the market, with raw material prices continuing to influence market dynamics. They provide knowledgeable and formal responses. It is essential to maintain a grammatically correct and professional tone in all communications. The market is witnessing increased demand for LLDPE due to its flexibility and superior properties. This trend is expected to continue as the industry focuses on producing high-quality, sustainable graphic film solutions for various applications. Such factors will increase the market trends during the forecast period.

What challenges does Graphic Film Market face during the growth?

Fluctuation in raw material prices is a key challenge affecting the market growth.

  • Graphic films, a significant segment of thermoplastics, are primarily composed of carbon and hydrogen atoms, with propylene, butene, ethylene, isoprene, pentenes, and their copolymers and modifications being the most common polymers used in their production. These films are processed through various methods, including extrusion, injection molding, blow molding, and rotational molding. Among these, polypropylene (PP) and polyethylene (PE) are the most prevalent graphic films due to their affordability and extensive applications. The calendered process and flexography printing technology are commonly used in the manufacturing of graphic films for interior design projects, offering high-quality images and dimensional stability. Transparent films, specifically, are essential in creating aesthetic window graphics and automotive wraps, which require optimal clarity and durability.
  • Renovation activities and marketing campaigns have led to an increased demand for graphic films in various industries. The manufacturing process of these films involves careful consideration of raw material and energy prices, with crude oil and natural gas prices playing a significant role in market fluctuations. Regardless, the market for graphic films remains a vital sector, providing solutions for diverse applications and industries. Such factors will hinder the market growth during the forecast period.

Exclusive Customer Landscape

The market forecasting report includes the adoption lifecycle of the market, covering from the innovator's stage to the laggard's stage. It focuses on adoption rates in different regions based on penetration. Furthermore, the market report also includes key purchase criteria and drivers of price sensitivity to help companies evaluate and develop their market growth analysis strategies.

Graphic Film Market Share by Geography

 Customer Landscape

Key Companies & Market Insights

Companies are implementing various strategies, such as strategic alliances, market forecast, partnerships, mergers and acquisitions, geographical expansion, and product/service launches, to enhance their presence in the market.

The market research and growth report includes detailed analyses of the competitive landscape of the market and information about key companies, including:

  • 3M Co.
  • Achilles Corp.
  • Arlon Graphics LLC
  • Aura Brand Solutions Ltd.
  • Avery Dennison Corp.
  • CCL Industries Corp.
  • Constantia Flexibles Group GmbH
  • Drytac Corp.
  • Dunmore Corp.
  • DuPont de Nemours Inc.
  • FDC Graphic Films Inc.
  • FLEXcon Co. Inc.
  • HEXIS SAS
  • Innovia Films
  • Nekoosa Inc.
  • ORAFOL Europe GmbH
  • RITRAMA Spa
  • Schweitzer Mauduit International Inc.
  • Taghleef Industries SpA
  • The Griff Network

Qualitative and quantitative analysis of companies has been conducted to help clients understand the wider business environment as well as the strengths and weaknesses of key market players. Data is qualitatively analyzed to categorize companies as pure play, category-focused, industry-focused, and diversified; it is quantitatively analyzed to categorize companies as dominant, leading, strong, tentative, and weak.

Research Analyst Overview

The market encompasses a diverse range of products used in various industries for architectural designs, signage, branding, and visual communication. These films come in different forms, including petroleum-based products like polyvinyl chloride (PVC) and bioplastics made from biodegradable materials such as cellulose, biodegradable films, and recycling options. The promotional and advertisement industries heavily utilize graphic films for brand building and customization. Manufacturing processes like calendered and casting, flexography, and printing technologies such as rotogravure, offset, and digital printing, are used to create high-quality films with optimal optical clarity, dimensional stability, and high-quality images. These films are used in various applications, including automotive wraps, window graphics, safety signs, and decorative elements.

Environmental sustainability and regulations are increasingly influencing the market, leading to the adoption of eco-friendly materials like biodegradable films and recyclable films. Raw material prices for polyethylene (PE), polypropylene (PP), and other polymer compounds impact the market's dynamics. Graphic films are used in various industries, including the automotive, electronics, and home décor sectors, for advertising solutions, information labelling, product security, and protective benefits. Digital graphic films are increasingly popular for e-commerce and corporate workspaces. The market also includes specialty films for various applications, such as opaque, transparent, translucent, reflective, and cast films.

Market Scope

Report Coverage

Details

Page number

166

Base year

2023

Historic period

2018-2022

Forecast period

2024-2028

Growth momentum & CAGR

Accelerate at a CAGR of 6.1%

Market growth 2024-2028

USD 8.86 billion

Market structure

Fragmented

YoY growth 2023-2024(%)

5.6

Key countries

US, China, Japan, Germany, UK, India, Australia, Canada, France, and Italy

Competitive landscape

Leading Companies, Market Positioning of Companies, Competitive Strategies, and Industry Risks

Request Free Sample

What are the Key Data Covered in this Market Research and Growth Report?

  • CAGR of the market during the forecast period
  • Detailed information on factors that will drive the market growth and forecasting between 2024 and 2028
  • Precise estimation of the size of the market  and its contribution of the market in focus to the parent market
  • Accurate predictions about upcoming market growth and trends and changes in consumer behaviour
  • Growth of the market across APAC, North America, Europe, Middle East and Africa, and South America
  • Thorough analysis of the market's competitive landscape and detailed information about companies
  • Comprehensive analysis of factors that will challenge the growth of market companies

We can help! Our analysts can customize this market research report to meet your requirements. Get in touch

1 Executive Summary

  • 1.1 Market overview
    • Executive Summary - Chart on Market Overview
    • Executive Summary - Data Table on Market Overview
    • Executive Summary - Chart on Global Market Characteristics
    • Executive Summary - Chart on Market by Geography
    • Executive Summary - Chart on Market Segmentation by Type
    • Executive Summary - Chart on Incremental Growth
    • Executive Summary - Data Table on Incremental Growth
    • Executive Summary - Chart on Company Market Positioning

2 Technavio Analysis

  • 2.1 Analysis of price sensitivity, lifecycle, customer purchase basket, adoption rates, and purchase criteria
    • Analysis of price sensitivity, lifecycle, customer purchase basket, adoption rates, and purchase criteria
  • 2.2 Criticality of inputs and Factors of differentiation
    • Overview on criticality of inputs and factors of differentiation
  • 2.3 Factors of disruption
    • Overview on factors of disruption
  • 2.4 Impact of drivers and challenges
    • Impact of drivers and challenges in 2023 and 2028

3 Market Landscape

  • 3.1 Market ecosystem
    • Parent Market
    • Data Table on - Parent Market
  • 3.2 Market characteristics
    • Market characteristics analysis
  • 3.3 Value chain analysis
    • Value Chain Analysis

4 Market Sizing

  • 4.1 Market definition
    • Offerings of companies included in the market definition
  • 4.2 Market segment analysis
    • Market segments
  • 4.3 Market size 2023
    • 4.4 Market outlook: Forecast for 2023-2028
      • Chart on Global - Market size and forecast 2023-2028 ($ million)
      • Data Table on Global - Market size and forecast 2023-2028 ($ million)
      • Chart on Global Market: Year-over-year growth 2023-2028 (%)
      • Data Table on Global Market: Year-over-year growth 2023-2028 (%)

    5 Historic Market Size

    • 5.1 Global Graphic Film Market 2018 - 2022
      • Historic Market Size - Data Table on Global Graphic Film Market 2018 - 2022 ($ million)
    • 5.2 Type segment analysis 2018 - 2022
      • Historic Market Size - Type Segment 2018 - 2022 ($ million)
    • 5.3 Geography segment analysis 2018 - 2022
      • Historic Market Size - Geography Segment 2018 - 2022 ($ million)
    • 5.4 Country segment analysis 2018 - 2022
      • Historic Market Size - Country Segment 2018 - 2022 ($ million)

    6 Qualitative Analysis

    • 6.1 The AI impact on Global Graphic Film Market

      7 Five Forces Analysis

      • 7.1 Five forces summary
        • Five forces analysis - Comparison between 2023 and 2028
      • 7.2 Bargaining power of buyers
        • Bargaining power of buyers - Impact of key factors 2023 and 2028
      • 7.3 Bargaining power of suppliers
        • Bargaining power of suppliers - Impact of key factors in 2023 and 2028
      • 7.4 Threat of new entrants
        • Threat of new entrants - Impact of key factors in 2023 and 2028
      • 7.5 Threat of substitutes
        • Threat of substitutes - Impact of key factors in 2023 and 2028
      • 7.6 Threat of rivalry
        • Threat of rivalry - Impact of key factors in 2023 and 2028
      • 7.7 Market condition
        • Chart on Market condition - Five forces 2023 and 2028

      8 Market Segmentation by Type

      • 8.1 Market segments
        • Chart on Type - Market share 2023-2028 (%)
        • Data Table on Type - Market share 2023-2028 (%)
      • 8.2 Comparison by Type
        • Chart on Comparison by Type
        • Data Table on Comparison by Type
      • 8.3 Opaque - Market size and forecast 2023-2028
        • Chart on Opaque - Market size and forecast 2023-2028 ($ million)
        • Data Table on Opaque - Market size and forecast 2023-2028 ($ million)
        • Chart on Opaque - Year-over-year growth 2023-2028 (%)
        • Data Table on Opaque - Year-over-year growth 2023-2028 (%)
      • 8.4 Transparent - Market size and forecast 2023-2028
        • Chart on Transparent - Market size and forecast 2023-2028 ($ million)
        • Data Table on Transparent - Market size and forecast 2023-2028 ($ million)
        • Chart on Transparent - Year-over-year growth 2023-2028 (%)
        • Data Table on Transparent - Year-over-year growth 2023-2028 (%)
      • 8.5 Translucent - Market size and forecast 2023-2028
        • Chart on Translucent - Market size and forecast 2023-2028 ($ million)
        • Data Table on Translucent - Market size and forecast 2023-2028 ($ million)
        • Chart on Translucent - Year-over-year growth 2023-2028 (%)
        • Data Table on Translucent - Year-over-year growth 2023-2028 (%)
      • 8.6 Reflective - Market size and forecast 2023-2028
        • Chart on Reflective - Market size and forecast 2023-2028 ($ million)
        • Data Table on Reflective - Market size and forecast 2023-2028 ($ million)
        • Chart on Reflective - Year-over-year growth 2023-2028 (%)
        • Data Table on Reflective - Year-over-year growth 2023-2028 (%)
      • 8.7 Market opportunity by Type
        • Market opportunity by Type ($ million)
        • Data Table on Market opportunity by Type ($ million)

      9 Customer Landscape

      • 9.1 Customer landscape overview
        • Analysis of price sensitivity, lifecycle, customer purchase basket, adoption rates, and purchase criteria

      10 Geographic Landscape

      • 10.1 Geographic segmentation
        • Chart on Market share by geography 2023-2028 (%)
        • Data Table on Market share by geography 2023-2028 (%)
      • 10.2 Geographic comparison
        • Chart on Geographic comparison
        • Data Table on Geographic comparison
      • 10.3 APAC - Market size and forecast 2023-2028
        • Chart on APAC - Market size and forecast 2023-2028 ($ million)
        • Data Table on APAC - Market size and forecast 2023-2028 ($ million)
        • Chart on APAC - Year-over-year growth 2023-2028 (%)
        • Data Table on APAC - Year-over-year growth 2023-2028 (%)
      • 10.4 North America - Market size and forecast 2023-2028
        • Chart on North America - Market size and forecast 2023-2028 ($ million)
        • Data Table on North America - Market size and forecast 2023-2028 ($ million)
        • Chart on North America - Year-over-year growth 2023-2028 (%)
        • Data Table on North America - Year-over-year growth 2023-2028 (%)
      • 10.5 Europe - Market size and forecast 2023-2028
        • Chart on Europe - Market size and forecast 2023-2028 ($ million)
        • Data Table on Europe - Market size and forecast 2023-2028 ($ million)
        • Chart on Europe - Year-over-year growth 2023-2028 (%)
        • Data Table on Europe - Year-over-year growth 2023-2028 (%)
      • 10.6 Middle East and Africa - Market size and forecast 2023-2028
        • Chart on Middle East and Africa - Market size and forecast 2023-2028 ($ million)
        • Data Table on Middle East and Africa - Market size and forecast 2023-2028 ($ million)
        • Chart on Middle East and Africa - Year-over-year growth 2023-2028 (%)
        • Data Table on Middle East and Africa - Year-over-year growth 2023-2028 (%)
      • 10.7 South America - Market size and forecast 2023-2028
        • Chart on South America - Market size and forecast 2023-2028 ($ million)
        • Data Table on South America - Market size and forecast 2023-2028 ($ million)
        • Chart on South America - Year-over-year growth 2023-2028 (%)
        • Data Table on South America - Year-over-year growth 2023-2028 (%)
      • 10.8 US - Market size and forecast 2023-2028
        • Chart on US - Market size and forecast 2023-2028 ($ million)
        • Data Table on US - Market size and forecast 2023-2028 ($ million)
        • Chart on US - Year-over-year growth 2023-2028 (%)
        • Data Table on US - Year-over-year growth 2023-2028 (%)
      • 10.9 China - Market size and forecast 2023-2028
        • Chart on China - Market size and forecast 2023-2028 ($ million)
        • Data Table on China - Market size and forecast 2023-2028 ($ million)
        • Chart on China - Year-over-year growth 2023-2028 (%)
        • Data Table on China - Year-over-year growth 2023-2028 (%)
      • 10.10 Japan - Market size and forecast 2023-2028
        • Chart on Japan - Market size and forecast 2023-2028 ($ million)
        • Data Table on Japan - Market size and forecast 2023-2028 ($ million)
        • Chart on Japan - Year-over-year growth 2023-2028 (%)
        • Data Table on Japan - Year-over-year growth 2023-2028 (%)
      • 10.11 Germany - Market size and forecast 2023-2028
        • Chart on Germany - Market size and forecast 2023-2028 ($ million)
        • Data Table on Germany - Market size and forecast 2023-2028 ($ million)
        • Chart on Germany - Year-over-year growth 2023-2028 (%)
        • Data Table on Germany - Year-over-year growth 2023-2028 (%)
      • 10.12 UK - Market size and forecast 2023-2028
        • Chart on UK - Market size and forecast 2023-2028 ($ million)
        • Data Table on UK - Market size and forecast 2023-2028 ($ million)
        • Chart on UK - Year-over-year growth 2023-2028 (%)
        • Data Table on UK - Year-over-year growth 2023-2028 (%)
      • 10.13 India - Market size and forecast 2023-2028
        • Chart on India - Market size and forecast 2023-2028 ($ million)
        • Data Table on India - Market size and forecast 2023-2028 ($ million)
        • Chart on India - Year-over-year growth 2023-2028 (%)
        • Data Table on India - Year-over-year growth 2023-2028 (%)
      • 10.14 Canada - Market size and forecast 2023-2028
        • Chart on Canada - Market size and forecast 2023-2028 ($ million)
        • Data Table on Canada - Market size and forecast 2023-2028 ($ million)
        • Chart on Canada - Year-over-year growth 2023-2028 (%)
        • Data Table on Canada - Year-over-year growth 2023-2028 (%)
      • 10.15 Australia - Market size and forecast 2023-2028
        • Chart on Australia - Market size and forecast 2023-2028 ($ million)
        • Data Table on Australia - Market size and forecast 2023-2028 ($ million)
        • Chart on Australia - Year-over-year growth 2023-2028 (%)
        • Data Table on Australia - Year-over-year growth 2023-2028 (%)
      • 10.16 France - Market size and forecast 2023-2028
        • Chart on France - Market size and forecast 2023-2028 ($ million)
        • Data Table on France - Market size and forecast 2023-2028 ($ million)
        • Chart on France - Year-over-year growth 2023-2028 (%)
        • Data Table on France - Year-over-year growth 2023-2028 (%)
      • 10.17 Italy - Market size and forecast 2023-2028
        • Chart on Italy - Market size and forecast 2023-2028 ($ million)
        • Data Table on Italy - Market size and forecast 2023-2028 ($ million)
        • Chart on Italy - Year-over-year growth 2023-2028 (%)
        • Data Table on Italy - Year-over-year growth 2023-2028 (%)
      • 10.18 Market opportunity by geography
        • Market opportunity by geography ($ million)
        • Data Tables on Market opportunity by geography ($ million)

      11 Drivers, Challenges, and Opportunity/Restraints

      • 11.1 Market drivers
        • 11.2 Market challenges
          • 11.3 Impact of drivers and challenges
            • Impact of drivers and challenges in 2023 and 2028
          • 11.4 Market opportunities/restraints

            12 Competitive Landscape

            • 12.1 Overview
              • 12.2 Competitive Landscape
                • Overview on criticality of inputs and factors of differentiation
              • 12.3 Landscape disruption
                • Overview on factors of disruption
              • 12.4 Industry risks
                • Impact of key risks on business

              13 Competitive Analysis

              • 13.1 Companies profiled
                • Companies covered
              • 13.2 Company ranking index
                • Company ranking index
              • 13.3 Market positioning of companies
                • Matrix on companies position and classification
              • 3M Co.
                • 3M Co. - Overview
                • 3M Co. - Business segments
                • 3M Co. - Key news
                • 3M Co. - Key offerings
                • 3M Co. - Segment focus
                • SWOT
              • 13.5 Achilles Corp.
                • Achilles Corp. - Overview
                • Achilles Corp. - Product / Service
                • Achilles Corp. - Key offerings
                • SWOT
              • 13.6 Avery Dennison Corp.
                • Avery Dennison Corp. - Overview
                • Avery Dennison Corp. - Business segments
                • Avery Dennison Corp. - Key news
                • Avery Dennison Corp. - Key offerings
                • Avery Dennison Corp. - Segment focus
                • SWOT
              • 13.7 CCL Industries Corp.
                • CCL Industries Corp. - Overview
                • CCL Industries Corp. - Product / Service
                • CCL Industries Corp. - Key offerings
                • SWOT
              • 13.8 Constantia Flexibles Group GmbH
                • Constantia Flexibles Group GmbH - Overview
                • Constantia Flexibles Group GmbH - Product / Service
                • Constantia Flexibles Group GmbH - Key offerings
                • SWOT
              • 13.9 Drytac Corp.
                • Drytac Corp. - Overview
                • Drytac Corp. - Product / Service
                • Drytac Corp. - Key offerings
                • SWOT
              • 13.10 Dunmore Corp.
                • Dunmore Corp. - Overview
                • Dunmore Corp. - Product / Service
                • Dunmore Corp. - Key news
                • Dunmore Corp. - Key offerings
                • SWOT
              • 13.11 DuPont de Nemours Inc.
                • DuPont de Nemours Inc. - Overview
                • DuPont de Nemours Inc. - Business segments
                • DuPont de Nemours Inc. - Key news
                • DuPont de Nemours Inc. - Key offerings
                • DuPont de Nemours Inc. - Segment focus
                • SWOT
              • 13.12 FDC Graphic Films Inc.
                • FDC Graphic Films Inc. - Overview
                • FDC Graphic Films Inc. - Product / Service
                • FDC Graphic Films Inc. - Key offerings
                • SWOT
              • 13.13 HEXIS SAS
                • HEXIS SAS - Overview
                • HEXIS SAS - Product / Service
                • HEXIS SAS - Key offerings
                • SWOT

              14 Appendix

              • 14.1 Scope of the report
                • 14.2 Inclusions and exclusions checklist
                  • Inclusions checklist
                  • Exclusions checklist
                • 14.3 Currency conversion rates for US$
                  • Currency conversion rates for US$
                • 14.4 Research methodology
                  • Research methodology
                • 14.5 Data procurement
                  • Information sources
                • 14.6 Data validation
                  • Data validation
                • 14.7 Validation techniques employed for market sizing
                  • Validation techniques employed for market sizing
                • 14.8 Data synthesis
                  • Data synthesis
                • 14.9 360 degree market analysis
                  • 360 degree market analysis
                • 14.10 List of abbreviations
                  • List of abbreviations

                Research Methodology

                Technavio presents a detailed picture of the market by way of study, synthesis, and summation of data from multiple sources. The analysts have presented the various facets of the market with a particular focus on identifying the key industry influencers. The data thus presented is comprehensive, reliable, and the result of extensive research, both primary and secondary.

                INFORMATION SOURCES

                Primary sources

                • Manufacturers and suppliers
                • Channel partners
                • Industry experts
                • Strategic decision makers

                Secondary sources

                • Industry journals and periodicals
                • Government data
                • Financial reports of key industry players
                • Historical data
                • Press releases

                DATA ANALYSIS

                Data Synthesis

                • Collation of data
                • Estimation of key figures
                • Analysis of derived insights

                Data Validation

                • Triangulation with data models
                • Reference against proprietary databases
                • Corroboration with industry experts

                REPORT WRITING

                Qualitative

                • Market drivers
                • Market challenges
                • Market trends
                • Five forces analysis

                Quantitative

                • Market size and forecast
                • Market segmentation
                • Geographical insights
                • Competitive landscape

                Interested in this report?

                Get your sample now to see our research methodology and insights!

                Download Now

                Frequently Asked Questions

                Graphic Film market growth will increase by $ 8859.2 mn during 2024-2028 .

                The Graphic Film market is expected to grow at a CAGR of 6.1% during 2024-2028 .

                Graphic Film market is segmented by Type( Opaque, Transparent, Translucent, Reflective)

                3M Co., Achilles Corp., Arlon Graphics LLC, Aura Brand Solutions Ltd., Avery Dennison Corp., CCL Industries Corp., Constantia Flexibles Group GmbH, Drytac Corp., Dunmore Corp., DuPont de Nemours Inc., FDC Graphic Films Inc., FLEXcon Co. Inc., HEXIS SAS, Innovia Films, Nekoosa Inc., ORAFOL Europe GmbH, RITRAMA Spa, Schweitzer Mauduit International Inc., Taghleef Industries SpA, The Griff Network are a few of the key vendors in the Graphic Film market.

                APAC will register the highest growth rate of 40% among the other regions. Therefore, the Graphic Film market in APAC is expected to garner significant business opportunities for the vendors during the forecast period.

                US, China, Japan, Germany, UK, India, Australia, Canada, France, Italy

                • Increased demand for barrier packagingBarrier packaging is required to protect product quality and integrity. It protects the product from the infusion of water is the driving factor this market.
                • light is the driving factor this market.
                • moisture is the driving factor this market.
                • oil is the driving factor this market.
                • aroma is the driving factor this market.
                • and flavor is the driving factor this market.
                • as a products quality and formulation can be negatively impacted due to the leakage of these substances out of the package. Barrier packaging is gaining popularity in the form of flexible plastic films in various end-user industries is the driving factor this market.
                • such as food is the driving factor this market.
                • pharmaceuticals is the driving factor this market.
                • textiles is the driving factor this market.
                • and automotive. The food and pharmaceutical industries are among the largest markets for plastic film packaging is the driving factor this market.
                • as products from these industries require extra protection to maintain their integrity and shelf life. Furthermore is the driving factor this market.
                • the market share of transparent barrier packaging films is increasing as they are used to manufacture different packaging products such as clamshell packaging is the driving factor this market.
                • skin packaging is the driving factor this market.
                • windowed packaging is the driving factor this market.
                • and other packaging products such as blister packaging and wrapping cups and trays.Clamshell packaging is highly demanded by frozen food and fruit and vegetable packaging by the market. PVC-based clamshell packaging is preferred for fruit and vegetable packaging is the driving factor this market.
                • whereas for frozen food packaging is the driving factor this market.
                • polyvinylidene chloride (PVDC)-coated clamshells are a better choice. PVDC is preferred for frozen food as it shows higher barrier properties at lower temperatures. As the global demand for packed fruits and vegetables is expected to reach more than 800 million tons across the globe during the forecast period is the driving factor this market.
                • it will drive the clamshell packaging market. Furthermore is the driving factor this market.
                • skin packaging is also one of the most common packaging materials used for pharmaceuticals and food products such as lunchmeat is the driving factor this market.
                • bacon is the driving factor this market.
                • sausage is the driving factor this market.
                • and seafood is the driving factor this market.
                • which are particularly in an irregular shape. Sealed air is the driving factor this market.
                • a leading provider of packaging solutions is the driving factor this market.
                • provides Cryovac 10K vacuum skin packaging for fresh seafood products. Similarly is the driving factor this market.
                • it has come up with an innovative packaging called Darfresh vacuum packaging for ensuring the extended shelf life of poultry products.In addition is the driving factor this market.
                • plastic packaging companies are introducing advanced barrier packaging plastic films such as isotropic films is the driving factor this market.
                • breathable films is the driving factor this market.
                • transparent high barrier films is the driving factor this market.
                • and metalized barrier films. For instance is the driving factor this market.
                • Ester is the driving factor this market.
                • a leading supplier of PE films is the driving factor this market.
                • provides a wide range of plastic films. It offers Ester transparent high barrier film-EBD is the driving factor this market.
                • with high transparency is the driving factor this market.
                • high oxygen barrier is the driving factor this market.
                • and attractive visual appearance. Thus is the driving factor this market.
                • growing innovations in barrier packaging are expected to drive the global graphic film market during the forecast period. is the driving factor this market.

                The Graphic Film market vendors should focus on grabbing business opportunities from the Opaque segment as it accounted for the largest market share in the base year.