Graphite Electrode Market Analysis APAC, Europe, North America, South America, Middle East and Africa - US, China, India, Japan, Germany - Size and Forecast 2024-2028

Graphite Electrode Market Analysis APAC, Europe, North America, South America, Middle East and Africa - US, China, India, Japan, Germany - Size and Forecast 2024-2028

Published: Feb 2024 162 Pages SKU: IRTNTR44654

Market Overview at a Glance

$1.23 B
Market Opportunity
3.94%
CAGR
4.28
YoY growth 2023-2024(%)

Graphite Electrode Market Size 2024-2028

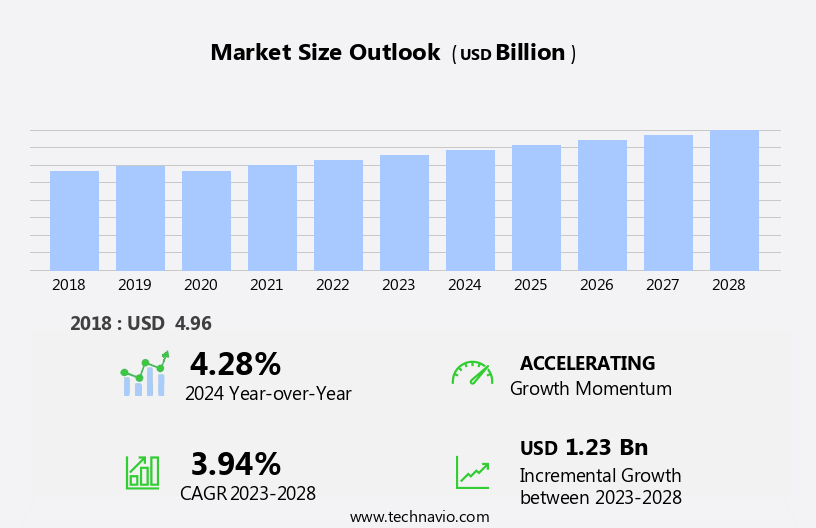
The graphite electrode market size is forecast to increase by USD 1.23 billion, at a CAGR of 3.94% between 2023 and 2028.

  • The market is driven by the surging demand for high-quality steel, particularly in the electric arc furnace (EAF) process. This trend is attributed to the increasing production of automobiles and construction materials, which necessitate the use of superior steel. However, the market is characterized by its capital-intensive nature, which poses a significant challenge for new entrants. The high initial investment required for setting up graphite electrode manufacturing facilities can deter potential competitors, creating a relatively stable market landscape. Despite this challenge, opportunities exist for companies to innovate and optimize production processes to reduce costs and improve efficiency.
  • Additionally, the ongoing research and development efforts in the field of advanced materials, such as high-performance graphite electrodes, present growth opportunities for market participants. Companies seeking to capitalize on these opportunities must navigate the capital-intensive nature of the market and stay abreast of technological advancements to maintain a competitive edge.

What will be the Size of the Graphite Electrode Market during the forecast period?

Graphite Electrode Market Size

Explore in-depth regional segment analysis with market size data - historical 2018-2022 and forecasts 2024-2028 - in the full report.  
Request Free Sample

The market continues to evolve, driven by the dynamic interplay of various sectors and technological advancements. In the realm of energy storage, graphite electrodes play a pivotal role in the production of lithium-ion and lithium metal batteries. These batteries, in turn, power electric vehicles (EVs) and renewable energy systems, such as wind and solar power. The market's ongoing evolution is characterized by a focus on improving temperature performance, ensuring quality control, and adhering to safety standards. The quest for higher energy density and longer cycle life propels innovation in anode materials, power electronics, and electrode coating technologies. Data science and artificial intelligence (AI) are increasingly integrated into the manufacturing process, optimizing production capacity and reducing costs through process optimization and predictive maintenance.

Solid-state batteries and silicon anodes are emerging as potential game-changers, offering enhanced power output and faster charging capabilities. The market's continuous unfolding is further shaped by regulatory compliance, raw materials availability, and the circular economy's growing importance. Carbon fiber, internal resistance, charging infrastructure, and battery recycling are among the various aspects under scrutiny as the industry strives for sustainability and cost reduction. The interconnected nature of the market's components – from material science and cathode material to battery safety, cell manufacturing, and thermal management – necessitates a holistic approach to understanding its intricacies. The supply chain, big data analytics, and machine learning (ML) are crucial elements in this complex ecosystem, ensuring the efficient and effective delivery of high-performance graphite electrodes to meet the evolving demands of diverse industries.

How is this Graphite Electrode Industry segmented?

The graphite electrode industry research report provides comprehensive data (region-wise segment analysis), with forecasts and estimates in "USD billion" for the period 2024-2028, as well as historical data from 2018-2022 for the following segments.

  • Product
    • UHP graphite electrode
    • HP graphite electrode
    • RP graphite electrode
  • Application
    • Ferrous metals
    • Non-ferrous metals
  • Geography
    • North America
      • US
    • Europe
      • Germany
    • APAC
      • China
      • India
      • Japan
    • Rest of World (ROW)

    By Product Insights

    The uhp graphite electrode segment is estimated to witness significant growth during the forecast period.

    The market is driven by the increasing demand for ultra-high-power graphite electrodes in the electric arc furnace (EAF) industry for steel recycling. These electrodes, which are primarily composed of high-value needle coke derived from petroleum or coal tar, are machined into cylindrical shapes with threaded areas at each end for assembly into electrode columns using electrode nozzles. To enhance work efficiency and reduce total costs, large-capacity and ultra-high-voltage EAFs are gaining popularity. Consequently, graphite electrodes with diameters exceeding 500 mm are expected to dominate the market during the forecast period. In the realm of renewable energy, graphite electrodes play a crucial role in power electronics, lithium-ion and lithium metal batteries, and solid-state batteries.

    The manufacturing process involves stringent quality control measures to ensure optimal energy density, cycle life, safety standards, and power output. Raw materials, such as anode and cathode materials, carbon fiber, and silicon anode, are subjected to rigorous testing and optimization for cost reduction and improved performance. Digital technologies, including data science, machine learning, and artificial intelligence, are employed to enhance manufacturing processes, optimize production capacity, and improve battery safety. Regulatory compliance, thermal management, and supply chain efficiency are also critical factors influencing market trends. Additionally, the circular economy and battery recycling are gaining importance as sustainability becomes a key consideration in the energy sector.

    Graphite Electrode Market Size

    Request Free Sample

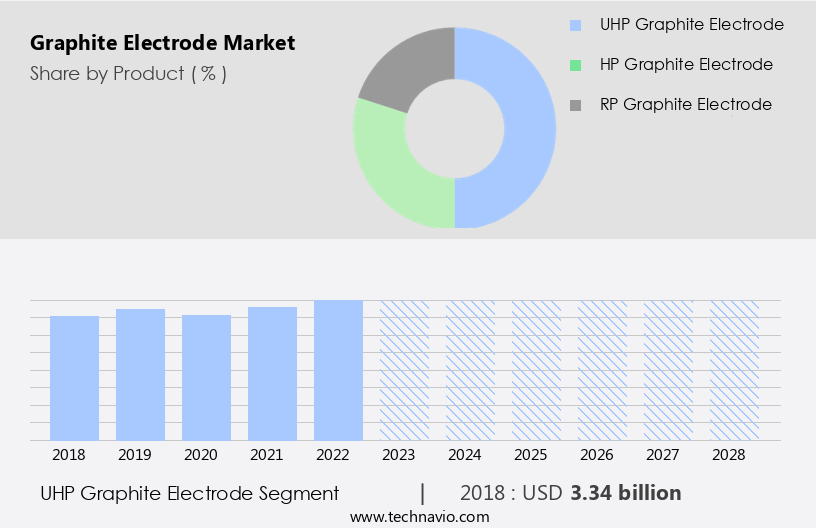
    The UHP graphite electrode segment was valued at USD 3.34 billion in 2018 and showed a gradual increase during the forecast period.

    Regional Analysis

    APAC is estimated to contribute 56% to the growth of the global market during the forecast period.Technavio’s analysts have elaborately explained the regional trends and drivers that shape the market during the forecast period.

    Graphite Electrode Market Share by Geography

     Request Free Sample

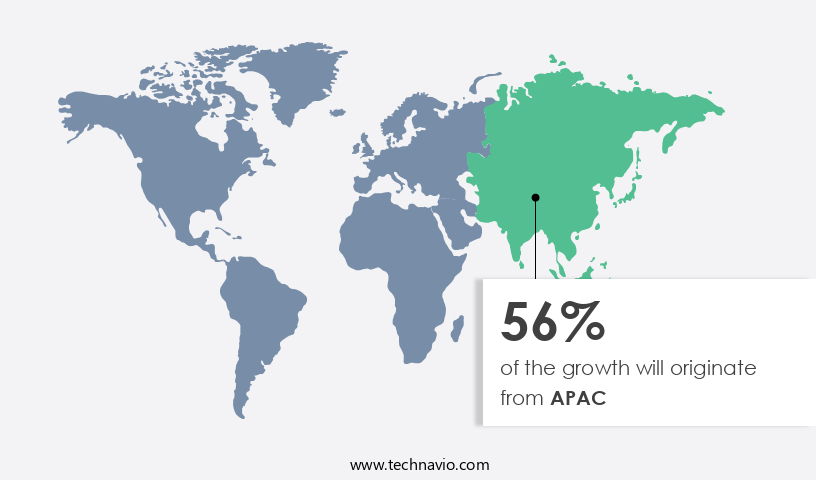
    The market in APAC is experiencing significant growth due to several factors. The increasing urban population and resulting construction boom are primary drivers, as the demand for graphite electrodes is high in the building and infrastructure sectors. Additionally, government initiatives for infrastructure development and the entry of automobile manufacturers are boosting market growth. Renewable energy sources, such as wind and solar power, are also fueling the market's expansion, as graphite electrodes are essential in the production of lithium-ion batteries used in renewable energy storage. Quality control and safety standards are crucial considerations in the manufacturing process, with companies focusing on process optimization and raw material sourcing to ensure high-quality electrodes.

    Lithium-ion batteries, including lithium metal batteries, are a significant application area for graphite electrodes, and advancements in material science and battery technology are driving innovation. The market is also witnessing trends such as cost reduction through process optimization and the adoption of digital technologies like data science, machine learning, and artificial intelligence to improve production efficiency and battery performance. Additionally, the circular economy and battery recycling are gaining importance, with companies focusing on reducing carbon footprints and improving battery safety through cell manufacturing, thermal management, and supply chain optimization. Fast charging, power electronics, and self-discharge rate are critical performance factors for graphite electrodes, and companies are investing in research and development to address these challenges.

    The market is also witnessing the emergence of solid-state batteries and the use of silicon anodes, which offer higher energy density and longer cycle life. In conclusion, the market in APAC is experiencing robust growth, driven by urbanization, industrialization, and government initiatives. The market is witnessing trends such as innovation in battery technology, digitalization, and sustainability, making it an exciting space for companies and investors alike.

    Market Dynamics

    Our researchers analyzed the data with 2023 as the base year, along with the key drivers, trends, and challenges. A holistic analysis of drivers will help companies refine their marketing strategies to gain a competitive advantage.

    What are the key market drivers leading to the rise in the adoption of Graphite Electrode Industry?

    • The market is primarily fueled by the heightened demand for superior quality steel, which is a crucial factor driving its growth. 

    • The market is experiencing significant growth due to the increasing demand for steel in various industries, including building and construction, automotive, aviation, and oil and gas. Graphite electrodes, a crucial component in the smelting process for high-quality steel production, are valued for their high electrical conductivity, heat dissipation capacity, and excellent mechanical strength. The shift towards renewable energy sources, such as wind power and solar power, is also driving market growth. Graphite electrodes play a vital role in the manufacturing process of renewable energy technologies, particularly in the production of silicon and solar-grade silicon.
    • Their high energy density, long cycle life, and safety standards compliance make them an ideal choice for these applications. Moreover, the increasing focus on regulatory compliance and process optimization in industries is expected to further boost market growth. Electric vehicles (EVs) are another emerging application area for graphite electrodes, as they require high-performance batteries with long cycle life and excellent temperature performance. The market is expected to continue its growth trajectory during the forecast period, driven by these factors and the increasing demand for steel in various industries.

    What are the market trends shaping the Graphite Electrode Industry?

    • The growing preference for Electric Arc Furnaces (EAF) represents a significant market trend in the metallurgical industry. This shift towards EAF technology is driven by its numerous advantages, including energy efficiency, cost savings, and reduced environmental impact.

    • The market is experiencing significant growth due to the increasing adoption of electric arc furnaces (EAF) in steel manufacturing. EAFs offer advantages such as lower establishment costs, higher production flexibility, and reduced carbon dioxide emissions, making them a preferred choice over traditional blast and ladle furnaces. As the demand for steel continues to rise, the need for efficient graphite electrodes to support EAF processes will increase, driving market growth. Beyond steel manufacturing, graphite electrodes are also used in various other applications, including power electronics and the production of non-ferrous materials. In the realm of energy storage, graphite electrodes are essential components in lithium-ion batteries and emerging lithium metal batteries.
    • These batteries are gaining popularity due to their high power output and potential for cost reduction. Advancements in technology, such as the development of solid-state batteries and silicon anodes, are further enhancing the market potential for graphite electrodes. Additionally, electrode coatings and artificial intelligence (AI) are being employed to improve efficiency and reduce self-discharge rates. These advancements underscore the market's dynamic nature and the ongoing efforts to optimize graphite electrode performance.

    What challenges does the Graphite Electrode Industry face during its growth?

    • The capital-intensive character of the market poses a significant challenge to the industry's growth trajectory. 

    • The market is characterized by its technology-intensive and capital-heavy nature, resulting in an oligopolistic industry structure with minimal new entrant threats. Manufacturers are progressively moving from blast and ladle furnaces to Electric Arc Furnaces (EAF) due to advanced technology adoption. Establishing production facilities demands significant capital investment, which can be a challenge for small and medium-sized steel producers with limited financial resources. This constraint hampers their transition from conventional steelmaking methods. Material science plays a crucial role in the production of high-quality cathode materials for graphite electrodes, which are essential for battery manufacturing. The growing emphasis on battery recycling and fast charging infrastructure necessitates the development of graphite electrodes with lower internal resistance and improved charging efficiency.
    • Carbon fiber, a key component in graphite electrodes, is gaining popularity due to its superior properties, such as high strength and low weight. Module testing and pack assembly are critical processes in the production of lithium-ion batteries, and graphite electrodes serve as current collectors. As the demand for batteries with smaller carbon footprints grows, manufacturers are focusing on reducing the environmental impact of graphite electrode production. This involves adopting sustainable production methods and investing in research and development to improve the efficiency and reduce the environmental impact of the manufacturing process.

    Exclusive Customer Landscape

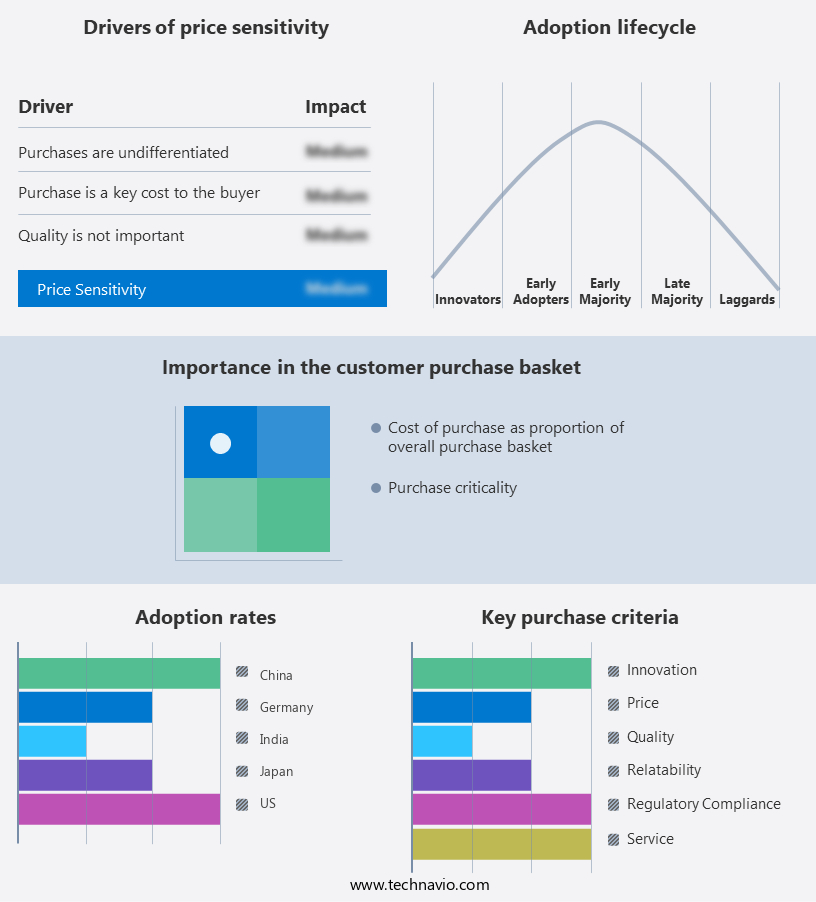
    The graphite electrode market forecasting report includes the adoption lifecycle of the market, covering from the innovator’s stage to the laggard’s stage. It focuses on adoption rates in different regions based on penetration. Furthermore, the graphite electrode market report also includes key purchase criteria and drivers of price sensitivity to help companies evaluate and develop their market growth analysis strategies.

    Graphite Electrode Market Share by Geography

     Customer Landscape

    Key Companies & Market Insights

    Companies are implementing various strategies, such as strategic alliances, graphite electrode market forecast, partnerships, mergers and acquisitions, geographical expansion, and product/service launches, to enhance their presence in the industry.

    Agilent Technologies Inc. - Graphite electrodes, including those used in Graphite Furnace Atomic Absorption Spectroscopy (GFAAS), deliver optimal performance by ensuring excellent electrical contact. This crucial aspect prolongs tube life, enhancing overall efficiency and effectiveness in various industrial applications.

    The industry research and growth report includes detailed analyses of the competitive landscape of the market and information about key companies, including:

    • Agilent Technologies Inc.
    • AMERI SOURCE SPECIALITY PRODUCTS
    • Brothers International Industry
    • China BaoWu Steel Group Corp. Ltd.
    • CIMM Group
    • Dan Carbon
    • EDM TEC oHG
    • El 6
    • Fangda Carbon New Materials Technology Co. Ltd.
    • GrafTech International Ltd.
    • Graphite India Ltd.
    • HEG Ltd.
    • Kaifeng Pingmei New Carbon Material Technology Co. Ltd.
    • Nippon Carbon Co. Ltd.
    • Oriental Carbon and Chemicals Ltd.
    • Resonac Holdings Corp.
    • Sangraf International
    • SEC CARBON LTD.
    • Tokai Carbon Co. Ltd.
    • Weaver Industries Inc.
    • ZHENGZHOU RONGSHENG REFRACTORY CO. LTD.

    Qualitative and quantitative analysis of companies has been conducted to help clients understand the wider business environment as well as the strengths and weaknesses of key industry players. Data is qualitatively analyzed to categorize companies as pure play, category-focused, industry-focused, and diversified; it is quantitatively analyzed to categorize companies as dominant, leading, strong, tentative, and weak.

    Recent Development and News in Graphite Electrode Market

    • In January 2024, leading graphite electrode manufacturer, GrafTech International Ltd., announced the launch of its new high-performance graphite electrodes for electric arc furnace applications, featuring enhanced durability and longer lifespan. This innovation aimed to address the increasing demand for energy efficiency and cost reduction in the steel industry (GrafTech International Press Release).
    • In March 2024, SGL Carbon, a global leader in the production of carbon-based solutions, and Sumitomo Electric Industries, Ltd., a major Japanese technology enterprise, entered into a strategic partnership to jointly develop and commercialize advanced graphite electrodes for the steel industry. This collaboration aimed to leverage each company's expertise and expand their market reach (SGL Carbon Press Release).
    • In July 2024, Imerys Graphite & Carbon, a global leader in mineral-based specialty solutions, completed the acquisition of Carbon Solutions, a US-based graphite electrode manufacturer. This acquisition strengthened Imerys' position in the market and expanded its production capacity (Imerys Press Release).
    • In May 2025, the European Union (EU) approved the use of synthetic graphite electrodes in electric arc furnaces, marking a significant regulatory milestone. This approval is expected to accelerate the adoption of synthetic graphite electrodes in the EU steel industry, offering improved performance and reduced environmental impact (European Commission Press Release).

    Research Analyst Overview

    • The market encompasses various applications, including electric trucks, portable power, and industrial automation. Material characterization and cell chemistry play crucial roles in enhancing energy efficiency and battery performance. Recycling technologies and responsible sourcing are key trends, reducing the cost of ownership and environmental impact. Galvanostatic charge-discharge, battery modeling, and optimization algorithms are essential for improving battery life and performance. Battery aging, failure analysis, and battery degradation are ongoing challenges, necessitating advanced testing and process control. Sustainable sourcing, supply chain transparency, and waste management are vital in mitigating environmental concerns. Smart manufacturing, military applications, aerospace, and medical industries are adopting graphite electrodes for their unique properties.
    • Electric buses and green energy sectors are growing markets, driving demand for high-performance graphite electrodes. Battery testing and fault detection are crucial for ensuring safety and reliability, especially in the context of thermal runaway risks. Carbon emissions reduction and industrial automation are significant applications, contributing to the market's growth. Blockchain technology and battery pack design are emerging areas of interest, offering potential for increased transparency and optimization. Cyclic voltammetry (CV) and other advanced techniques contribute to understanding battery behavior and improving overall performance. Overall, the market is dynamic, with ongoing research and innovation addressing various challenges and opportunities.

    Dive into Technavio’s robust research methodology, blending expert interviews, extensive data synthesis, and validated models for unparalleled Graphite Electrode Market insights. See full methodology.

    Market Scope

    Report Coverage

    Details

    Page number

    162

    Base year

    2023

    Historic period

    2018-2022

    Forecast period

    2024-2028

    Growth momentum & CAGR

    Accelerate at a CAGR of 3.94%

    Market growth 2024-2028

    USD 1.23 billion

    Market structure

    Concentrated

    YoY growth 2023-2024(%)

    4.28

    Key countries

    US, China, India, Japan, and Germany

    Competitive landscape

    Leading Companies, Market Positioning of Companies, Competitive Strategies, and Industry Risks

    Request Free Sample

    What are the Key Data Covered in this Graphite Electrode Market Research and Growth Report?

    • CAGR of the Graphite Electrode industry during the forecast period
    • Detailed information on factors that will drive the growth and forecasting between 2024 and 2028
    • Precise estimation of the size of the market and its contribution of the industry in focus to the parent market
    • Accurate predictions about upcoming growth and trends and changes in consumer behaviour
    • Growth of the market across APAC, Europe, North America, South America, and Middle East and Africa
    • Thorough analysis of the market’s competitive landscape and detailed information about companies
    • Comprehensive analysis of factors that will challenge the graphite electrode market growth of industry companies

    We can help! Our analysts can customize this graphite electrode market research report to meet your requirements.

    Get in touch


    1 Executive Summary

    • 1.1 Market overview
      • Exhibit 01: Executive Summary – Chart on Market Overview
      • Exhibit 02: Executive Summary – Data Table on Market Overview
      • Exhibit 03: Executive Summary – Chart on Global Market Characteristics
      • Exhibit 04: Executive Summary – Chart on Market by Geography
      • Exhibit 05: Executive Summary – Chart on Market Segmentation by Product
      • Exhibit 06: Executive Summary – Chart on Market Segmentation by Application
      • Exhibit 07: Executive Summary – Chart on Incremental Growth
      • Exhibit 08: Executive Summary – Data Table on Incremental Growth
      • Exhibit 09: Executive Summary – Chart on Vendor Market Positioning

    2 Market Landscape

    • 2.1 Market ecosystem
      • Exhibit 10: Parent market
      • Exhibit 11: Market Characteristics

    3 Market Sizing

    • 3.1 Market definition
      • Exhibit 12: Offerings of vendors included in the market definition
    • 3.2 Market segment analysis
      • Exhibit 13: Market segments
    • 3.3 Market size 2023
      • 3.4 Market outlook: Forecast for 2023-2028
        • Exhibit 14: Chart on Global - Market size and forecast 2023-2028 ($ billion)
        • Exhibit 15: Data Table on Global - Market size and forecast 2023-2028 ($ billion)
        • Exhibit 16: Chart on Global Market: Year-over-year growth 2023-2028 (%)
        • Exhibit 17: Data Table on Global Market: Year-over-year growth 2023-2028 (%)

      4 Historic Market Size

      • 4.1 Global graphite electrode market 2018 - 2022
        • Exhibit 18: Historic Market Size – Data Table on global graphite electrode market 2018 - 2022 ($ billion)
      • 4.2 Product Segment Analysis 2018 - 2022
        • Exhibit 19: Historic Market Size – Product Segment 2018 - 2022 ($ billion)
      • 4.3 Application Segment Analysis 2018 - 2022
        • Exhibit 20: Historic Market Size – Application Segment 2018 - 2022 ($ billion)
      • 4.4 Geography Segment Analysis 2018 - 2022
        • Exhibit 21: Historic Market Size – Geography Segment 2018 - 2022 ($ billion)
      • 4.5 Country Segment Analysis 2018 - 2022
        • Exhibit 22: Historic Market Size – Country Segment 2018 - 2022 ($ billion)

      5 Five Forces Analysis

      • 5.1 Five forces summary
        • Exhibit 23: Five forces analysis - Comparison between 2023 and 2028
      • 5.2 Bargaining power of buyers
        • Exhibit 24: Chart on Bargaining power of buyers – Impact of key factors 2023 and 2028
      • 5.3 Bargaining power of suppliers
        • Exhibit 25: Bargaining power of suppliers – Impact of key factors in 2023 and 2028
      • 5.4 Threat of new entrants
        • Exhibit 26: Threat of new entrants – Impact of key factors in 2023 and 2028
      • 5.5 Threat of substitutes
        • Exhibit 27: Threat of substitutes – Impact of key factors in 2023 and 2028
      • 5.6 Threat of rivalry
        • Exhibit 28: Threat of rivalry – Impact of key factors in 2023 and 2028
      • 5.7 Market condition
        • Exhibit 29: Chart on Market condition - Five forces 2023 and 2028

      6 Market Segmentation by Product

      • 6.1 Market segments
        • Exhibit 30: Chart on Product - Market share 2023-2028 (%)
        • Exhibit 31: Data Table on Product - Market share 2023-2028 (%)
      • 6.2 Comparison by Product
        • Exhibit 32: Chart on Comparison by Product
        • Exhibit 33: Data Table on Comparison by Product
      • 6.3 UHP graphite electrode - Market size and forecast 2023-2028
        • Exhibit 34: Chart on UHP graphite electrode - Market size and forecast 2023-2028 ($ billion)
        • Exhibit 35: Data Table on UHP graphite electrode - Market size and forecast 2023-2028 ($ billion)
        • Exhibit 36: Chart on UHP graphite electrode - Year-over-year growth 2023-2028 (%)
        • Exhibit 37: Data Table on UHP graphite electrode - Year-over-year growth 2023-2028 (%)
      • 6.4 HP graphite electrode - Market size and forecast 2023-2028
        • Exhibit 38: Chart on HP graphite electrode - Market size and forecast 2023-2028 ($ billion)
        • Exhibit 39: Data Table on HP graphite electrode - Market size and forecast 2023-2028 ($ billion)
        • Exhibit 40: Chart on HP graphite electrode - Year-over-year growth 2023-2028 (%)
        • Exhibit 41: Data Table on HP graphite electrode - Year-over-year growth 2023-2028 (%)
      • 6.5 RP graphite electrode - Market size and forecast 2023-2028
        • Exhibit 42: Chart on RP graphite electrode - Market size and forecast 2023-2028 ($ billion)
        • Exhibit 43: Data Table on RP graphite electrode - Market size and forecast 2023-2028 ($ billion)
        • Exhibit 44: Chart on RP graphite electrode - Year-over-year growth 2023-2028 (%)
        • Exhibit 45: Data Table on RP graphite electrode - Year-over-year growth 2023-2028 (%)
      • 6.6 Market opportunity by Product
        • Exhibit 46: Market opportunity by Product ($ billion)
        • Exhibit 47: Data Table on Market opportunity by Product ($ billion)

      7 Market Segmentation by Application

      • 7.1 Market segments
        • Exhibit 48: Chart on Application - Market share 2023-2028 (%)
        • Exhibit 49: Data Table on Application - Market share 2023-2028 (%)
      • 7.2 Comparison by Application
        • Exhibit 50: Chart on Comparison by Application
        • Exhibit 51: Data Table on Comparison by Application
      • 7.3 Ferrous metals - Market size and forecast 2023-2028
        • Exhibit 52: Chart on Ferrous metals - Market size and forecast 2023-2028 ($ billion)
        • Exhibit 53: Data Table on Ferrous metals - Market size and forecast 2023-2028 ($ billion)
        • Exhibit 54: Chart on Ferrous metals - Year-over-year growth 2023-2028 (%)
        • Exhibit 55: Data Table on Ferrous metals - Year-over-year growth 2023-2028 (%)
      • 7.4 Non-ferrous metals - Market size and forecast 2023-2028
        • Exhibit 56: Chart on Non-ferrous metals - Market size and forecast 2023-2028 ($ billion)
        • Exhibit 57: Data Table on Non-ferrous metals - Market size and forecast 2023-2028 ($ billion)
        • Exhibit 58: Chart on Non-ferrous metals - Year-over-year growth 2023-2028 (%)
        • Exhibit 59: Data Table on Non-ferrous metals - Year-over-year growth 2023-2028 (%)
      • 7.5 Market opportunity by Application
        • Exhibit 60: Market opportunity by Application ($ billion)
        • Exhibit 61: Data Table on Market opportunity by Application ($ billion)

      8 Customer Landscape

      • 8.1 Customer landscape overview
        • Exhibit 62: Analysis of price sensitivity, lifecycle, customer purchase basket, adoption rates, and purchase criteria

      9 Geographic Landscape

      • 9.1 Geographic segmentation
        • Exhibit 63: Chart on Market share by geography 2023-2028 (%)
        • Exhibit 64: Data Table on Market share by geography 2023-2028 (%)
      • 9.2 Geographic comparison
        • Exhibit 65: Chart on Geographic comparison
        • Exhibit 66: Data Table on Geographic comparison
      • 9.3 APAC - Market size and forecast 2023-2028
        • Exhibit 67: Chart on APAC - Market size and forecast 2023-2028 ($ billion)
        • Exhibit 68: Data Table on APAC - Market size and forecast 2023-2028 ($ billion)
        • Exhibit 69: Chart on APAC - Year-over-year growth 2023-2028 (%)
        • Exhibit 70: Data Table on APAC - Year-over-year growth 2023-2028 (%)
      • 9.4 Europe - Market size and forecast 2023-2028
        • Exhibit 71: Chart on Europe - Market size and forecast 2023-2028 ($ billion)
        • Exhibit 72: Data Table on Europe - Market size and forecast 2023-2028 ($ billion)
        • Exhibit 73: Chart on Europe - Year-over-year growth 2023-2028 (%)
        • Exhibit 74: Data Table on Europe - Year-over-year growth 2023-2028 (%)
      • 9.5 North America - Market size and forecast 2023-2028
        • Exhibit 75: Chart on North America - Market size and forecast 2023-2028 ($ billion)
        • Exhibit 76: Data Table on North America - Market size and forecast 2023-2028 ($ billion)
        • Exhibit 77: Chart on North America - Year-over-year growth 2023-2028 (%)
        • Exhibit 78: Data Table on North America - Year-over-year growth 2023-2028 (%)
      • 9.6 South America - Market size and forecast 2023-2028
        • Exhibit 79: Chart on South America - Market size and forecast 2023-2028 ($ billion)
        • Exhibit 80: Data Table on South America - Market size and forecast 2023-2028 ($ billion)
        • Exhibit 81: Chart on South America - Year-over-year growth 2023-2028 (%)
        • Exhibit 82: Data Table on South America - Year-over-year growth 2023-2028 (%)
      • 9.7 Middle East and Africa - Market size and forecast 2023-2028
        • Exhibit 83: Chart on Middle East and Africa - Market size and forecast 2023-2028 ($ billion)
        • Exhibit 84: Data Table on Middle East and Africa - Market size and forecast 2023-2028 ($ billion)
        • Exhibit 85: Chart on Middle East and Africa - Year-over-year growth 2023-2028 (%)
        • Exhibit 86: Data Table on Middle East and Africa - Year-over-year growth 2023-2028 (%)
      • 9.8 China - Market size and forecast 2023-2028
        • Exhibit 87: Chart on China - Market size and forecast 2023-2028 ($ billion)
        • Exhibit 88: Data Table on China - Market size and forecast 2023-2028 ($ billion)
        • Exhibit 89: Chart on China - Year-over-year growth 2023-2028 (%)
        • Exhibit 90: Data Table on China - Year-over-year growth 2023-2028 (%)
      • 9.9 India - Market size and forecast 2023-2028
        • Exhibit 91: Chart on India - Market size and forecast 2023-2028 ($ billion)
        • Exhibit 92: Data Table on India - Market size and forecast 2023-2028 ($ billion)
        • Exhibit 93: Chart on India - Year-over-year growth 2023-2028 (%)
        • Exhibit 94: Data Table on India - Year-over-year growth 2023-2028 (%)
      • 9.10 Japan - Market size and forecast 2023-2028
        • Exhibit 95: Chart on Japan - Market size and forecast 2023-2028 ($ billion)
        • Exhibit 96: Data Table on Japan - Market size and forecast 2023-2028 ($ billion)
        • Exhibit 97: Chart on Japan - Year-over-year growth 2023-2028 (%)
        • Exhibit 98: Data Table on Japan - Year-over-year growth 2023-2028 (%)
      • 9.11 Germany - Market size and forecast 2023-2028
        • Exhibit 99: Chart on Germany - Market size and forecast 2023-2028 ($ billion)
        • Exhibit 100: Data Table on Germany - Market size and forecast 2023-2028 ($ billion)
        • Exhibit 101: Chart on Germany - Year-over-year growth 2023-2028 (%)
        • Exhibit 102: Data Table on Germany - Year-over-year growth 2023-2028 (%)
      • 9.12 US - Market size and forecast 2023-2028
        • Exhibit 103: Chart on US - Market size and forecast 2023-2028 ($ billion)
        • Exhibit 104: Data Table on US - Market size and forecast 2023-2028 ($ billion)
        • Exhibit 105: Chart on US - Year-over-year growth 2023-2028 (%)
        • Exhibit 106: Data Table on US - Year-over-year growth 2023-2028 (%)
      • 9.13 Market opportunity by geography
        • Exhibit 107: Market opportunity by geography ($ billion)
        • Exhibit 108: Data Tables on Market opportunity by geography ($ billion)

      10 Drivers, Challenges, and Trends

      • 10.1 Market drivers
        • 10.2 Market challenges
          • 10.3 Impact of drivers and challenges
            • Exhibit 109: Impact of drivers and challenges in 2023 and 2028
          • 10.4 Market trends

            11 Vendor Landscape

            • 11.1 Overview
              • 11.2 Vendor landscape
                • Exhibit 110: Overview on Criticality of inputs and Factors of differentiation
              • 11.3 Landscape disruption
                • Exhibit 111: Overview on factors of disruption
              • 11.4 Industry risks
                • Exhibit 112: Impact of key risks on business

              12 Vendor Analysis

              • 12.1 Vendors covered
                • Exhibit 113: Vendors covered
              • 12.2 Market positioning of vendors
                • Exhibit 114: Matrix on vendor position and classification
              • 12.3 Agilent Technologies Inc.
                • Exhibit 115: Agilent Technologies Inc. - Overview
                • Exhibit 116: Agilent Technologies Inc. - Business segments
                • Exhibit 117: Agilent Technologies Inc. - Key offerings
                • Exhibit 118: Agilent Technologies Inc. - Segment focus
              • 12.4 AMERI SOURCE SPECIALITY PRODUCTS
                • Exhibit 119: AMERI SOURCE SPECIALITY PRODUCTS - Overview
                • Exhibit 120: AMERI SOURCE SPECIALITY PRODUCTS - Product / Service
                • Exhibit 121: AMERI SOURCE SPECIALITY PRODUCTS - Key offerings
              • 12.5 Brothers International Industry
                • Exhibit 122: Brothers International Industry - Overview
                • Exhibit 123: Brothers International Industry - Product / Service
                • Exhibit 124: Brothers International Industry - Key offerings
              • 12.6 China BaoWu Steel Group Corp. Ltd.
                • Exhibit 125: China BaoWu Steel Group Corp. Ltd. - Overview
                • Exhibit 126: China BaoWu Steel Group Corp. Ltd. - Product / Service
                • Exhibit 127: China BaoWu Steel Group Corp. Ltd. - Key offerings
              • 12.7 CIMM Group
                • Exhibit 128: CIMM Group - Overview
                • Exhibit 129: CIMM Group - Product / Service
                • Exhibit 130: CIMM Group - Key offerings
              • 12.8 EDM TEC oHG
                • Exhibit 131: EDM TEC oHG - Overview
                • Exhibit 132: EDM TEC oHG - Product / Service
                • Exhibit 133: EDM TEC oHG - Key offerings
              • 12.9 Fangda Carbon New Materials Technology Co. Ltd.
                • Exhibit 134: Fangda Carbon New Materials Technology Co. Ltd. - Overview
                • Exhibit 135: Fangda Carbon New Materials Technology Co. Ltd. - Product / Service
                • Exhibit 136: Fangda Carbon New Materials Technology Co. Ltd. - Key offerings
              • 12.10 GrafTech International Ltd.
                • Exhibit 137: GrafTech International Ltd. - Overview
                • Exhibit 138: GrafTech International Ltd. - Product / Service
                • Exhibit 139: GrafTech International Ltd. - Key offerings
              • 12.11 Graphite India Ltd.
                • Exhibit 140: Graphite India Ltd. - Overview
                • Exhibit 141: Graphite India Ltd. - Business segments
                • Exhibit 142: Graphite India Ltd. - Key offerings
                • Exhibit 143: Graphite India Ltd. - Segment focus
              • 12.12 HEG Ltd.
                • Exhibit 144: HEG Ltd. - Overview
                • Exhibit 145: HEG Ltd. - Business segments
                • Exhibit 146: HEG Ltd. - Key offerings
                • Exhibit 147: HEG Ltd. - Segment focus
              • 12.13 Nippon Carbon Co. Ltd.
                • Exhibit 148: Nippon Carbon Co. Ltd. - Overview
                • Exhibit 149: Nippon Carbon Co. Ltd. - Product / Service
                • Exhibit 150: Nippon Carbon Co. Ltd. - Key offerings
              • 12.14 Oriental Carbon and Chemicals Ltd.
                • Exhibit 151: Oriental Carbon and Chemicals Ltd. - Overview
                • Exhibit 152: Oriental Carbon and Chemicals Ltd. - Product / Service
                • Exhibit 153: Oriental Carbon and Chemicals Ltd. - Key offerings
              • 12.15 Resonac Holdings Corp.
                • Exhibit 154: Resonac Holdings Corp. - Overview
                • Exhibit 155: Resonac Holdings Corp. - Business segments
                • Exhibit 156: Resonac Holdings Corp. - Key news
                • Exhibit 157: Resonac Holdings Corp. - Key offerings
                • Exhibit 158: Resonac Holdings Corp. - Segment focus
              • 12.16 SEC CARBON LTD.
                • Exhibit 159: SEC CARBON LTD. - Overview
                • Exhibit 160: SEC CARBON LTD. - Product / Service
                • Exhibit 161: SEC CARBON LTD. - Key offerings
              • 12.17 Tokai Carbon Co. Ltd.
                • Exhibit 162: Tokai Carbon Co. Ltd. - Overview
                • Exhibit 163: Tokai Carbon Co. Ltd. - Product / Service
                • Exhibit 164: Tokai Carbon Co. Ltd. - Key offerings

              13 Appendix

              • 13.1 Scope of the report
                • 13.2 Inclusions and exclusions checklist
                  • Exhibit 165: Inclusions checklist
                  • Exhibit 166: Exclusions checklist
                • 13.3 Currency conversion rates for US$
                  • Exhibit 167: Currency conversion rates for US$
                • 13.4 Research methodology
                  • Exhibit 168: Research methodology
                  • Exhibit 169: Validation techniques employed for market sizing
                  • Exhibit 170: Information sources
                • 13.5 List of abbreviations
                  • Exhibit 171: List of abbreviations

                Research Methodology

                Technavio presents a detailed picture of the market by way of study, synthesis, and summation of data from multiple sources. The analysts have presented the various facets of the market with a particular focus on identifying the key industry influencers. The data thus presented is comprehensive, reliable, and the result of extensive research, both primary and secondary.

                INFORMATION SOURCES

                Primary sources

                • Manufacturers and suppliers
                • Channel partners
                • Industry experts
                • Strategic decision makers

                Secondary sources

                • Industry journals and periodicals
                • Government data
                • Financial reports of key industry players
                • Historical data
                • Press releases

                DATA ANALYSIS

                Data Synthesis

                • Collation of data
                • Estimation of key figures
                • Analysis of derived insights

                Data Validation

                • Triangulation with data models
                • Reference against proprietary databases
                • Corroboration with industry experts

                REPORT WRITING

                Qualitative

                • Market drivers
                • Market challenges
                • Market trends
                • Five forces analysis

                Quantitative

                • Market size and forecast
                • Market segmentation
                • Geographical insights
                • Competitive landscape

                Interested in this report?

                Get your sample now to see our research methodology and insights!

                Download Now

                Frequently Asked Questions

                Graphite Electrode market growth will increase by $ 1.23 bn during 2024-2028.

                The Graphite Electrode market is expected to grow at a CAGR of 3.94% during 2024-2028.

                Graphite Electrode market is segmented by Product( UHP graphite electrode, HP graphite electrode, RP graphite electrode) Application( Ferrous metals, Non-ferrous metals, RP graphite electrode, South America, MEA)

                Agilent Technologies Inc., AMERI SOURCE SPECIALITY PRODUCTS, Brothers International Industry, China BaoWu Steel Group Corp. Ltd., CIMM Group, Dan Carbon, EDM TEC oHG, El 6, Fangda Carbon New Materials Technology Co. Ltd., GrafTech International Ltd., Graphite India Ltd., HEG Ltd., Kaifeng Pingmei New Carbon Material Technology Co. Ltd., Nippon Carbon Co. Ltd., Oriental Carbon and Chemicals Ltd., Resonac Holdings Corp., Sangraf International, SEC CARBON LTD., Tokai Carbon Co. Ltd., Weaver Industries Inc., ZHENGZHOU RONGSHENG REFRACTORY CO. LTD. are a few of the key vendors in the Graphite Electrode market.

                APAC will register the highest growth rate of 56% among the other regions. Therefore, the Graphite Electrode market in APAC is expected to garner significant business opportunities for the vendors during the forecast period.

                US, China, India, Japan, Germany

                • Increased demand for high-quality steelRapid industrialization and urbanization in developed and developing nations are creating a wide opportunity for steel manufacturers. The building and construction is the driving factor this market.
                • automotive is the driving factor this market.
                • and aviation industries are the major end-users of steel across the globe and are creating a huge demand for graphite electrodes. The increased infrastructure spending can increase the demand for graphite electrodes is the driving factor this market.
                • which is a major component used in the smelting process to manufacture high-quality steel. In addition is the driving factor this market.
                • the growing demand for steel in the oil and gas industry propels the growth of the global graphite electrode market is the driving factor this market.
                • which will continue during the forecast period. The use of graphite electrodes in steel manufacturing is increasing due to properties such as the high level of electrical conductivity is the driving factor this market.
                • the ability to withstand higher heat dissipation is the driving factor this market.
                • and excellent mechanical strength.As per the World Steel Association is the driving factor this market.
                • the demand for crude steel is increasing significantly continuously. For instance is the driving factor this market.
                • Tthe world crude steel production for 71 countries reached 145.5 million tons in November 2023 is the driving factor this market.
                • a 3.3% increase compared with November 2022. The rapid increase in steel consumption from the major end-users like construction is the driving factor this market.
                • automobile is the driving factor this market.
                • aviation is the driving factor this market.
                • mechanical machinery is the driving factor this market.
                • and oil and gas sectors will create more demand for graphite electrodes during the forecast period is the driving factor this market.
                • which will boost the growth of the market in focus during the forecast period. is the driving factor this market.

                The Graphite Electrode market vendors should focus on grabbing business opportunities from the UHP graphite electrode segment as it accounted for the largest market share in the base year.