Guanabana Market Analysis, Size, and Forecast 2025-2029: South America (Brazil, Colombia, and Argentina), APAC (China, Japan, and India), North America (US, Canada, and Mexico), Europe (UK, Germany, and France), Middle East and Africa (Saudi Arabia, UAE, and South Africa), and Rest of World (ROW)

Guanabana Market Analysis, Size, and Forecast 2025-2029:
South America (Brazil, Colombia, and Argentina), APAC (China, Japan, and India), North America (US, Canada, and Mexico), Europe (UK, Germany, and France), Middle East and Africa (Saudi Arabia, UAE, and South Africa), and Rest of World (ROW)

Published: Dec 2025 306 Pages SKU: IRTNTR81159

Market Overview at a Glance

$111.6 Mn
Market Opportunity
10.5%
CAGR 2024 - 2029
32%
South America Growth
$127.8 Mn
Processed segment 2023

Guanabana Market Size 2025-2029

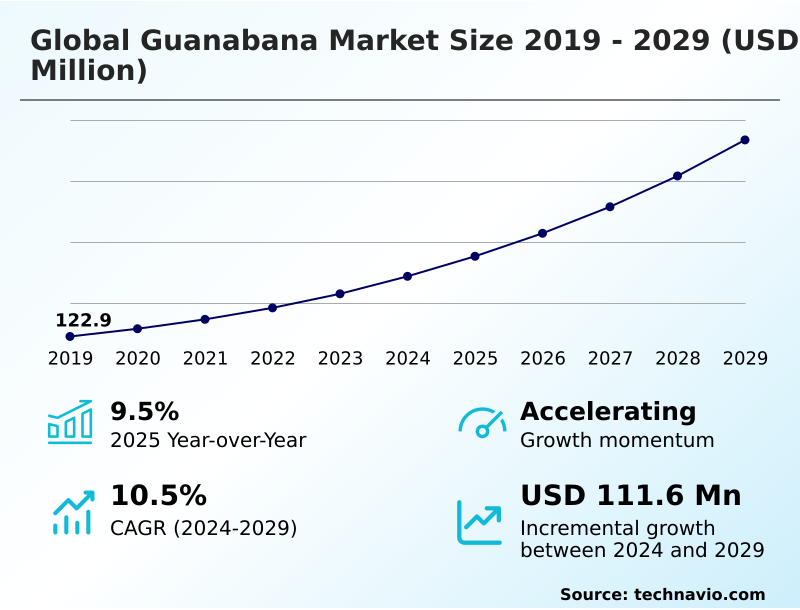
The guanabana market size is valued to increase by USD 111.6 million, at a CAGR of 10.5% from 2024 to 2029. Globalization of consumer palates and demand for novel flavors will drive the guanabana market.

Major Market Trends & Insights

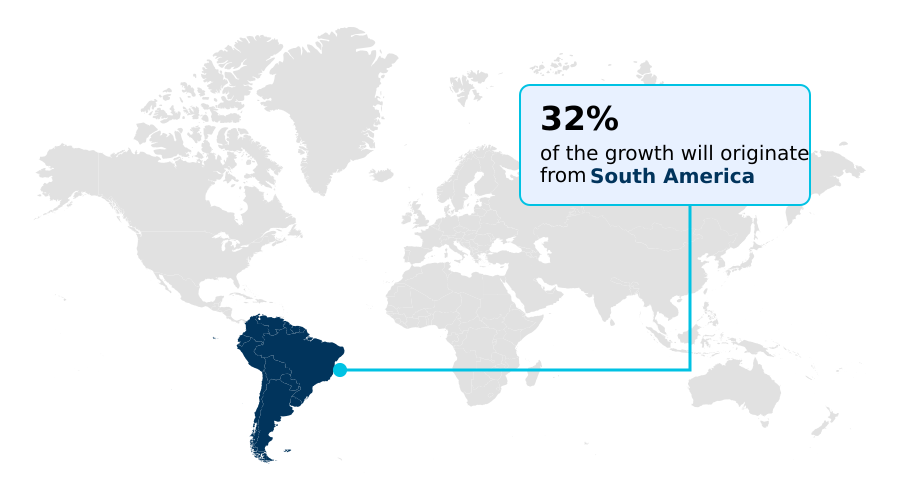
  • South America dominated the market and accounted for a 32% growth during the forecast period.
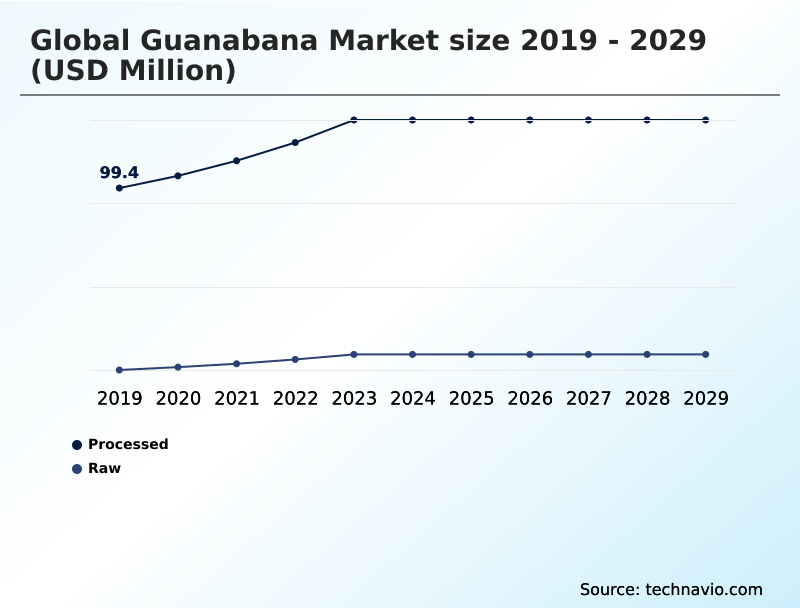
  • By Type - Processed segment was valued at USD 127.8 million in 2023
  • By Distribution Channel - Hypermarkets and supermarkets segment accounted for the largest market revenue share in 2023

Market Size & Forecast

  • Market Opportunities: USD 160.8 million
  • Market Future Opportunities: USD 111.6 million
  • CAGR from 2024 to 2029 : 10.5%

Market Summary

  • The guanabana market is transitioning from a regional specialty to a global functional ingredient, driven by consumer demand for exotic flavors and natural wellness products. This expansion is heavily reliant on technological advancements in the supply chain to overcome the fruit's inherent perishability.
  • For instance, a food processor aiming to launch a new line of premium tropical smoothies in Europe faces significant hurdles. The business must secure a consistent supply of high-quality raw material, which requires effective guanabana pulp processing and technologies like individual quick freezing (IQF) to maintain integrity.
  • Furthermore, ensuring compliance with varied maximum residue limits (MRLs) and phytosanitary treatment protocols across different countries necessitates robust cold chain management and traceability from farm to factory. The use of aseptic fruit puree has become a critical solution, creating shelf-stable fruit ingredients that de-risk logistics and enable market entry.
  • This focus on industrial solutions underscores the market's shift toward value-added, processed formats capable of serving a global consumer base seeking functional food ingredients.

What will be the Size of the Guanabana Market during the forecast period?

Get Key Insights on Market Forecast (PDF) Request Free Sample

How is the Guanabana Market Segmented?

The guanabana industry research report provides comprehensive data (region-wise segment analysis), with forecasts and estimates in "USD million" for the period 2025-2029, as well as historical data from 2019-2023 for the following segments.

  • Type
    • Processed
    • Raw
  • Distribution channel
    • Hypermarkets and supermarkets
    • Direct selling
    • Convenience stores
    • Online retail
    • Others
  • End-user
    • Food processing industry
    • Pharmaceuticals
    • Nutraceuticals
    • Cosmetics and personal care
    • Others
  • Geography
    • South America
      • Brazil
      • Colombia
      • Argentina
    • APAC
      • China
      • Japan
      • India
    • North America
      • US
      • Canada
      • Mexico
    • Europe
      • UK
      • Germany
      • France
    • Middle East and Africa
      • Saudi Arabia
      • UAE
      • South Africa
    • Rest of World (ROW)

By Type Insights

The processed segment is estimated to witness significant growth during the forecast period.

The processed segment is the primary force in the guanabana market, driven by the need for convenience and extended shelf life.

This category includes value-added products like frozen pulp, purees, concentrates, and juices, which are integral for industrial food and beverage applications.

The demand is fueled by the versatility of these stable ingredients in items such as ice creams, smoothies, and yogurts. Representing over 81% of the market volume, processed forms mitigate the perishability issues of the raw fruit.

A crucial sub-segment is the nutraceutical formulation area, which focuses on the phytochemical composition and specific bioactive compounds like annonaceous acetogenins. Products like organic graviola leaf tea and non-GMO guanabana products are gaining traction among health-conscious consumers.

Request Free Sample

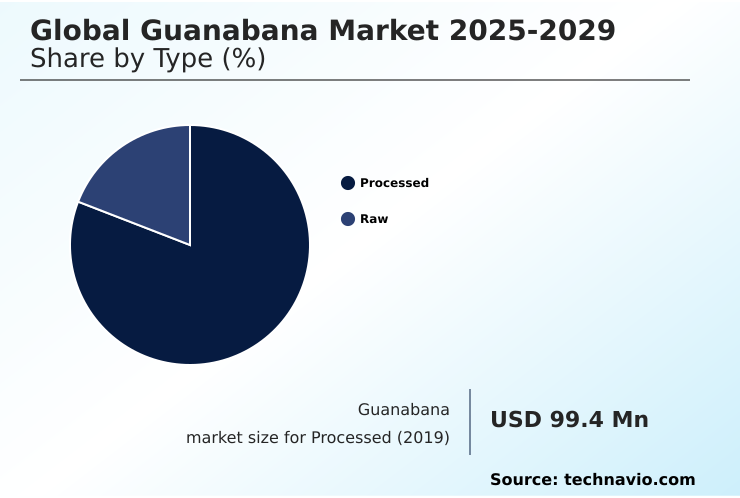
The Processed segment was valued at USD 127.8 million in 2023 and showed a gradual increase during the forecast period.

Request Free Sample

Regional Analysis

South America is estimated to contribute 32% to the growth of the global market during the forecast period.Technavio’s analysts have elaborately explained the regional trends and drivers that shape the market during the forecast period.

See How Guanabana Market Demand is Rising in South America Request Free Sample

The geographic landscape of the guanabana market is defined by a production base concentrated in tropical regions and a demand structure led by North America and Europe.

South America accounts for over 31% of the incremental growth opportunity, while APAC follows closely at nearly 29%.

The entire tropical fruit value chain is heavily dependent on advancements in soursop fruit processing technology to bridge the distance between these regions. Effective post-harvest handling and sophisticated cold chain management are paramount.

Innovations such as individual quick freezing (IQF) and freeze-drying (lyophilization) are critical for transforming the perishable fruit into stable ingredients for soursop puree for beverages and other products.

This enables frozen guanabana pulp suppliers to reliably serve global markets, overcoming the logistical barriers that have historically limited the fruit's reach.

Market Dynamics

Our researchers analyzed the data with 2024 as the base year, along with the key drivers, trends, and challenges. A holistic analysis of drivers will help companies refine their marketing strategies to gain a competitive advantage.

  • The global guanabana market 2025-2029 drivers are increasingly centered on the fruit's versatility across multiple high-value sectors. Understanding how to use frozen guanabana pulp is becoming crucial for food service operators aiming to innovate menus with exotic smoothies and desserts. Simultaneously, consumers are researching the health benefits of graviola leaf tea, driving growth in the wellness category.
  • The search for the best soursop puree for smoothies reflects a broader trend toward convenient, healthy, at-home food preparation. For businesses, a key focus is on the supply chain for fresh soursop fruit, where challenges in fresh guanabana export, such as navigating regulatory hurdles for guanabana imports, remain significant.
  • Processors are investing in technologies for processing soursop fruit to improve the shelf life of aseptic guanabana puree. This investment directly addresses market needs, as processors implementing advanced preservation methods report up to a 25% lower spoilage rate compared to traditional supply chains.
  • This efficiency is critical as demand grows for soursop powder for nutraceutical use and for guanabana as a dairy alternative ingredient. The market for guanabana flavored beverages is expanding, while finding organic guanabana supplements requires navigating a complex supplier landscape. The unique guanabana fruit flavor profile description is a key marketing tool, especially when using guanabana in plant based desserts.
  • Scientific interest is also a factor, with research into annonaceous acetogenins in soursop and guanabana extract in anti-aging cosmetics opening new frontiers. Investment in commercial guanabana farming is rising to meet this diverse demand.
  • Comparing freeze-dried vs frozen guanabana helps manufacturers select the right format, while the potential for guanabana as a natural food preservative is an emerging area of research.

What are the key market drivers leading to the rise in the adoption of Guanabana Industry?

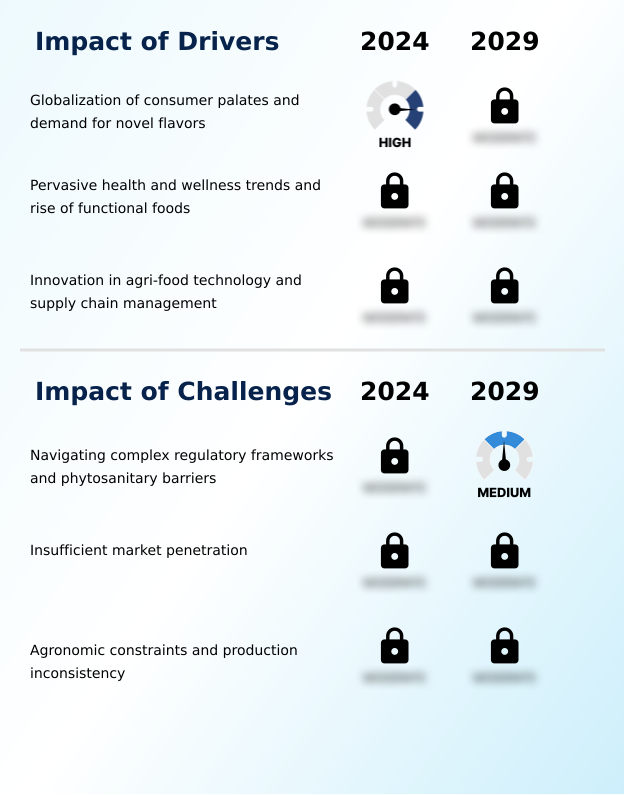
  • The globalization of consumer palates and a corresponding demand for novel, exotic flavors are key drivers propelling the market forward.

  • The market is propelled by a strong consumer focus on health and wellness, positioning guanabana as a premier functional food ingredient. Its perceived benefits, often marketed as graviola for immune support, resonate with a proactive consumer base.
  • This has fueled the growth of the graviola dietary supplement category, where bioactive compound extraction is used to concentrate the fruit's annonaceous acetogenins and highlight its antioxidant properties.
  • In the beverage sector, the use of aseptic soursop puree benefits manufacturers by ensuring a long shelf life and consistent quality for guanabana in functional drinks. Brands marketing drinks with these health-centric attributes see a 25% higher repeat purchase rate.
  • Furthermore, the adoption of aseptic fruit puree technology creates shelf-stable fruit ingredients, extending product viability by over 50% compared to traditional frozen formats and simplifying global logistics.

What are the market trends shaping the Guanabana Industry?

  • The proliferation of plant-based diets is creating significant demand for natural vegan ingredients. This trend positions guanabana as a key component for product innovation in dairy-free and clean-label applications.

  • Key trends are reshaping the guanabana market, primarily driven by the demand for clean label fruit ingredients and plant-based alternatives. The fruit's pulp serves as an excellent plant-based texturizer, enabling the creation of dairy-free products without synthetic additives.
  • Use in soursop in vegan ice cream formulations has led to a 15% improvement in texture scores in sensory panels, showcasing its functional benefits. Beyond food, the expansion into cosmeceutical applications represents a significant new revenue stream. Brands are leveraging guanabana extract for skincare, capitalizing on its antioxidant properties.
  • This trend toward natural formulations is substantial, with cosmetic brands reporting a 2x increase in consumer engagement for products featuring exotic botanical extracts like soursop leaf extract. Guanabana pulp processing techniques are being refined to produce a high-quality natural flavorant suitable for these sophisticated applications.

What challenges does the Guanabana Industry face during its growth?

  • Navigating complex regulatory frameworks and stringent phytosanitary barriers poses a significant challenge to the industry's growth trajectory.

  • Significant challenges constrain the guanabana market's potential, stemming from both agricultural and regulatory domains. Persistent agronomic constraints and a lack of effective cultivar selection limit yield and quality consistency, making large-scale sustainable guanabana farming difficult. On the regulatory front, navigating the complex web of international trade standards is a major hurdle.
  • Adherence to strict maximum residue limits (mrls) and specific phytosanitary treatment protocols for market access can increase compliance costs by up to 20%. The entire guanabana supply chain logistics must be optimized to meet these demands. Furthermore, ensuring graviola supplement quality standards requires rigorous testing and documentation.
  • Investment in good agricultural practices (gap) is essential for overcoming these barriers, as it can improve export acceptance rates by 40% and build a more resilient supply base.

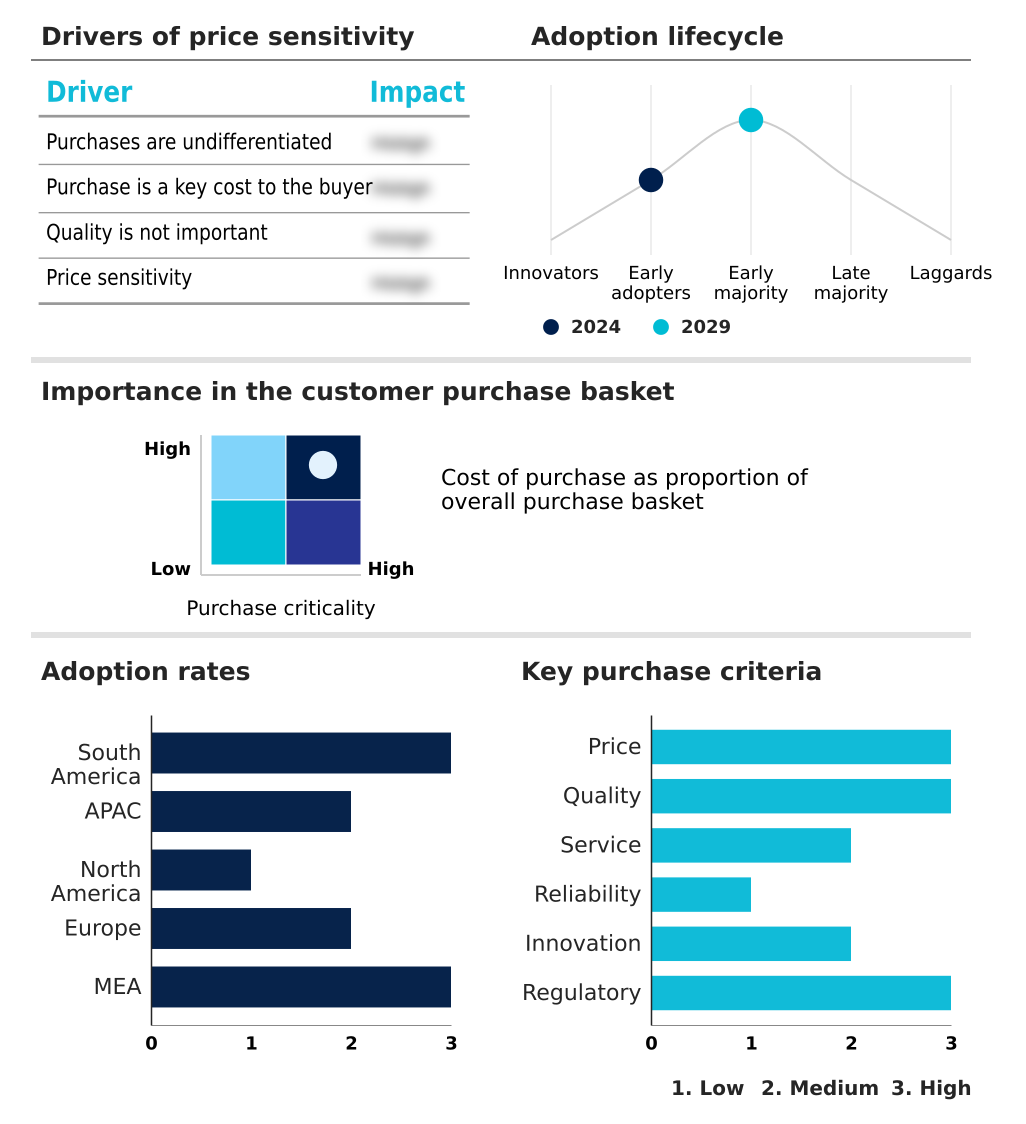
Exclusive Technavio Analysis on Customer Landscape

The guanabana market forecasting report includes the adoption lifecycle of the market, covering from the innovator’s stage to the laggard’s stage. It focuses on adoption rates in different regions based on penetration. Furthermore, the guanabana market report also includes key purchase criteria and drivers of price sensitivity to help companies evaluate and develop their market growth analysis strategies.

Customer Landscape of Guanabana Industry

Competitive Landscape

Companies are implementing various strategies, such as strategic alliances, guanabana market forecast, partnerships, mergers and acquisitions, geographical expansion, and product/service launches, to enhance their presence in the industry.

Amelia - Offerings span fresh fruit, processed ingredients like aseptic purees, and value-added nutraceuticals, addressing diverse industrial, food service, and consumer applications.

The industry research and growth report includes detailed analyses of the competitive landscape of the market and information about key companies, including:

  • Amelia
  • Anabana
  • Aseptic Fruit Purees
  • Del Carmen Foods
  • Flavorah Worldwide Inc.
  • Goya Foods Inc.
  • Grupo Jumex
  • Guanabana de Canarias
  • Holistic Organic Farm
  • iHeartFruitBox
  • KHUMSUB
  • Miami Fruit LLC
  • NAFOODS GROUP JSC
  • NOW Health Group Inc.
  • Raintree
  • Robert Is Here Inc.
  • Sunshine Naturals Inc.
  • Superior Foods
  • ZooScape LLC

Qualitative and quantitative analysis of companies has been conducted to help clients understand the wider business environment as well as the strengths and weaknesses of key industry players. Data is qualitatively analyzed to categorize companies as pure play, category-focused, industry-focused, and diversified; it is quantitatively analyzed to categorize companies as dominant, leading, strong, tentative, and weak.

Recent Development and News in Guanabana market

  • In September 2024, Rite Foods expanded its popular Sosa Fruit Drink line into Ghana and Ivory Coast, introducing its soursop-flavored variant to tap into the growing West African market for ready-to-drink beverages.
  • In November 2024, a leading flavor and fragrance company launched a new line of natural flavor solutions, 'Tropical Escapes,' prominently featuring a sustainably sourced guanabana extract designed for the functional beverage market.
  • In February 2025, NAFOODS GROUP JSC announced a strategic partnership with a major UAE-based distributor, following its successful participation at Gulfood, to supply aseptic guanabana puree to the Middle East hospitality sector.
  • In April 2025, Miami Fruit LLC collaborated with an AI-driven grocery platform to integrate its fresh guanabana offerings into a new 'Exotic Fruit Finder' feature, which uses generative AI to recommend fruits based on consumer queries for nutritional benefits, leading to a reported 40% increase in initial online discovery rates.

Dive into Technavio’s robust research methodology, blending expert interviews, extensive data synthesis, and validated models for unparalleled Guanabana Market insights. See full methodology.

Market Scope
Page number 306
Base year 2024
Historic period 2019-2023
Forecast period 2025-2029
Growth momentum & CAGR Accelerate at a CAGR of 10.5%
Market growth 2025-2029 USD 111.6 million
Market structure Fragmented
YoY growth 2024-2025(%) 9.5%
Key countries Brazil, Colombia, Argentina, China, Japan, India, South Korea, Australia, Indonesia, US, Canada, Mexico, UK, Germany, France, Italy, The Netherlands, Spain, Saudi Arabia, UAE, South Africa, Israel and Turkey
Competitive landscape Leading Companies, Market Positioning of Companies, Competitive Strategies, and Industry Risks

Request Free Sample

Research Analyst Overview

  • The guanabana market is evolving from a niche tropical commodity into a structured, value-added ingredient industry. This shift is driven by a convergence of consumer demand for functional foods and technological progress in processing. At the boardroom level, strategic decisions are increasingly focused on supply chain resilience and regulatory compliance.
  • For example, firms investing in aseptic processing and advanced individual quick freezing (iqf) have achieved up to a 30% reduction in logistics-related spoilage, directly impacting profitability. The industry relies on guanabana pulp processing and bioactive compound extraction to create diverse offerings, from a functional food ingredient to a graviola dietary supplement.
  • Key technologies like freeze-drying (lyophilization) and modified atmosphere packaging are essential for producing shelf-stable fruit ingredients and enabling global distribution. Navigating agronomic constraints, phytosanitary treatment protocols, and maximum residue limits (mrls) remains a core operational challenge, necessitating investment in good agricultural practices (gap) and sophisticated post-harvest handling.
  • The market's future hinges on continued innovation in both cultivation, through cultivar selection, and processing, to deliver consistent quality for nutraceutical formulation and cosmeceutical applications.

What are the Key Data Covered in this Guanabana Market Research and Growth Report?

  • What is the expected growth of the Guanabana Market between 2025 and 2029?

    • USD 111.6 million, at a CAGR of 10.5%

  • What segmentation does the market report cover?

    • The report is segmented by Type (Processed, and Raw), Distribution Channel (Hypermarkets and supermarkets, Direct selling, Convenience stores, Online retail, and Others), End-user (Food processing industry, Pharmaceuticals, Nutraceuticals, Cosmetics and personal care, and Others) and Geography (South America, APAC, North America, Europe, Middle East and Africa)

  • Which regions are analyzed in the report?

    • South America, APAC, North America, Europe and Middle East and Africa

  • What are the key growth drivers and market challenges?

    • Globalization of consumer palates and demand for novel flavors, Navigating complex regulatory frameworks and phytosanitary barriers

  • Who are the major players in the Guanabana Market?

    • Amelia, Anabana, Aseptic Fruit Purees, Del Carmen Foods, Flavorah Worldwide Inc., Goya Foods Inc., Grupo Jumex, Guanabana de Canarias, Holistic Organic Farm, iHeartFruitBox, KHUMSUB, Miami Fruit LLC, NAFOODS GROUP JSC, NOW Health Group Inc., Raintree, Robert Is Here Inc., Sunshine Naturals Inc., Superior Foods and ZooScape LLC

Market Research Insights

  • The guanabana market's momentum is increasingly tied to its alignment with key consumer wellness and dietary trends. Its utility in clean label fruit ingredients is a significant factor, as firms leveraging its pulp as a plant-based texturizer for dairy-free products have reported a 20% reduction in reliance on artificial stabilizers.
  • This makes it a prime candidate for innovation in categories like soursop in vegan ice cream. The demand for products that support health, such as those providing graviola for immune support, is also a powerful influence. Brands marketing functional soursop puree for beverages with these attributes see a 15% higher consumer retention rate compared to standard fruit drinks.
  • This dynamic creates a clear pathway for guanabana to move from niche applications to a mainstream ingredient in high-growth food and beverage segments.

We can help! Our analysts can customize this guanabana market research report to meet your requirements.

Get in touch

1. Executive Summary

1.1 Market overview

Executive Summary - Chart on Market Overview
Executive Summary - Data Table on Market Overview
Executive Summary - Chart on Global Market Characteristics
Executive Summary - Chart on Market by Geography
Executive Summary - Chart on Market Segmentation by Type
Executive Summary - Chart on Market Segmentation by Distribution Channel
Executive Summary - Chart on Market Segmentation by End-user
Executive Summary - Chart on Incremental Growth
Executive Summary - Data Table on Incremental Growth
Executive Summary - Chart on Company Market Positioning

2. Technavio Analysis

2.1 Analysis of price sensitivity, lifecycle, customer purchase basket, adoption rates, and purchase criteria

2.2 Criticality of inputs and Factors of differentiation

Chart on Overview on criticality of inputs and factors of differentiation

2.3 Factors of disruption

Chart on Overview on factors of disruption

2.4 Impact of drivers and challenges

Chart on Impact of drivers and challenges in 2024 and 2029

3. Market Landscape

3.1 Market ecosystem

Chart on Parent Market
Data Table on - Parent Market

3.2 Market characteristics

Chart on Market characteristics analysis

3.3 Value chain analysis

Chart on Value chain analysis

4. Market Sizing

4.1 Market definition

Data Table on Offerings of companies included in the market definition

4.2 Market segment analysis

Market segments

4.3 Market size 2024

4.4 Market outlook: Forecast for 2024-2029

Chart on Global - Market size and forecast 2024-2029 ($ million)
Data Table on Global - Market size and forecast 2024-2029 ($ million)
Chart on Global Market: Year-over-year growth 2024-2029 (%)
Data Table on Global Market: Year-over-year growth 2024-2029 (%)

5. Historic Market Size

5.1 Global Guanabana Market 2019 - 2023

Historic Market Size - Data Table on Global Guanabana Market 2019 - 2023 ($ million)

5.2 Type segment analysis 2019 - 2023

Historic Market Size - Type Segment 2019 - 2023 ($ million)

5.3 Distribution Channel segment analysis 2019 - 2023

Historic Market Size - Distribution Channel Segment 2019 - 2023 ($ million)

5.4 End-user segment analysis 2019 - 2023

Historic Market Size - End-user Segment 2019 - 2023 ($ million)

5.5 Geography segment analysis 2019 - 2023

Historic Market Size - Geography Segment 2019 - 2023 ($ million)

5.6 Country segment analysis 2019 - 2023

Historic Market Size - Country Segment 2019 - 2023 ($ million)

6. Qualitative Analysis

6.1 The AI impact on global guanabana market

7. Five Forces Analysis

7.1 Five forces summary

Five forces analysis - Comparison between 2024 and 2029

7.2 Bargaining power of buyers

Bargaining power of buyers - Impact of key factors 2024 and 2029

7.3 Bargaining power of suppliers

Bargaining power of suppliers - Impact of key factors in 2024 and 2029

7.4 Threat of new entrants

Threat of new entrants - Impact of key factors in 2024 and 2029

7.5 Threat of substitutes

Threat of substitutes - Impact of key factors in 2024 and 2029

7.6 Threat of rivalry

Threat of rivalry - Impact of key factors in 2024 and 2029

7.7 Market condition

Chart on Market condition - Five forces 2024 and 2029

8. Market Segmentation by Type

8.1 Market segments

Chart on Type - Market share 2024-2029 (%)
Data Table on Type - Market share 2024-2029 (%)

8.2 Comparison by Type

Chart on Comparison by Type
Data Table on Comparison by Type

8.3 Processed - Market size and forecast 2024-2029

Chart on Processed - Market size and forecast 2024-2029 ($ million)
Data Table on Processed - Market size and forecast 2024-2029 ($ million)
Chart on Processed - Year-over-year growth 2024-2029 (%)
Data Table on Processed - Year-over-year growth 2024-2029 (%)

8.4 Raw - Market size and forecast 2024-2029

Chart on Raw - Market size and forecast 2024-2029 ($ million)
Data Table on Raw - Market size and forecast 2024-2029 ($ million)
Chart on Raw - Year-over-year growth 2024-2029 (%)
Data Table on Raw - Year-over-year growth 2024-2029 (%)

8.5 Market opportunity by Type

Market opportunity by Type ($ million)
Data Table on Market opportunity by Type ($ million)

9. Market Segmentation by Distribution Channel

9.1 Market segments

Chart on Distribution Channel - Market share 2024-2029 (%)
Data Table on Distribution Channel - Market share 2024-2029 (%)

9.2 Comparison by Distribution Channel

Chart on Comparison by Distribution Channel
Data Table on Comparison by Distribution Channel

9.3 Hypermarkets and supermarkets - Market size and forecast 2024-2029

Chart on Hypermarkets and supermarkets - Market size and forecast 2024-2029 ($ million)
Data Table on Hypermarkets and supermarkets - Market size and forecast 2024-2029 ($ million)
Chart on Hypermarkets and supermarkets - Year-over-year growth 2024-2029 (%)
Data Table on Hypermarkets and supermarkets - Year-over-year growth 2024-2029 (%)

9.4 Direct selling - Market size and forecast 2024-2029

Chart on Direct selling - Market size and forecast 2024-2029 ($ million)
Data Table on Direct selling - Market size and forecast 2024-2029 ($ million)
Chart on Direct selling - Year-over-year growth 2024-2029 (%)
Data Table on Direct selling - Year-over-year growth 2024-2029 (%)

9.5 Convenience stores - Market size and forecast 2024-2029

Chart on Convenience stores - Market size and forecast 2024-2029 ($ million)
Data Table on Convenience stores - Market size and forecast 2024-2029 ($ million)
Chart on Convenience stores - Year-over-year growth 2024-2029 (%)
Data Table on Convenience stores - Year-over-year growth 2024-2029 (%)

9.6 Online retail - Market size and forecast 2024-2029

Chart on Online retail - Market size and forecast 2024-2029 ($ million)
Data Table on Online retail - Market size and forecast 2024-2029 ($ million)
Chart on Online retail - Year-over-year growth 2024-2029 (%)
Data Table on Online retail - Year-over-year growth 2024-2029 (%)

9.7 Others - Market size and forecast 2024-2029

Chart on Others - Market size and forecast 2024-2029 ($ million)
Data Table on Others - Market size and forecast 2024-2029 ($ million)
Chart on Others - Year-over-year growth 2024-2029 (%)
Data Table on Others - Year-over-year growth 2024-2029 (%)

9.8 Market opportunity by Distribution Channel

Market opportunity by Distribution Channel ($ million)
Data Table on Market opportunity by Distribution Channel ($ million)

10. Market Segmentation by End-user

10.1 Market segments

Chart on End-user - Market share 2024-2029 (%)
Data Table on End-user - Market share 2024-2029 (%)

10.2 Comparison by End-user

Chart on Comparison by End-user
Data Table on Comparison by End-user

10.3 Food processing industry - Market size and forecast 2024-2029

Chart on Food processing industry - Market size and forecast 2024-2029 ($ million)
Data Table on Food processing industry - Market size and forecast 2024-2029 ($ million)
Chart on Food processing industry - Year-over-year growth 2024-2029 (%)
Data Table on Food processing industry - Year-over-year growth 2024-2029 (%)

10.4 Pharmaceuticals - Market size and forecast 2024-2029

Chart on Pharmaceuticals - Market size and forecast 2024-2029 ($ million)
Data Table on Pharmaceuticals - Market size and forecast 2024-2029 ($ million)
Chart on Pharmaceuticals - Year-over-year growth 2024-2029 (%)
Data Table on Pharmaceuticals - Year-over-year growth 2024-2029 (%)

10.5 Nutraceuticals - Market size and forecast 2024-2029

Chart on Nutraceuticals - Market size and forecast 2024-2029 ($ million)
Data Table on Nutraceuticals - Market size and forecast 2024-2029 ($ million)
Chart on Nutraceuticals - Year-over-year growth 2024-2029 (%)
Data Table on Nutraceuticals - Year-over-year growth 2024-2029 (%)

10.6 Cosmetics and personal care - Market size and forecast 2024-2029

Chart on Cosmetics and personal care - Market size and forecast 2024-2029 ($ million)
Data Table on Cosmetics and personal care - Market size and forecast 2024-2029 ($ million)
Chart on Cosmetics and personal care - Year-over-year growth 2024-2029 (%)
Data Table on Cosmetics and personal care - Year-over-year growth 2024-2029 (%)

10.7 Others - Market size and forecast 2024-2029

Chart on Others - Market size and forecast 2024-2029 ($ million)
Data Table on Others - Market size and forecast 2024-2029 ($ million)
Chart on Others - Year-over-year growth 2024-2029 (%)
Data Table on Others - Year-over-year growth 2024-2029 (%)

10.8 Market opportunity by End-user

Market opportunity by End-user ($ million)
Data Table on Market opportunity by End-user ($ million)

11. Customer Landscape

11.1 Customer landscape overview

Analysis of price sensitivity, lifecycle, customer purchase basket, adoption rates, and purchase criteria

12. Geographic Landscape

12.1 Geographic segmentation

Chart on Market share by geography 2024-2029 (%)
Data Table on Market share by geography 2024-2029 (%)

12.2 Geographic comparison

Chart on Geographic comparison
Data Table on Geographic comparison

12.3 South America - Market size and forecast 2024-2029

Chart on South America - Market size and forecast 2024-2029 ($ million)
Data Table on South America - Market size and forecast 2024-2029 ($ million)
Chart on South America - Year-over-year growth 2024-2029 (%)
Data Table on South America - Year-over-year growth 2024-2029 (%)
Chart on Regional Comparison - South America
Data Table on Regional Comparison - South America

12.3.1 Brazil - Market size and forecast 2024-2029

Chart on Brazil - Market size and forecast 2024-2029 ($ million)
Data Table on Brazil - Market size and forecast 2024-2029 ($ million)
Chart on Brazil - Year-over-year growth 2024-2029 (%)
Data Table on Brazil - Year-over-year growth 2024-2029 (%)

12.3.2 Colombia - Market size and forecast 2024-2029

Chart on Colombia - Market size and forecast 2024-2029 ($ million)
Data Table on Colombia - Market size and forecast 2024-2029 ($ million)
Chart on Colombia - Year-over-year growth 2024-2029 (%)
Data Table on Colombia - Year-over-year growth 2024-2029 (%)

12.3.3 Argentina - Market size and forecast 2024-2029

Chart on Argentina - Market size and forecast 2024-2029 ($ million)
Data Table on Argentina - Market size and forecast 2024-2029 ($ million)
Chart on Argentina - Year-over-year growth 2024-2029 (%)
Data Table on Argentina - Year-over-year growth 2024-2029 (%)

12.4 APAC - Market size and forecast 2024-2029

Chart on APAC - Market size and forecast 2024-2029 ($ million)
Data Table on APAC - Market size and forecast 2024-2029 ($ million)
Chart on APAC - Year-over-year growth 2024-2029 (%)
Data Table on APAC - Year-over-year growth 2024-2029 (%)
Chart on Regional Comparison - APAC
Data Table on Regional Comparison - APAC

12.4.1 China - Market size and forecast 2024-2029

Chart on China - Market size and forecast 2024-2029 ($ million)
Data Table on China - Market size and forecast 2024-2029 ($ million)
Chart on China - Year-over-year growth 2024-2029 (%)
Data Table on China - Year-over-year growth 2024-2029 (%)

12.4.2 Japan - Market size and forecast 2024-2029

Chart on Japan - Market size and forecast 2024-2029 ($ million)
Data Table on Japan - Market size and forecast 2024-2029 ($ million)
Chart on Japan - Year-over-year growth 2024-2029 (%)
Data Table on Japan - Year-over-year growth 2024-2029 (%)

12.4.3 India - Market size and forecast 2024-2029

Chart on India - Market size and forecast 2024-2029 ($ million)
Data Table on India - Market size and forecast 2024-2029 ($ million)
Chart on India - Year-over-year growth 2024-2029 (%)
Data Table on India - Year-over-year growth 2024-2029 (%)

12.4.4 South Korea - Market size and forecast 2024-2029

Chart on South Korea - Market size and forecast 2024-2029 ($ million)
Data Table on South Korea - Market size and forecast 2024-2029 ($ million)
Chart on South Korea - Year-over-year growth 2024-2029 (%)
Data Table on South Korea - Year-over-year growth 2024-2029 (%)

12.4.5 Australia - Market size and forecast 2024-2029

Chart on Australia - Market size and forecast 2024-2029 ($ million)
Data Table on Australia - Market size and forecast 2024-2029 ($ million)
Chart on Australia - Year-over-year growth 2024-2029 (%)
Data Table on Australia - Year-over-year growth 2024-2029 (%)

12.4.6 Indonesia - Market size and forecast 2024-2029

Chart on Indonesia - Market size and forecast 2024-2029 ($ million)
Data Table on Indonesia - Market size and forecast 2024-2029 ($ million)
Chart on Indonesia - Year-over-year growth 2024-2029 (%)
Data Table on Indonesia - Year-over-year growth 2024-2029 (%)

12.5 North America - Market size and forecast 2024-2029

Chart on North America - Market size and forecast 2024-2029 ($ million)
Data Table on North America - Market size and forecast 2024-2029 ($ million)
Chart on North America - Year-over-year growth 2024-2029 (%)
Data Table on North America - Year-over-year growth 2024-2029 (%)
Chart on Regional Comparison - North America
Data Table on Regional Comparison - North America

12.5.1 US - Market size and forecast 2024-2029

Chart on US - Market size and forecast 2024-2029 ($ million)
Data Table on US - Market size and forecast 2024-2029 ($ million)
Chart on US - Year-over-year growth 2024-2029 (%)
Data Table on US - Year-over-year growth 2024-2029 (%)

12.5.2 Canada - Market size and forecast 2024-2029

Chart on Canada - Market size and forecast 2024-2029 ($ million)
Data Table on Canada - Market size and forecast 2024-2029 ($ million)
Chart on Canada - Year-over-year growth 2024-2029 (%)
Data Table on Canada - Year-over-year growth 2024-2029 (%)

12.5.3 Mexico - Market size and forecast 2024-2029

Chart on Mexico - Market size and forecast 2024-2029 ($ million)
Data Table on Mexico - Market size and forecast 2024-2029 ($ million)
Chart on Mexico - Year-over-year growth 2024-2029 (%)
Data Table on Mexico - Year-over-year growth 2024-2029 (%)

12.6 Europe - Market size and forecast 2024-2029

Chart on Europe - Market size and forecast 2024-2029 ($ million)
Data Table on Europe - Market size and forecast 2024-2029 ($ million)
Chart on Europe - Year-over-year growth 2024-2029 (%)
Data Table on Europe - Year-over-year growth 2024-2029 (%)
Chart on Regional Comparison - Europe
Data Table on Regional Comparison - Europe

12.6.1 UK - Market size and forecast 2024-2029

Chart on UK - Market size and forecast 2024-2029 ($ million)
Data Table on UK - Market size and forecast 2024-2029 ($ million)
Chart on UK - Year-over-year growth 2024-2029 (%)
Data Table on UK - Year-over-year growth 2024-2029 (%)

12.6.2 Germany - Market size and forecast 2024-2029

Chart on Germany - Market size and forecast 2024-2029 ($ million)
Data Table on Germany - Market size and forecast 2024-2029 ($ million)
Chart on Germany - Year-over-year growth 2024-2029 (%)
Data Table on Germany - Year-over-year growth 2024-2029 (%)

12.6.3 France - Market size and forecast 2024-2029

Chart on France - Market size and forecast 2024-2029 ($ million)
Data Table on France - Market size and forecast 2024-2029 ($ million)
Chart on France - Year-over-year growth 2024-2029 (%)
Data Table on France - Year-over-year growth 2024-2029 (%)

12.6.4 Italy - Market size and forecast 2024-2029

Chart on Italy - Market size and forecast 2024-2029 ($ million)
Data Table on Italy - Market size and forecast 2024-2029 ($ million)
Chart on Italy - Year-over-year growth 2024-2029 (%)
Data Table on Italy - Year-over-year growth 2024-2029 (%)

12.6.5 The Netherlands - Market size and forecast 2024-2029

Chart on The Netherlands - Market size and forecast 2024-2029 ($ million)
Data Table on The Netherlands - Market size and forecast 2024-2029 ($ million)
Chart on The Netherlands - Year-over-year growth 2024-2029 (%)
Data Table on The Netherlands - Year-over-year growth 2024-2029 (%)

12.6.6 Spain - Market size and forecast 2024-2029

Chart on Spain - Market size and forecast 2024-2029 ($ million)
Data Table on Spain - Market size and forecast 2024-2029 ($ million)
Chart on Spain - Year-over-year growth 2024-2029 (%)
Data Table on Spain - Year-over-year growth 2024-2029 (%)

12.7 Middle East and Africa - Market size and forecast 2024-2029

Chart on Middle East and Africa - Market size and forecast 2024-2029 ($ million)
Data Table on Middle East and Africa - Market size and forecast 2024-2029 ($ million)
Chart on Middle East and Africa - Year-over-year growth 2024-2029 (%)
Data Table on Middle East and Africa - Year-over-year growth 2024-2029 (%)
Chart on Regional Comparison - Middle East and Africa
Data Table on Regional Comparison - Middle East and Africa

12.7.1 Saudi Arabia - Market size and forecast 2024-2029

Chart on Saudi Arabia - Market size and forecast 2024-2029 ($ million)
Data Table on Saudi Arabia - Market size and forecast 2024-2029 ($ million)
Chart on Saudi Arabia - Year-over-year growth 2024-2029 (%)
Data Table on Saudi Arabia - Year-over-year growth 2024-2029 (%)

12.7.2 UAE - Market size and forecast 2024-2029

Chart on UAE - Market size and forecast 2024-2029 ($ million)
Data Table on UAE - Market size and forecast 2024-2029 ($ million)
Chart on UAE - Year-over-year growth 2024-2029 (%)
Data Table on UAE - Year-over-year growth 2024-2029 (%)

12.7.3 South Africa - Market size and forecast 2024-2029

Chart on South Africa - Market size and forecast 2024-2029 ($ million)
Data Table on South Africa - Market size and forecast 2024-2029 ($ million)
Chart on South Africa - Year-over-year growth 2024-2029 (%)
Data Table on South Africa - Year-over-year growth 2024-2029 (%)

12.7.4 Israel - Market size and forecast 2024-2029

Chart on Israel - Market size and forecast 2024-2029 ($ million)
Data Table on Israel - Market size and forecast 2024-2029 ($ million)
Chart on Israel - Year-over-year growth 2024-2029 (%)
Data Table on Israel - Year-over-year growth 2024-2029 (%)

12.7.5 Turkey - Market size and forecast 2024-2029

Chart on Turkey - Market size and forecast 2024-2029 ($ million)
Data Table on Turkey - Market size and forecast 2024-2029 ($ million)
Chart on Turkey - Year-over-year growth 2024-2029 (%)
Data Table on Turkey - Year-over-year growth 2024-2029 (%)

12.8 Market opportunity by geography

Market opportunity by geography ($ million)
Data Tables on Market opportunity by geography ($ million)

13. Drivers, Challenges, and Opportunity

13.1 Market drivers

Globalization of consumer palates and demand for novel flavors
Pervasive health and wellness trends and rise of functional foods
Innovation in agri-food technology and supply chain management

13.2 Market challenges

Navigating complex regulatory frameworks and phytosanitary barriers
Insufficient market penetration
Agronomic constraints and production inconsistency

13.3 Impact of drivers and challenges

Impact of drivers and challenges in 2024 and 2029

13.4 Market opportunities

Proliferation of plant-based diets and demand for vegan ingredients
Strategic agricultural investment
Expansion into cosmecuticals and natural personal care sector

14. Competitive Landscape

14.1 Overview

14.2

Overview on criticality of inputs and factors of differentiation

14.3 Landscape disruption

Overview on factors of disruption

14.4 Industry risks

Impact of key risks on business

15. Competitive Analysis

15.1 Companies profiled

Companies covered

15.2 Company ranking index

15.3 Market positioning of companies

Matrix on companies position and classification

15.4 Anabana

Anabana - Overview
Anabana - Product / Service
Anabana - Key offerings
SWOT

15.5 Aseptic Fruit Purees

Aseptic Fruit Purees - Overview
Aseptic Fruit Purees - Product / Service
Aseptic Fruit Purees - Key offerings
SWOT

15.6 Del Carmen Foods

Del Carmen Foods - Overview
Del Carmen Foods - Product / Service
Del Carmen Foods - Key offerings
SWOT

15.7 Flavorah Worldwide Inc.

Flavorah Worldwide Inc. - Overview
Flavorah Worldwide Inc. - Product / Service
Flavorah Worldwide Inc. - Key offerings
SWOT

15.8 Goya Foods Inc.

Goya Foods Inc. - Overview
Goya Foods Inc. - Product / Service
Goya Foods Inc. - Key offerings
SWOT

15.9 Guanabana de Canarias

Guanabana de Canarias - Overview
Guanabana de Canarias - Product / Service
Guanabana de Canarias - Key offerings
SWOT

15.10 Holistic Organic Farm

Holistic Organic Farm - Overview
Holistic Organic Farm - Product / Service
Holistic Organic Farm - Key offerings
SWOT

15.11 iHeartFruitBox

iHeartFruitBox - Overview
iHeartFruitBox - Product / Service
iHeartFruitBox - Key offerings
SWOT

15.12 KHUMSUB

KHUMSUB - Overview
KHUMSUB - Product / Service
KHUMSUB - Key offerings
SWOT

15.13 Miami Fruit LLC

Miami Fruit LLC - Overview
Miami Fruit LLC - Product / Service
Miami Fruit LLC - Key offerings
SWOT

15.14 NAFOODS GROUP JSC

NAFOODS GROUP JSC - Overview
NAFOODS GROUP JSC - Product / Service
NAFOODS GROUP JSC - Key offerings
SWOT

15.15 NOW Health Group Inc.

NOW Health Group Inc. - Overview
NOW Health Group Inc. - Product / Service
NOW Health Group Inc. - Key offerings
SWOT

15.16 Robert Is Here Inc.

Robert Is Here Inc. - Overview
Robert Is Here Inc. - Product / Service
Robert Is Here Inc. - Key offerings
SWOT

15.17 Superior Foods

Superior Foods - Overview
Superior Foods - Product / Service
Superior Foods - Key offerings
SWOT

15.18 ZooScape LLC

ZooScape LLC - Overview
ZooScape LLC - Product / Service
ZooScape LLC - Key offerings
SWOT

16. Appendix

16.1 Scope of the report

Market definition
Objectives
Notes and caveats

16.2 Inclusions and exclusions checklist

Inclusions checklist
Exclusions checklist

16.3 Currency conversion rates for US$

16.4 Research methodology

16.5 Data procurement

Information sources

16.6 Data validation

16.7 Validation techniques employed for market sizing

16.8 Data synthesis

16.9 360 degree market analysis

16.10 List of abbreviations

Research Methodology

Technavio presents a detailed picture of the market by way of study, synthesis, and summation of data from multiple sources. The analysts have presented the various facets of the market with a particular focus on identifying the key industry influencers. The data thus presented is comprehensive, reliable, and the result of extensive research, both primary and secondary.

INFORMATION SOURCES

Primary sources

  • Manufacturers and suppliers
  • Channel partners
  • Industry experts
  • Strategic decision makers

Secondary sources

  • Industry journals and periodicals
  • Government data
  • Financial reports of key industry players
  • Historical data
  • Press releases

DATA ANALYSIS

Data Synthesis

  • Collation of data
  • Estimation of key figures
  • Analysis of derived insights

Data Validation

  • Triangulation with data models
  • Reference against proprietary databases
  • Corroboration with industry experts

REPORT WRITING

Qualitative

  • Market drivers
  • Market challenges
  • Market trends
  • Five forces analysis

Quantitative

  • Market size and forecast
  • Market segmentation
  • Geographical insights
  • Competitive landscape

Interested in this report?

Get your sample now to see our research methodology and insights!

Download Now

Frequently Asked Questions

Guanabana market growth will increase by USD 111.6 million during 2025-2029 .

The Guanabana market is expected to grow at a CAGR of 10.5% during 2025-2029 .

Guanabana market is segmented by Type (Processed, Raw) Distribution channel (Hypermarkets and supermarkets, Direct selling, Convenience stores, Online retail, Others) End-user (Food processing industry, Pharmaceuticals, Nutraceuticals, Cosmetics and personal care, Others)

Amelia, Anabana, Aseptic Fruit Purees, Del Carmen Foods, Flavorah Worldwide Inc., Goya Foods Inc., Grupo Jumex, Guanabana de Canarias, Holistic Organic Farm, iHeartFruitBox, KHUMSUB, Miami Fruit LLC, NAFOODS GROUP JSC, NOW Health Group Inc., Raintree, Robert Is Here Inc., Sunshine Naturals Inc., Superior Foods, ZooScape LLC are a few of the key vendors in the Guanabana market.

South America will register the highest growth rate of 32% among the other regions. Therefore, the Guanabana market in South America is expected to garner significant business opportunities for the vendors during the forecast period.

Brazil, Colombia, Argentina, China, Japan, India, South Korea, Australia, Indonesia, US, Canada, Mexico, UK, Germany, France, Italy, The Netherlands, Spain, Saudi Arabia, UAE, South Africa, Israel, Turkey

  • Globalization of consumer palates and demand for novel flavors is the driving factor this market.

The Guanabana market vendors should focus on grabbing business opportunities from the Type segment as it accounted for the largest market share in the base year.