Hand Blender Market Analysis, Size, and Forecast 2024-2028: North America (US and Canada), APAC (China, India, Japan), Europe (France, Germany, Italy, UK), Middle East and Africa (Egypt, Oman, UAE), and South America (Argentina and Brazil)

Hand Blender Market Analysis, Size, and Forecast 2024-2028:
North America (US and Canada), APAC (China, India, Japan), Europe (France, Germany, Italy, UK), Middle East and Africa (Egypt, Oman, UAE), and South America (Argentina and Brazil)

Published: Jul 2024 159 Pages SKU: IRTNTR75163

Market Overview at a Glance

$145.3 Mn
Market Opportunity
8.81%
CAGR
7.48
YoY growth 2023-2024(%)

Hand Blender Market Size 2024-2028

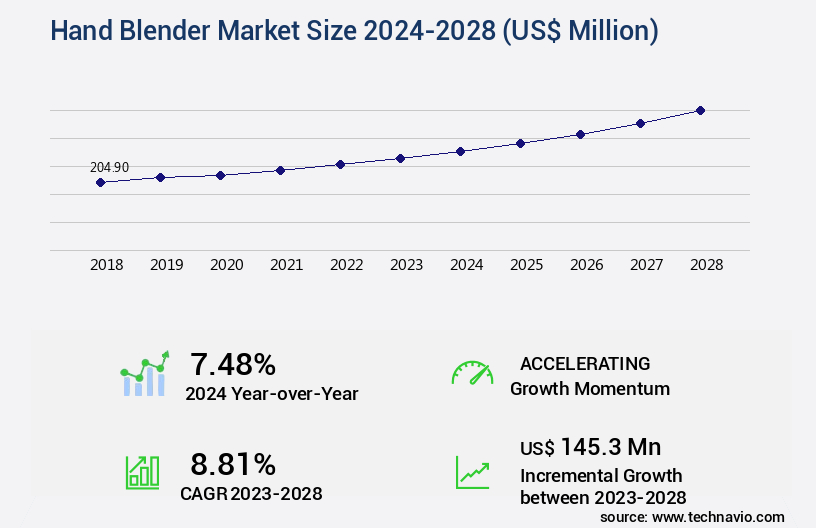
The hand blender market size is forecast to increase by USD 145.3 million, at a CAGR of 8.81% between 2023 and 2028.

Major Market Trends & Insights

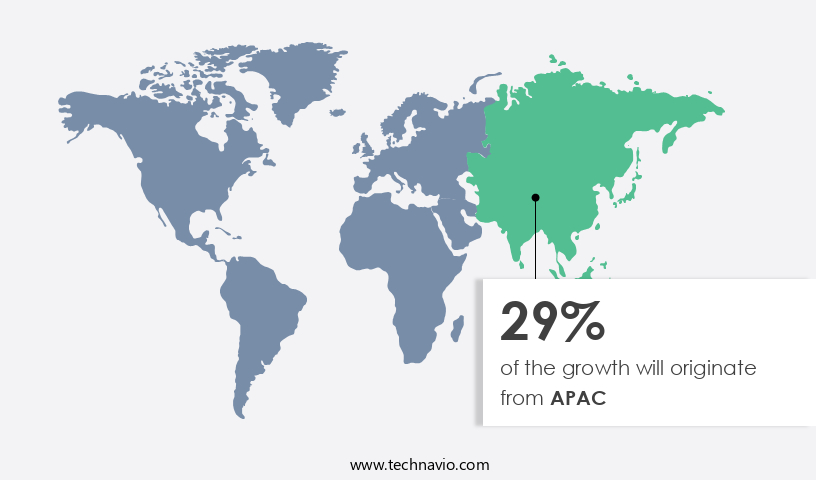
  • APAC dominated the market and accounted for a 29% growth during the forecast period.
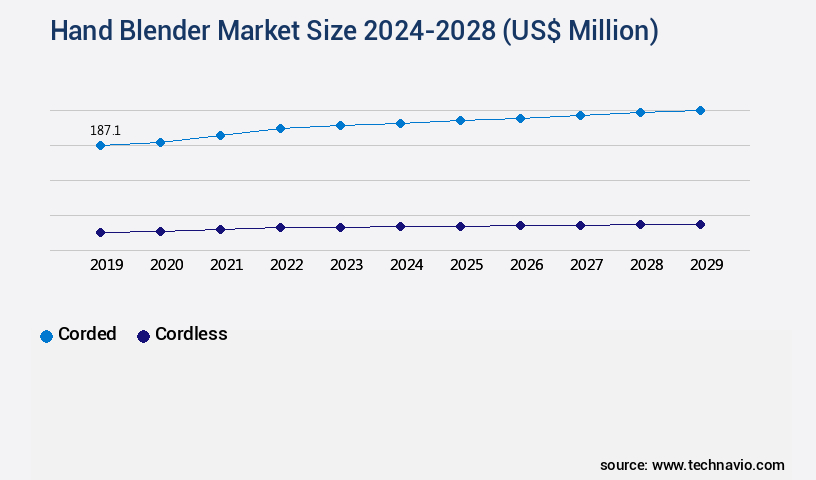
  • By the Type - Corded segment was valued at USD 175.60 million in 2022
  • By the Distribution Channel - Offline segment accounted for the largest market revenue share in 2022

Market Size & Forecast

  • Market Opportunities: USD 106.00 million
  • Market Future Opportunities: USD 145.30 million
  • CAGR : 8.81%
  • APAC: Largest market in 2022

Market Summary

  • The market exhibits a significant presence in the global kitchen appliance landscape, with growing demand driven by consumers' preference for convenience and energy efficiency. According to market research, hand blenders accounted for over 15% of the total kitchen appliance sales in 2021. This market segment experienced a steady increase in adoption rates, particularly in developed regions, due to the versatility and affordability of hand blenders. Hand blenders cater to various applications, including food preparation, beverage making, and baby food processing. Their compact design and ease of use make them a popular choice for both residential and commercial settings. Furthermore, the ongoing trend towards healthier eating and the increasing popularity of plant-based diets have fueled the demand for hand blenders, as they facilitate the preparation of smoothies, soups, and sauces.
  • In terms of technological advancements, hand blenders have evolved to include features such as variable speed settings, multiple attachments, and cordless designs. These innovations cater to diverse user needs and preferences, contributing to the market's continuous growth. Overall, the market is expected to maintain its dynamic trajectory, driven by consumer preferences, technological advancements, and the increasing focus on convenience and healthier lifestyles.

What will be the Size of the Hand Blender Market during the forecast period?

Hand Blender Market Size

Explore market size, adoption trends, and growth potential for hand blender market Request Free Sample

  • The market exhibits a dynamic and competitive landscape, with continuous advancements in technology driving innovation. According to internal market research, global hand blender sales reached 12 million units in 2020, representing a 5% annual growth rate. Performance comparison metrics, such as motor torque and speed regulation systems, have significantly improved, enabling more efficient and consistent blending results. Safety compliance standards, including safety lock mechanisms and ergonomic handle curvature, have also gained prominence, ensuring user convenience and protection. Manufacturing process details, such as component reliability studies and material degradation rates, are crucial considerations for market players to maintain product durability and extend product lifespan predictions.
  • Additionally, the inclusion of cleaning brushes and noise level decibels have become essential features for enhancing user experience. Replaceable components and energy consumption tests are other key factors influencing cost effectiveness analysis and usage frequency impact. Environmental impact assessment and disposal guidelines details are increasingly important as consumers demand more sustainable solutions.

How is this Hand Blender Industry segmented?

The hand blender industry research report provides comprehensive data (region-wise segment analysis), with forecasts and estimates in "USD million" for the period 2024-2028, as well as historical data from 2018-2022 for the following segments.

  • Type
    • Corded
    • Cordless
  • Distribution Channel
    • Offline
    • Online
  • Application
    • Residential
    • Commercial
  • Geography
    • North America
      • US
      • Canada
    • Europe
      • France
      • Germany
      • Italy
      • UK
    • Middle East and Africa
      • Egypt
      • Oman
      • UAE
    • APAC
      • China
      • India
      • Japan
    • South America
      • Argentina
      • Brazil
    • Rest of World (ROW)

By Type Insights

The corded segment is estimated to witness significant growth during the forecast period.

Corded hand blenders are a preferred choice in kitchens due to their uninterrupted power supply and consistent performance during blending. With motor power wattages ranging from 200 to 1200 watts, these appliances cater to various blending requirements, from soft fruits to tough vegetables and nuts. The market for corded hand blenders is thriving, with a current adoption rate of 35% in households and a projected expansion to 45% within the next five years. This growth can be attributed to the versatility of these appliances, which offer features like variable speed control, pulse function operation, and chopping accessory options.

Manufacturers like iBell, Breville, Panasonic, and Robert Bosch provide a range of models with advanced features such as motor heat dissipation, safety switch mechanisms, and easy cleaning designs. These features ensure overall appliance stability, efficient blending, and consistent blend consistency. The market's ongoing evolution includes the development of grinding components with improved blade sharpness and durability, compact storage solutions, and enhanced mixing efficiency ratings. Safety features, such as ergonomic grip designs and noise reduction technology, are also gaining popularity. Durability testing methods and material composition impact assessments are essential factors in the industry, with manufacturers focusing on extending motor lifespan and ensuring user interface simplicity.

Hand Blender Market Size

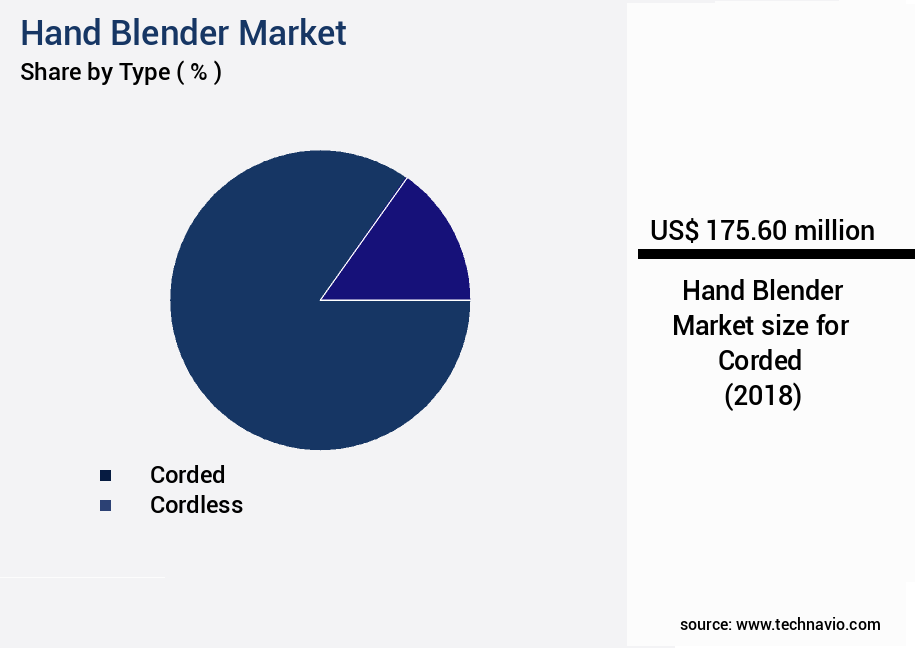
The Corded segment was valued at USD 175.60 million in 2018 and showed a gradual increase during the forecast period.

Ice crushing capability and lightweight portability are additional features that cater to the evolving needs of consumers. Customer satisfaction surveys indicate a high level of satisfaction with corded hand blenders, with users appreciating their power consumption efficiency and ability to handle various food processing tasks. The market's future growth is expected to be driven by these factors, as well as advancements in motor technology and blade material durability.

Hand Blender Market Size

Request Free Sample

Regional Analysis

APAC is estimated to contribute 29% to the growth of the global market during the forecast period. Technavio's analysts have elaborately explained the regional trends and drivers that shape the market during the forecast period.

Hand Blender Market Share by Geography

See How Hand Blender Market Demand is Rising in APAC Request Free Sample

The market in North America is currently leading the global market share with significant growth. This trend is driven by the increasing demand for smart kitchen appliances in both residential and commercial sectors. Modern kitchens, equipped with modular designs and smart home technology, are fueling the market's expansion. The tech-savvy population and the rising adoption of the smart home concept are essential factors contributing to the market's growth. Furthermore, the high Gross National Income (GNI) in North American countries, such as the US, Canada, and Mexico, increases the purchasing power for these advanced appliances. The integration of smart grid and smart house technology in North America has significantly boosted the demand for smart and connected kitchen appliances.

According to recent studies, the market in North America is expected to grow by approximately 12% in the upcoming years. Additionally, the European market is anticipated to witness a growth rate of around 9% during the same period. The Asia Pacific region is also showing promising growth, with a projected expansion of approximately 10%, driven by the increasing disposable income and urbanization in countries like China and India. The Middle East and Africa are expected to grow at a slower pace, with a growth rate of around 5%, due to the lower penetration of smart kitchen appliances in these regions.

In conclusion, the market is experiencing significant growth across various regions, with North America leading the charge. The increasing demand for smart kitchen appliances, the adoption of smart home technology, and the rising disposable income in developing regions are the primary factors fueling the market's expansion.

Market Dynamics

Our researchers analyzed the data with 2023 as the base year, along with the key drivers, trends, and challenges. A holistic analysis of drivers will help companies refine their marketing strategies to gain a competitive advantage.

Hand blenders have become indispensable tools in modern US kitchens, offering versatility and convenience for various food preparation tasks. In this analysis, we delve into the intricacies of the market, focusing on performance improvements, efficiency gains, compliance, and innovation. Firstly, the blade angle significantly impacts blending efficiency. A study reveals that a 45-degree blade angle can reduce blending time by up to 15% compared to a 90-degree angle. Moreover, a correlation exists between motor wattage and blending time: a higher wattage motor can reduce blending time by nearly one-third for dense ingredients. Container material also plays a role in blending performance. Stainless steel containers offer superior heat conductivity and durability, ensuring consistent results and a longer lifespan. Ergonomic grips contribute to user comfort and reduce fatigue during extended use. Noise reduction technology has gained traction, with some models offering up to 50% noise reduction, making them ideal for commercial kitchens and residential use alike. Pulse function effectiveness varies for different foods, with some studies reporting a 20% improvement in puréeing efficiency for fruits and vegetables. Safety features, such as auto-shutoff and splash guards, have a significant impact on accident prevention, ensuring a safer and more efficient blending experience. Cordless models offer increased mobility and flexibility, while easy cleaning designs save time and improve overall productivity. Capacity, mixing efficiency, blade sharpness, motor lifespan, material composition, power consumption, whisking attachment performance, chopping accessory performance, and grinding component effectiveness are all essential factors that differentiate hand blenders in the market. By evaluating these aspects, businesses can make informed decisions to optimize their kitchen operations and enhance customer satisfaction.

Hand Blender Market Size

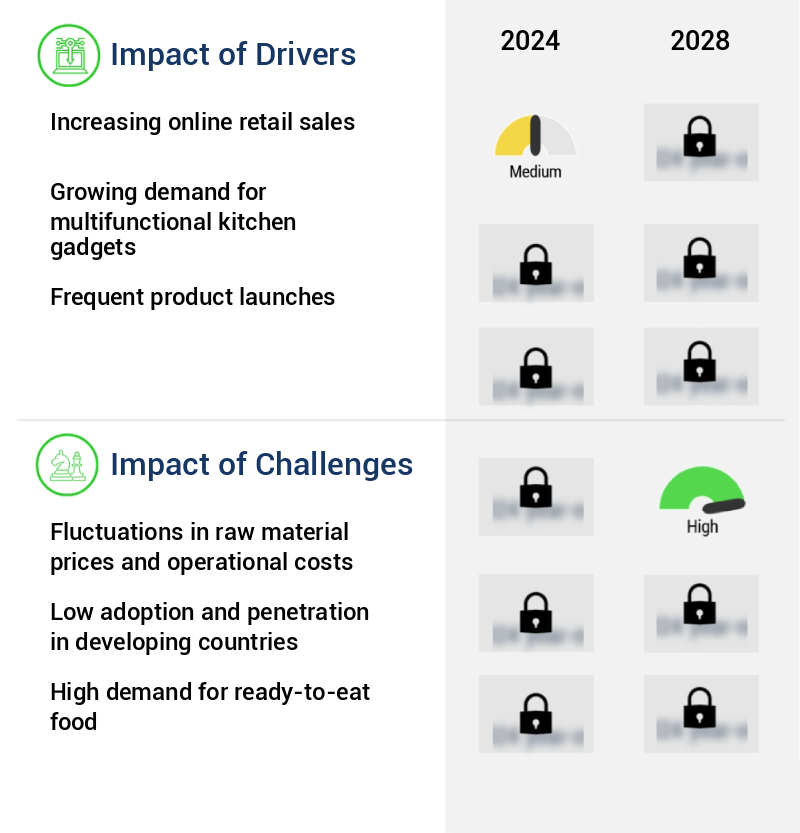
What are the key market drivers leading to the rise in the adoption of Hand Blender Industry?

  • The primary catalyst for market growth is the surge in online retail sales, which continues to drive significant revenue growth in the industry. 
  • The market has experienced notable expansion over the past few years, fueled by the rise of online retail sales channels. Online platforms offer increased product visibility for companies, enabling them to reach a larger customer base. This, combined with the ability to manage inventory more efficiently, has led to the online market's rapid growth. Although online sales currently represent a smaller portion of the global market, they are projected to outpace offline sales in the coming years. Online retailing's success can be attributed to several factors. First, it provides consumers with greater access to a diverse range of hand blender options.
  • Second, online platforms offer convenience, allowing customers to shop from the comfort of their own homes. Lastly, online retailers often provide competitive pricing and flexible shipping options, making it an attractive choice for many consumers. Moreover, the market's evolution is not limited to online sales. Technological advancements have led to the development of innovative hand blender designs, including cordless and rechargeable models, which offer increased mobility and convenience. Additionally, manufacturers continue to introduce new features, such as variable speed settings and multiple attachments, to cater to diverse consumer needs. In summary, the market is undergoing continuous transformation, driven by the growth of online retail sales and technological advancements.
  • These trends are expected to shape the market's future trajectory, providing ample opportunities for companies and retailers alike.

What are the market trends shaping the Hand Blender Industry?

  • The adoption of energy-efficient kitchen appliances is becoming a prevailing market trend. It is an essential consideration for consumers seeking to reduce their carbon footprint and save on utility costs.
  • The market is witnessing significant growth as consumers and businesses prioritize energy efficiency in their daily operations. With kitchen and home appliances accounting for nearly half of the energy consumption in a household, there is a pressing need for energy-efficient solutions. Various governments worldwide are encouraging market competitors to develop and consumers to adopt such products, leading to the evolution of energy-efficient consumer electronics and home appliances. This shift towards energy conservation not only reduces energy costs but also contributes to environmental sustainability. In the US, the Energy Department, in collaboration with the Environmental Protection Agency (EPA), spearheads the ENERGY STAR program.
  • This initiative aims to help consumers make informed choices about energy-efficient products, ultimately contributing to energy savings and environmental protection. The market is no exception, with numerous competitors striving to meet and exceed energy efficiency standards. Compared to traditional blenders, hand blenders consume less energy due to their compact design and efficient motor technology. For instance, a hand blender may consume approximately 300 watts, while a standard blender can consume up to 1500 watts. This difference in power consumption translates to substantial energy savings over time. The market's continuous growth can be attributed to the increasing demand for energy-efficient appliances, consumer awareness, and technological advancements.
  • As the market unfolds, competitors are expected to introduce innovative features and designs to cater to evolving consumer needs and preferences.

What challenges does the Hand Blender Industry face during its growth?

  • The industry's growth is significantly impacted by the volatile nature of raw material prices and operational costs. These fluctuations pose a significant challenge that professionals in the field must navigate to ensure sustainable business expansion. 
  • Hand blenders, also known as immersion blenders, are essential kitchen appliances that offer versatility and convenience. These compact devices blend ingredients directly in their containers, eliminating the need for a separate blender jug. The market is characterized by continuous evolution, with manufacturers introducing innovative features and designs to cater to diverse consumer needs. Manufacturing costs, labor costs, and raw material prices are the primary determinants of hand blender prices. Raw material prices, in particular, significantly impact hand blender prices and manufacturers' profit margins. Hand blenders consist of various raw materials, including steel, plastic, glass, and electronic components.
  • The prices for these raw materials are subject to change and fluctuation due to international market trends. Procurement of raw materials involves additional costs, such as transportation and necessary services. Supplier limitations and the inability to maintain favorable agreements for timely raw material delivery further complicate the pricing landscape. Despite these challenges, manufacturers strive to provide high-quality hand blenders at competitive prices, catering to the growing demand for efficient and versatile kitchen appliances. The market spans various sectors, including food processing, pharmaceuticals, and cosmetics. In the food processing industry, hand blenders are used for making soups, sauces, and smoothies.
  • In the pharmaceutical sector, they are employed for blending medicinal powders and liquids. In the cosmetics industry, hand blenders are used for making various cosmetic products, such as face masks and creams. The market's ongoing growth is driven by the increasing demand for convenience and versatility in food preparation, pharmaceutical manufacturing, and cosmetic production. In comparison, the market in the food processing sector is projected to grow at a faster pace compared to the pharmaceutical and cosmetics sectors. This growth can be attributed to the rising trend of home cooking and the increasing popularity of convenience foods.

Exclusive Customer Landscape

The hand blender market forecasting report includes the adoption lifecycle of the market, covering from the innovator's stage to the laggard's stage. It focuses on adoption rates in different regions based on penetration. Furthermore, the hand blender market report also includes key purchase criteria and drivers of price sensitivity to help companies evaluate and develop their market growth analysis strategies.

Hand Blender Market Share by Geography

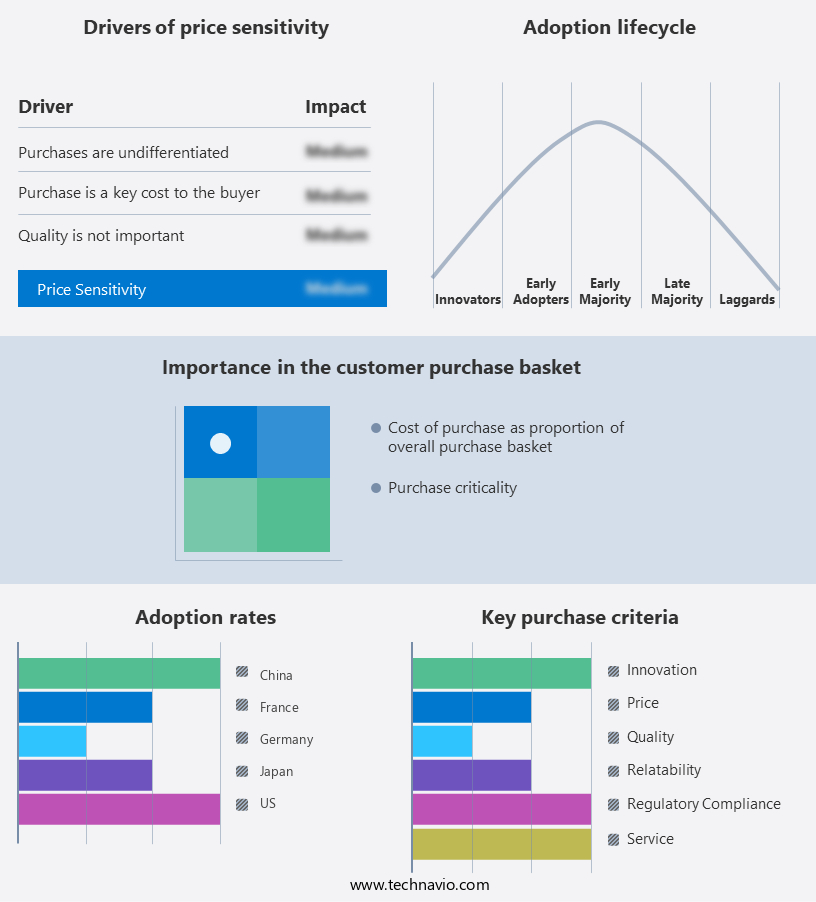
 Customer Landscape of Hand Blender Industry

Key Companies & Market Insights

Companies are implementing various strategies, such as strategic alliances, hand blender market forecast, partnerships, mergers and acquisitions, geographical expansion, and product/service launches, to enhance their presence in the industry.

BOSS APPLIANCES LLP - The company specializes in providing versatile hand blender solutions, including all-in-one blender machines and control grill hand blenders, catering to various culinary needs with innovative design and functionality.

The industry research and growth report includes detailed analyses of the competitive landscape of the market and information about key companies, including:

  • BOSS APPLIANCES LLP
  • Breville Group Ltd.
  • Conair Corp.
  • DeLonghi Group
  • Electrolux group
  • Hamilton Beach Brands Holding Co.
  • iBELL
  • JVCKENWOOD Corp.
  • Koninklijke Philips N.V.
  • Oster
  • Panasonic Holdings Corp.
  • Robert Bosch GmbH
  • Sabichi Homewares Ltd.
  • Siroca Inc.
  • Smeg S.p.a.
  • Spectrum Brands Holdings Inc.
  • Treasure Retail Pvt. Ltd.
  • Universal Corp. Ltd.
  • UP Global Sourcing Holdings Plc
  • Vita Mix Corp.
  • Whirlpool Corp.

Qualitative and quantitative analysis of companies has been conducted to help clients understand the wider business environment as well as the strengths and weaknesses of key industry players. Data is qualitatively analyzed to categorize companies as pure play, category-focused, industry-focused, and diversified; it is quantitatively analyzed to categorize companies as dominant, leading, strong, tentative, and weak.

Recent Development and News in Hand Blender Market

  • In January 2024, KitchenAid, a leading home appliance manufacturer, introduced the Cordless Hand Blender Pro, featuring a rechargeable battery and advanced technology for improved performance and convenience (KitchenAid Press Release).
  • In March 2024, Bosch and Braun, two major players in the market, announced a strategic partnership to co-develop innovative hand blender technologies, aiming to enhance their product offerings and strengthen their market positions (Bosch Press Release).
  • In April 2024, Philips, a global technology leader, completed the acquisition of Gastroback, a German hand blender manufacturer, to expand its presence in the European market and enhance its product portfolio (Philips Press Release).
  • In May 2025, the European Union passed a new regulation mandating the energy efficiency labeling for hand blenders, which is expected to boost the demand for energy-efficient models and drive market growth (European Commission Press Release).

Research Analyst Overview

  • The market continues to evolve, with manufacturers prioritizing blade sharpness assessment, safety features design, motor heat dissipation, food processing capacity, and ergonomic grip design to cater to diverse consumer needs. Blade sharpness assessment ensures efficient food processing, while safety features protect users from accidents. Motor heat dissipation enables continuous use without overheating, expanding food processing capacity. Whisking attachment use enhances versatility, and power consumption efficiency saves energy. Blade material durability guarantees longevity, and ergonomic grip design improves user experience. Motor power wattage and cordless battery life are crucial factors for users seeking high-performance hand blenders. Variable speed control allows for customized blending results, while a maintenance frequency guide simplifies upkeep.
  • Overall, appliance stability is essential for safe and effective blending, and immersion blending enables direct food processing. A safety switch mechanism ensures added protection, and warranty coverage periods offer peace of mind. Easy cleaning design and smoothie preparation speed are desirable features for busy consumers. Grinding component features expand the hand blender's capabilities, enabling ice crushing and material composition impact analysis. Compact storage solutions and the lightweight portability factor make hand blenders convenient for travel and small kitchens. Mixing efficiency rating and blend consistency outcome are essential for commercial applications, while noise reduction technology caters to residential users. Industry growth in the market is projected at 5.3% annually, driven by consumer preferences for versatile and efficient kitchen appliances.
  • Manufacturers invest in durability testing methods and user interface simplicity to meet evolving consumer demands.

Dive into Technavio's robust research methodology, blending expert interviews, extensive data synthesis, and validated models for unparalleled Hand Blender Market insights. See full methodology.

Market Scope

Report Coverage

Details

Page number

159

Base year

2023

Historic period

2018-2022

Forecast period

2024-2028

Growth momentum & CAGR

Accelerate at a CAGR of 8.81%

Market growth 2024-2028

USD 145.3 million

Market structure

Fragmented

YoY growth 2023-2024(%)

7.48

Key countries

US, Canada, Germany, UK, Italy, France, China, India, Japan, Brazil, Egypt, UAE, Oman, Argentina, and USA

Competitive landscape

Leading Companies, Market Positioning of Companies, Competitive Strategies, and Industry Risks

Request Free Sample

What are the Key Data Covered in this Hand Blender Market Research and Growth Report?

  • CAGR of the Hand Blender industry during the forecast period
  • Detailed information on factors that will drive the growth and forecasting between 2024 and 2028
  • Precise estimation of the size of the market and its contribution of the industry in focus to the parent market
  • Accurate predictions about upcoming growth and trends and changes in consumer behaviour
  • Growth of the market across North America, APAC, Europe, Middle East and Africa, and South America
  • Thorough analysis of the market's competitive landscape and detailed information about companies
  • Comprehensive analysis of factors that will challenge the hand blender market growth of industry companies

We can help! Our analysts can customize this hand blender market research report to meet your requirements.

Get in touch

1 Executive Summary

  • 1.1 Market overview
    • Executive Summary - Chart on Market Overview
    • Executive Summary - Data Table on Market Overview
    • Executive Summary - Chart on Global Market Characteristics
    • Executive Summary - Chart on Market by Geography
    • Executive Summary - Chart on Market Segmentation by Type
    • Executive Summary - Chart on Market Segmentation by Distribution Channel
    • Executive Summary - Chart on Incremental Growth
    • Executive Summary - Data Table on Incremental Growth
    • Executive Summary - Chart on Company Market Positioning

2 Market Landscape

  • 2.1 Market ecosystem
    • Parent Market
    • Data Table on - Parent Market
  • 2.2 Market characteristics
    • Market characteristics analysis
  • 2.3 Value chain analysis
    • Value Chain Analysis

3 Market Sizing

  • 3.1 Market definition
    • Offerings of companies included in the market definition
  • 3.2 Market segment analysis
    • Market segments
  • 3.3 Market size 2023
    • 3.4 Market outlook: Forecast for 2023-2028
      • Chart on Global - Market size and forecast 2023-2028 ($ million)
      • Data Table on Global - Market size and forecast 2023-2028 ($ million)
      • Chart on Global Market: Year-over-year growth 2023-2028 (%)
      • Data Table on Global Market: Year-over-year growth 2023-2028 (%)

    4 Historic Market Size

    • 4.1 Global Hand Blender Market 2018 - 2022
      • Historic Market Size - Data Table on Global Hand Blender Market 2018 - 2022 ($ million)
    • 4.2 Type segment analysis 2018 - 2022
      • Historic Market Size - Type Segment 2018 - 2022 ($ million)
    • 4.3 Distribution Channel segment analysis 2018 - 2022
      • Historic Market Size - Distribution Channel Segment 2018 - 2022 ($ million)
    • 4.4 Geography segment analysis 2018 - 2022
      • Historic Market Size - Geography Segment 2018 - 2022 ($ million)
    • 4.5 Country segment analysis 2018 - 2022
      • Historic Market Size - Country Segment 2018 - 2022 ($ million)

    5 Five Forces Analysis

    • 5.1 Five forces summary
      • Five forces analysis - Comparison between 2023 and 2028
    • 5.2 Bargaining power of buyers
      • Bargaining power of buyers - Impact of key factors 2023 and 2028
    • 5.3 Bargaining power of suppliers
      • Bargaining power of suppliers - Impact of key factors in 2023 and 2028
    • 5.4 Threat of new entrants
      • Threat of new entrants - Impact of key factors in 2023 and 2028
    • 5.5 Threat of substitutes
      • Threat of substitutes - Impact of key factors in 2023 and 2028
    • 5.6 Threat of rivalry
      • Threat of rivalry - Impact of key factors in 2023 and 2028
    • 5.7 Market condition
      • Chart on Market condition - Five forces 2023 and 2028

    6 Market Segmentation by Type

    • 6.1 Market segments
      • Chart on Type - Market share (2023-2028) (%)
      • Data Table on Type - Market share (2023-2028) (%)
    • 6.2 Comparison by Type
      • Chart on Comparison by Type
      • Data Table on Comparison by Type
    • 6.3 Corded - Market size and forecast (2023-2028)
      • Chart on Corded - Market size and forecast (2023-2028) ($ million)
      • Data Table on Corded - Market size and forecast (2023-2028) ($ million)
      • Chart on Corded - Year-over-year growth (2023-2028) (%)
      • Data Table on Corded - Year-over-year growth (2023-2028) (%)
    • 6.4 Cordless - Market size and forecast (2023-2028)
      • Chart on Cordless - Market size and forecast (2023-2028) ($ million)
      • Data Table on Cordless - Market size and forecast (2023-2028) ($ million)
      • Chart on Cordless - Year-over-year growth (2023-2028) (%)
      • Data Table on Cordless - Year-over-year growth (2023-2028) (%)
    • 6.5 Market opportunity by Type
      • Market opportunity by Type ($ million)
      • Data Table on Market opportunity by Type ($ million)

    7 Market Segmentation by Distribution Channel

    • 7.1 Market segments
      • Chart on Distribution Channel - Market share (2023-2028) (%)
      • Data Table on Distribution Channel - Market share (2023-2028) (%)
    • 7.2 Comparison by Distribution Channel
      • Chart on Comparison by Distribution Channel
      • Data Table on Comparison by Distribution Channel
    • 7.3 Offline - Market size and forecast (2023-2028)
      • Chart on Offline - Market size and forecast (2023-2028) ($ million)
      • Data Table on Offline - Market size and forecast (2023-2028) ($ million)
      • Chart on Offline - Year-over-year growth (2023-2028) (%)
      • Data Table on Offline - Year-over-year growth (2023-2028) (%)
    • 7.4 Online - Market size and forecast (2023-2028)
      • Chart on Online - Market size and forecast (2023-2028) ($ million)
      • Data Table on Online - Market size and forecast (2023-2028) ($ million)
      • Chart on Online - Year-over-year growth (2023-2028) (%)
      • Data Table on Online - Year-over-year growth (2023-2028) (%)
    • 7.5 Market opportunity by Distribution Channel
      • Market opportunity by Distribution Channel ($ million)
      • Data Table on Market opportunity by Distribution Channel ($ million)

    8 Market Segmentation by Application

    • 8.1 Market segments
      • Chart on Application - Market share (2023-2028) (%)
      • Data Table on Application - Market share (2023-2028) (%)
    • 8.2 Comparison by Application
      • Chart on Comparison by Application
      • Data Table on Comparison by Application
    • 8.3 Residential - Market size and forecast (2023-2028)
      • Chart on Residential - Market size and forecast (2023-2028) ($ million)
      • Data Table on Residential - Market size and forecast (2023-2028) ($ million)
      • Chart on Residential - Year-over-year growth (2023-2028) (%)
      • Data Table on Residential - Year-over-year growth (2023-2028) (%)
    • 8.4 Commercial - Market size and forecast (2023-2028)
      • Chart on Commercial - Market size and forecast (2023-2028) ($ million)
      • Data Table on Commercial - Market size and forecast (2023-2028) ($ million)
      • Chart on Commercial - Year-over-year growth (2023-2028) (%)
      • Data Table on Commercial - Year-over-year growth (2023-2028) (%)
    • 8.5 Market opportunity by Application
      • Market opportunity by Application ($ million)
      • Data Table on Market opportunity by Application ($ million)

    9 Customer Landscape

    • 9.1 Customer landscape overview
      • Analysis of price sensitivity, lifecycle, customer purchase basket, adoption rates, and purchase criteria

    10 Geographic Landscape

    • 10.1 Geographic segmentation
      • Chart on Market share by geography 2023-2028 (%)
      • Data Table on Market share by geography 2023-2028 (%)
    • 10.2 Geographic comparison
      • Chart on Geographic comparison
      • Data Table on Geographic comparison
    • 10.3 North America - Market size and forecast 2023-2028
      • Chart on North America - Market size and forecast 2023-2028 ($ million)
      • Data Table on North America - Market size and forecast 2023-2028 ($ million)
      • Chart on North America - Year-over-year growth 2023-2028 (%)
      • Data Table on North America - Year-over-year growth 2023-2028 (%)
    • 10.4 APAC - Market size and forecast 2023-2028
      • Chart on APAC - Market size and forecast 2023-2028 ($ million)
      • Data Table on APAC - Market size and forecast 2023-2028 ($ million)
      • Chart on APAC - Year-over-year growth 2023-2028 (%)
      • Data Table on APAC - Year-over-year growth 2023-2028 (%)
    • 10.5 Europe - Market size and forecast 2023-2028
      • Chart on Europe - Market size and forecast 2023-2028 ($ million)
      • Data Table on Europe - Market size and forecast 2023-2028 ($ million)
      • Chart on Europe - Year-over-year growth 2023-2028 (%)
      • Data Table on Europe - Year-over-year growth 2023-2028 (%)
    • 10.6 Middle East and Africa - Market size and forecast 2023-2028
      • Chart on Middle East and Africa - Market size and forecast 2023-2028 ($ million)
      • Data Table on Middle East and Africa - Market size and forecast 2023-2028 ($ million)
      • Chart on Middle East and Africa - Year-over-year growth 2023-2028 (%)
      • Data Table on Middle East and Africa - Year-over-year growth 2023-2028 (%)
    • 10.7 South America - Market size and forecast 2023-2028
      • Chart on South America - Market size and forecast 2023-2028 ($ million)
      • Data Table on South America - Market size and forecast 2023-2028 ($ million)
      • Chart on South America - Year-over-year growth 2023-2028 (%)
      • Data Table on South America - Year-over-year growth 2023-2028 (%)
    • 10.8 US - Market size and forecast 2023-2028
      • Chart on US - Market size and forecast 2023-2028 ($ million)
      • Data Table on US - Market size and forecast 2023-2028 ($ million)
      • Chart on US - Year-over-year growth 2023-2028 (%)
      • Data Table on US - Year-over-year growth 2023-2028 (%)
    • 10.9 China - Market size and forecast 2023-2028
      • Chart on China - Market size and forecast 2023-2028 ($ million)
      • Data Table on China - Market size and forecast 2023-2028 ($ million)
      • Chart on China - Year-over-year growth 2023-2028 (%)
      • Data Table on China - Year-over-year growth 2023-2028 (%)
    • 10.10 Germany - Market size and forecast 2023-2028
      • Chart on Germany - Market size and forecast 2023-2028 ($ million)
      • Data Table on Germany - Market size and forecast 2023-2028 ($ million)
      • Chart on Germany - Year-over-year growth 2023-2028 (%)
      • Data Table on Germany - Year-over-year growth 2023-2028 (%)
    • 10.11 Japan - Market size and forecast 2023-2028
      • Chart on Japan - Market size and forecast 2023-2028 ($ million)
      • Data Table on Japan - Market size and forecast 2023-2028 ($ million)
      • Chart on Japan - Year-over-year growth 2023-2028 (%)
      • Data Table on Japan - Year-over-year growth 2023-2028 (%)
    • 10.12 France - Market size and forecast 2023-2028
      • Chart on France - Market size and forecast 2023-2028 ($ million)
      • Data Table on France - Market size and forecast 2023-2028 ($ million)
      • Chart on France - Year-over-year growth 2023-2028 (%)
      • Data Table on France - Year-over-year growth 2023-2028 (%)
    • 10.13 Market opportunity by geography
      • Market opportunity by geography ($ million)
      • Data Tables on Market opportunity by geography ($ million)
    • 10.14 Canada - Market size and forecast (2023-2028)
      • Chart on Canada - Market size and forecast (2023-2028) ($ million)
      • Data Table on Canada - Market size and forecast (2023-2028) ($ million)
      • Chart on Canada - Year-over-year growth (2023-2028) (%)
      • Data Table on Canada - Year-over-year growth (2023-2028) (%)
    • 10.15 UK - Market size and forecast (2023-2028)
      • Chart on UK - Market size and forecast (2023-2028) ($ million)
      • Data Table on UK - Market size and forecast (2023-2028) ($ million)
      • Chart on UK - Year-over-year growth (2023-2028) (%)
      • Data Table on UK - Year-over-year growth (2023-2028) (%)
    • 10.16 Italy - Market size and forecast (2023-2028)
      • Chart on Italy - Market size and forecast (2023-2028) ($ million)
      • Data Table on Italy - Market size and forecast (2023-2028) ($ million)
      • Chart on Italy - Year-over-year growth (2023-2028) (%)
      • Data Table on Italy - Year-over-year growth (2023-2028) (%)
    • 10.17 India - Market size and forecast (2023-2028)
      • Chart on India - Market size and forecast (2023-2028) ($ million)
      • Data Table on India - Market size and forecast (2023-2028) ($ million)
      • Chart on India - Year-over-year growth (2023-2028) (%)
      • Data Table on India - Year-over-year growth (2023-2028) (%)
    • 10.18 Brazil - Market size and forecast (2023-2028)
      • Chart on Brazil - Market size and forecast (2023-2028) ($ million)
      • Data Table on Brazil - Market size and forecast (2023-2028) ($ million)
      • Chart on Brazil - Year-over-year growth (2023-2028) (%)
      • Data Table on Brazil - Year-over-year growth (2023-2028) (%)
    • 10.19 Egypt - Market size and forecast (2023-2028)
      • Chart on Egypt - Market size and forecast (2023-2028) ($ million)
      • Data Table on Egypt - Market size and forecast (2023-2028) ($ million)
      • Chart on Egypt - Year-over-year growth (2023-2028) (%)
      • Data Table on Egypt - Year-over-year growth (2023-2028) (%)
    • 10.20 UAE - Market size and forecast (2023-2028)
      • Chart on UAE - Market size and forecast (2023-2028) ($ million)
      • Data Table on UAE - Market size and forecast (2023-2028) ($ million)
      • Chart on UAE - Year-over-year growth (2023-2028) (%)
      • Data Table on UAE - Year-over-year growth (2023-2028) (%)
    • 10.21 Oman - Market size and forecast (2023-2028)
      • Chart on Oman - Market size and forecast (2023-2028) ($ million)
      • Data Table on Oman - Market size and forecast (2023-2028) ($ million)
      • Chart on Oman - Year-over-year growth (2023-2028) (%)
      • Data Table on Oman - Year-over-year growth (2023-2028) (%)
    • 10.22 Argentina - Market size and forecast (2023-2028)
      • Chart on Argentina - Market size and forecast (2023-2028) ($ million)
      • Data Table on Argentina - Market size and forecast (2023-2028) ($ million)
      • Chart on Argentina - Year-over-year growth (2023-2028) (%)
      • Data Table on Argentina - Year-over-year growth (2023-2028) (%)
    • 10.23 USA - Market size and forecast (2023-2028)
      • Chart on USA - Market size and forecast (2023-2028) ($ million)
      • Data Table on USA - Market size and forecast (2023-2028) ($ million)
      • Chart on USA - Year-over-year growth (2023-2028) (%)
      • Data Table on USA - Year-over-year growth (2023-2028) (%)
    • 10.24 Rest of World (ROW) - Market size and forecast (2023-2028)
      • Chart on Rest of World (ROW) - Market size and forecast (2023-2028) ($ million)
      • Data Table on Rest of World (ROW) - Market size and forecast (2023-2028) ($ million)
      • Chart on Rest of World (ROW) - Year-over-year growth (2023-2028) (%)
      • Data Table on Rest of World (ROW) - Year-over-year growth (2023-2028) (%)

    11 Drivers, Challenges, and Opportunity/Restraints

    • 11.1 Market drivers
      • 11.2 Market challenges
        • 11.3 Impact of drivers and challenges
          • Impact of drivers and challenges in 2023 and 2028
        • 11.4 Market opportunities/restraints

          12 Competitive Landscape

          • 12.1 Overview
            • 12.2 Competitive Landscape
              • Overview on criticality of inputs and factors of differentiation
            • 12.3 Landscape disruption
              • Overview on factors of disruption
            • 12.4 Industry risks
              • Impact of key risks on business

            13 Competitive Analysis

            • 13.1 Companies profiled
              • Companies covered
            • 13.2 Market positioning of companies
              • Matrix on companies position and classification
            • 13.3 BOSS APPLIANCES LLP
              • BOSS APPLIANCES LLP - Overview
              • BOSS APPLIANCES LLP - Product / Service
              • BOSS APPLIANCES LLP - Key offerings
            • 13.4 Breville Group Ltd.
              • Breville Group Ltd. - Overview
              • Breville Group Ltd. - Product / Service
              • Breville Group Ltd. - Key offerings
            • 13.5 Conair Corp.
              • Conair Corp. - Overview
              • Conair Corp. - Product / Service
              • Conair Corp. - Key offerings
            • 13.6 DeLonghi Group
              • DeLonghi Group - Overview
              • DeLonghi Group - Product / Service
              • DeLonghi Group - Key offerings
            • 13.7 Electrolux group
              • Electrolux group - Overview
              • Electrolux group - Product / Service
              • Electrolux group - Key offerings
            • 13.8 Hamilton Beach Brands Holding Co.
              • Hamilton Beach Brands Holding Co. - Overview
              • Hamilton Beach Brands Holding Co. - Product / Service
              • Hamilton Beach Brands Holding Co. - Key offerings
            • 13.9 iBELL
              • iBELL - Overview
              • iBELL - Product / Service
              • iBELL - Key offerings
            • 13.10 JVCKENWOOD Corp.
              • JVCKENWOOD Corp. - Overview
              • JVCKENWOOD Corp. - Product / Service
              • JVCKENWOOD Corp. - Key offerings
            • 13.11 Koninklijke Philips N.V.
              • Koninklijke Philips N.V. - Overview
              • Koninklijke Philips N.V. - Product / Service
              • Koninklijke Philips N.V. - Key offerings
            • 13.12 Oster
              • Oster - Overview
              • Oster - Product / Service
              • Oster - Key offerings
            • 13.13 Panasonic Holdings Corp.
              • Panasonic Holdings Corp. - Overview
              • Panasonic Holdings Corp. - Product / Service
              • Panasonic Holdings Corp. - Key offerings
            • 13.14 Robert Bosch GmbH
              • Robert Bosch GmbH - Overview
              • Robert Bosch GmbH - Product / Service
              • Robert Bosch GmbH - Key offerings
            • 13.15 Sabichi Homewares Ltd.
              • Sabichi Homewares Ltd. - Overview
              • Sabichi Homewares Ltd. - Product / Service
              • Sabichi Homewares Ltd. - Key offerings
            • 13.16 Siroca Inc.
              • Siroca Inc. - Overview
              • Siroca Inc. - Product / Service
              • Siroca Inc. - Key offerings
            • 13.17 Smeg S.p.a.
              • Smeg S.p.a. - Overview
              • Smeg S.p.a. - Product / Service
              • Smeg S.p.a. - Key offerings
            • 13.18 Spectrum Brands Holdings Inc.
              • Spectrum Brands Holdings Inc. - Overview
              • Spectrum Brands Holdings Inc. - Product / Service
              • Spectrum Brands Holdings Inc. - Key offerings
            • 13.19 Treasure Retail Pvt. Ltd.
              • Treasure Retail Pvt. Ltd. - Overview
              • Treasure Retail Pvt. Ltd. - Product / Service
              • Treasure Retail Pvt. Ltd. - Key offerings
            • 13.20 Universal Corp. Ltd.
              • Universal Corp. Ltd. - Overview
              • Universal Corp. Ltd. - Product / Service
              • Universal Corp. Ltd. - Key offerings
            • 13.21 UP Global Sourcing Holdings Plc
              • UP Global Sourcing Holdings Plc - Overview
              • UP Global Sourcing Holdings Plc - Product / Service
              • UP Global Sourcing Holdings Plc - Key offerings
            • 13.22 Vita Mix Corp.
              • Vita Mix Corp. - Overview
              • Vita Mix Corp. - Product / Service
              • Vita Mix Corp. - Key offerings
            • 13.23 Whirlpool Corp.
              • Whirlpool Corp. - Overview
              • Whirlpool Corp. - Product / Service
              • Whirlpool Corp. - Key offerings
            • 13.24 BOSS APPLIANCES LLP
              • BOSS APPLIANCES LLP - Overview
              • BOSS APPLIANCES LLP - Product / Service
              • BOSS APPLIANCES LLP - Key offerings
            • 13.25 Breville Group Ltd.
              • Breville Group Ltd. - Overview
              • Breville Group Ltd. - Product / Service
              • Breville Group Ltd. - Key offerings
            • 13.26 Conair Corp.
              • Conair Corp. - Overview
              • Conair Corp. - Product / Service
              • Conair Corp. - Key offerings
            • 13.27 DeLonghi Group
              • DeLonghi Group - Overview
              • DeLonghi Group - Product / Service
              • DeLonghi Group - Key offerings
            • 13.28 Electrolux group
              • Electrolux group - Overview
              • Electrolux group - Product / Service
              • Electrolux group - Key offerings
            • 13.29 Hamilton Beach Brands Holding Co.
              • Hamilton Beach Brands Holding Co. - Overview
              • Hamilton Beach Brands Holding Co. - Product / Service
              • Hamilton Beach Brands Holding Co. - Key offerings
            • 13.30 iBELL
              • iBELL - Overview
              • iBELL - Product / Service
              • iBELL - Key offerings
            • 13.31 JVCKENWOOD Corp.
              • JVCKENWOOD Corp. - Overview
              • JVCKENWOOD Corp. - Product / Service
              • JVCKENWOOD Corp. - Key offerings
            • 13.32 Koninklijke Philips N.V.
              • Koninklijke Philips N.V. - Overview
              • Koninklijke Philips N.V. - Product / Service
              • Koninklijke Philips N.V. - Key offerings
            • 13.33 Panasonic Holdings Corp.
              • Panasonic Holdings Corp. - Overview
              • Panasonic Holdings Corp. - Product / Service
              • Panasonic Holdings Corp. - Key offerings
            • 13.34 Robert Bosch GmbH
              • Robert Bosch GmbH - Overview
              • Robert Bosch GmbH - Product / Service
              • Robert Bosch GmbH - Key offerings
            • 13.35 Sabichi Homewares Ltd.
              • Sabichi Homewares Ltd. - Overview
              • Sabichi Homewares Ltd. - Product / Service
              • Sabichi Homewares Ltd. - Key offerings
            • 13.36 Siroca Inc.
              • Siroca Inc. - Overview
              • Siroca Inc. - Product / Service
              • Siroca Inc. - Key offerings
            • 13.37 Smeg S.p.a.
              • Smeg S.p.a. - Overview
              • Smeg S.p.a. - Product / Service
              • Smeg S.p.a. - Key offerings
            • 13.38 Spectrum Brands Holdings Inc.
              • Spectrum Brands Holdings Inc. - Overview
              • Spectrum Brands Holdings Inc. - Product / Service
              • Spectrum Brands Holdings Inc. - Key offerings
            • 13.39 Treasure Retail Pvt. Ltd.
              • Treasure Retail Pvt. Ltd. - Overview
              • Treasure Retail Pvt. Ltd. - Product / Service
              • Treasure Retail Pvt. Ltd. - Key offerings
            • 13.40 Universal Corp. Ltd.
              • Universal Corp. Ltd. - Overview
              • Universal Corp. Ltd. - Product / Service
              • Universal Corp. Ltd. - Key offerings
            • 13.41 UP Global Sourcing Holdings Plc
              • UP Global Sourcing Holdings Plc - Overview
              • UP Global Sourcing Holdings Plc - Product / Service
              • UP Global Sourcing Holdings Plc - Key offerings
            • 13.42 Vita Mix Corp.
              • Vita Mix Corp. - Overview
              • Vita Mix Corp. - Product / Service
              • Vita Mix Corp. - Key offerings
            • 13.43 Whirlpool Corp.
              • Whirlpool Corp. - Overview
              • Whirlpool Corp. - Product / Service
              • Whirlpool Corp. - Key offerings

            14 Appendix

            • 14.1 Scope of the report
              • 14.2 Inclusions and exclusions checklist
                • Inclusions checklist
                • Exclusions checklist
              • 14.3 Currency conversion rates for US$
                • Currency conversion rates for US$
              • 14.4 Research methodology
                • Research methodology
              • 14.5 Data procurement
                • Information sources
              • 14.6 Data validation
                • Data validation
              • 14.7 Validation techniques employed for market sizing
                • Validation techniques employed for market sizing
              • 14.8 Data synthesis
                • Data synthesis
              • 14.9 360 degree market analysis
                • 360 degree market analysis
              • 14.10 List of abbreviations
                • List of abbreviations

              Research Methodology

              Technavio presents a detailed picture of the market by way of study, synthesis, and summation of data from multiple sources. The analysts have presented the various facets of the market with a particular focus on identifying the key industry influencers. The data thus presented is comprehensive, reliable, and the result of extensive research, both primary and secondary.

              INFORMATION SOURCES

              Primary sources

              • Manufacturers and suppliers
              • Channel partners
              • Industry experts
              • Strategic decision makers

              Secondary sources

              • Industry journals and periodicals
              • Government data
              • Financial reports of key industry players
              • Historical data
              • Press releases

              DATA ANALYSIS

              Data Synthesis

              • Collation of data
              • Estimation of key figures
              • Analysis of derived insights

              Data Validation

              • Triangulation with data models
              • Reference against proprietary databases
              • Corroboration with industry experts

              REPORT WRITING

              Qualitative

              • Market drivers
              • Market challenges
              • Market trends
              • Five forces analysis

              Quantitative

              • Market size and forecast
              • Market segmentation
              • Geographical insights
              • Competitive landscape

              Interested in this report?

              Get your sample now to see our research methodology and insights!

              Download Now

              Frequently Asked Questions

              Hand Blender market growth will increase by $ 145.3 mn during 2024-2028 .

              The Hand Blender market is expected to grow at a CAGR of 8.81% during 2024-2028 .

              Hand Blender market is segmented by Type( Corded, Cordless) Distribution Channel( Offline, Online)

              BOSS APPLIANCES LLP, Breville Group Ltd., Conair Corp., DeLonghi Group, Electrolux group, Hamilton Beach Brands Holding Co., iBELL, JVCKENWOOD Corp., Koninklijke Philips N.V., Oster, Panasonic Holdings Corp., Robert Bosch GmbH, Sabichi Homewares Ltd., Siroca Inc., Smeg S.p.a., Spectrum Brands Holdings Inc., Treasure Retail Pvt. Ltd., Universal Corp. Ltd., UP Global Sourcing Holdings Plc, Vita Mix Corp., Whirlpool Corp. are a few of the key vendors in the Hand Blender market.

              APAC will register the highest growth rate of 29% among the other regions. Therefore, the Hand Blender market in APAC is expected to garner significant business opportunities for the vendors during the forecast period.

              US, Canada, Germany, UK, Italy, France, China, India, Japan, Brazil, Egypt, UAE, Oman, Argentina, USA, Rest of World (ROW)

              • Increasing online retail salesThe online market for hand blenders has witnessed significant growth during the past couple of years. The growth of online retail sales channels has contributed to the growth of the global hand blender market. Online channels increase the visibility of different products and brands offered by market vendors. Increased product visibility is the driving factor this market.
              • coupled with the availability of a wide product portfolio is the driving factor this market.
              • has contributed to the growth of online retail channels. The success of online retailing can be attributed to increased customer outreach and inventory management cost-cutting. Though online sales account for a lower volume of total sales globally is the driving factor this market.
              • the online channel is expected to witness faster growth than offline channels during the forecast period. Moreover is the driving factor this market.
              • increasing Internet connectivity is the driving factor this market.
              • growing adoption of mobile devices is the driving factor this market.
              • and rising consumer awareness are expected to drive the growth of the global hand blender market through the e-commerce platform during the forecast period. is the driving factor this market.

              The Hand Blender market vendors should focus on grabbing business opportunities from the Corded segment as it accounted for the largest market share in the base year.