Hard Asset Equipment Online Auction Market Analysis, Size, and Forecast 2025-2029: North America (US, Canada, and Mexico), Europe (France, Germany, Italy, and UK), APAC (China, India, and South Korea), and Rest of World (ROW)

Hard Asset Equipment Online Auction Market Analysis, Size, and Forecast 2025-2029:
North America (US, Canada, and Mexico), Europe (France, Germany, Italy, and UK), APAC (China, India, and South Korea), and Rest of World (ROW)

Published: Jul 2025 228 Pages SKU: IRTNTR72361

Market Overview at a Glance

$5.38 B
Market Opportunity
28.9%
CAGR
23.5
YoY growth 2024-2025(%)

Hard Asset Equipment Online Auction Market Size 2025-2029

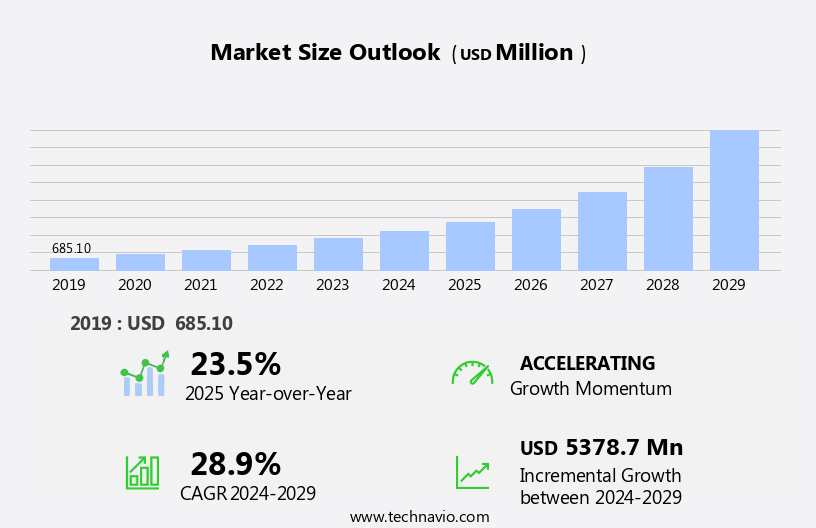
The hard asset equipment online auction market size is forecast to increase by USD 5.38 billion, at a CAGR of 28.9% between 2024 and 2029. The market is experiencing a significant shift in preference towards digital platforms, with online auctions gaining traction over conventional methods.

Major Market Trends & Insights

  • North America dominated the market and accounted for a 55% share in 2023.
  • The market is expected to grow significantly in Europe region as well over the forecast period.
  • Based on the Product Type, the construction segment led the market and was valued at USD 665.20 million of the global revenue in 2023.
  • Based on the Application, the enterprise buyer segment accounted for the largest market revenue share in 2023.

Market Size & Forecast

  • Market Opportunities: USD 2.10 Billion
  • Future Opportunities: USD 5.38 billion
  • CAGR (2024-2029): 28.9%
  • North America: Largest market in 2023

The market continues to evolve, offering innovative solutions for various sectors to buy and sell used equipment efficiently and securely. Auctioneer support systems facilitate the bidding process, ensuring seamless management of compliance and automated bidding systems. Real-time bidding data and auction result reporting enable informed decision-making, while equipment inspection scheduling and condition reports provide transparency. Data security protocols protect sensitive information, and heavy equipment appraisal ensures accurate valuation. Bidder registration processes streamline participation, and online auction platforms offer virtual equipment tours and secure online payment. Auction logistics management, asset tracking systems, and equipment lifecycle management optimize the entire process.

What will be the Size of the Hard Asset Equipment Online Auction Market during the forecast period?

Hard Asset Equipment Online Auction Market Size

Explore in-depth regional segment analysis with market size data - historical 2019-2023 and forecasts 2025-2029 - in the full report.  
Request Free Sample

Industry growth in the market is expected to reach 12% annually, driven by the convenience and cost savings it offers. For instance, a leading construction company increased its sales by 25% by implementing an online bidding interface, payment processing systems, and equipment search filters. Fraud detection systems and risk assessment tools mitigate potential risks, and post-auction settlement ensures smooth transactions. Mobile bidding apps and inventory management software further enhance the user experience. Auction marketing strategies and digital asset catalogs expand reach, while bidder qualification processes maintain market integrity. In summary, the market is a dynamic and evolving space, offering advanced solutions for equipment buying and selling. The transportation segment is the second largest segment of the product type and was valued at USD 445.90 million in 2023.

From auction site optimization and auction data analytics to compliance management and automated bidding systems, this market continues to revolutionize the way businesses manage their assets. This transition is driven by the convenience and accessibility that online auctions offer, enabling participants to bid from anywhere, at any time. A notable trend in this market is the emergence of Artificial Intelligence (AI) in online auctions, streamlining the bidding process and enhancing efficiency. However, the market is not without challenges. The rise of shill bidding, a practice where false bids are placed to manipulate the market price, poses a significant obstacle. This deceptive tactic can distort the true value of hard asset equipment and undermine the integrity of online auctions.

Companies seeking to capitalize on the opportunities presented by the online hard asset equipment auction market must navigate this challenge effectively, ensuring transparency and trust in their bidding processes. Adopting advanced technologies, such as AI and machine learning, can help mitigate the risks associated with shill bidding and maintain a level playing field for all participants. In summary, the market is characterized by its dynamic shift towards digital platforms, the emergence of AI, and the challenges posed by shill bidding. Companies must leverage technology and maintain transparency to capitalize on opportunities and navigate challenges effectively.

How is this Hard Asset Equipment Online Auction Industry segmented?

The hard asset equipment online auction industry research report provides comprehensive data (region-wise segment analysis), with forecasts and estimates in "USD million" for the period 2025-2029, as well as historical data from 2019-2023 for the following segments.

  • Product Type
    • Construction
    • Transportation
    • Agriculture
    • Others
  • Application
    • Enterprise buyer
    • Private buyer
  • Type
    • Timed auctions
    • Live auctions
    • Reserve auctions
    • Silent auctions
    • No-reserve auctions
  • Geography
    • North America
      • US
      • Canada
      • Mexico
    • Europe
      • France
      • Germany
      • Italy
      • UK
    • Middle East and Africa
      • Egypt
      • KSA
      • Oman
      • UAE
    • APAC
      • China
      • India
      • Japan
    • South America
      • Argentina
      • Brazil
    • Rest of World (ROW)

By Product Type Insights

The Construction segment is estimated to witness significant growth during the forecast period. The market is experiencing significant growth due to the increasing demand for construction equipment in response to the rise in infrastructure projects worldwide. With a population that continues to rise, the need for residential and commercial construction projects is expanding rapidly in countries like the UAE, Saudi Arabia, India, and China. This trend is driving the application scope of hard asset equipment online auctions. The market's dynamics are shaped by several key entities. The auctioneer support system ensures smooth and efficient online bidding processes, while compliance management systems maintain regulatory adherence. API integration and bidding software streamline processes, enabling third-party integrations for payment gateways, shipping logistics, and inventory management.

Equipment inspection scheduling and appraisal services provide buyers with accurate information on asset condition, while secure online payment systems streamline transactions. Auction site optimization and data analytics enable better marketing strategies, attracting a larger bidder base. Fraud detection systems ensure transaction security, and risk assessment tools help buyers make informed decisions. Post-auction settlement and inventory management software facilitate seamless asset transfer and tracking. For instance, the implementation of an online bidding platform in a major construction equipment auction reported a 30% increase in sales. Industry growth is expected to reach 15% annually, as more companies adopt these technologies to optimize their equipment acquisition processes.

Hard Asset Equipment Online Auction Market Size

Request Free Sample

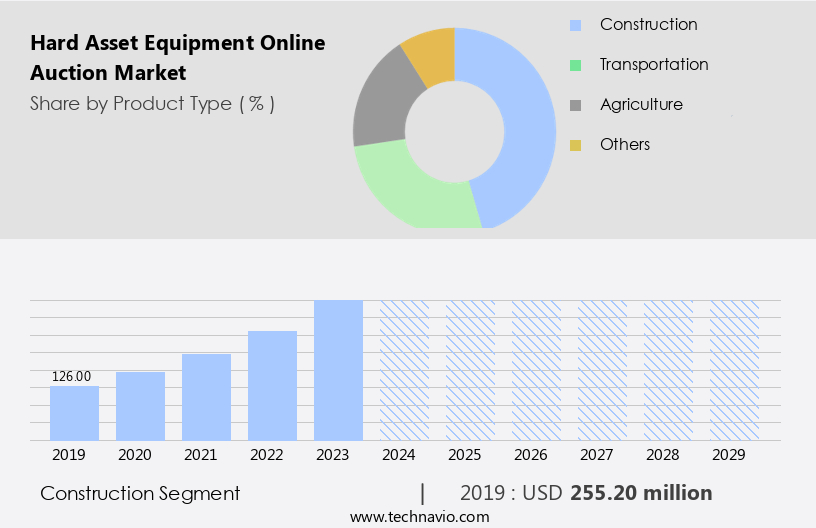
The Construction segment was valued at USD 255.20 billion in 2019 and showed a gradual increase during the forecast period.

The Hard Asset Equipment Online Auction Market is transforming with advanced digital tools that enhance transparency, efficiency, and user trust. Features like auction data visualization and asset condition scoring enable informed bidding, while equipment sales reporting provides valuable insights for sellers. Robust auction platform security and seamless auction calendar management ensure a smooth user experience. Tools like equipment photo management and improved auction site accessibility support broader reach and engagement. A streamlined seller onboarding process, integrated online payment gateway, and strict auction rule enforcement boost platform credibility. Additional features such as auction record archiving, responsive seller support systems, real-time auction monitoring, essential legal compliance features, and regular auction platform maintenance are driving growth and innovation in the market.

Regional Analysis

North America is estimated to contribute 53% to the growth of the global market during the forecast period.Technavio's analysts have elaborately explained the regional trends and drivers that shape the market during the forecast period.

Hard Asset Equipment Online Auction Market Share by Geography

 Request Free Sample

The market in North America is the largest segment globally, driven by significant investments in infrastructure and the presence of major industries such as construction, petroleum refining, and mining. In the US and Canada, online auctions for heavy equipment are common due to the high number of assets requiring periodic replacement. Data suggests that the future opportunities for growth in the North America region estimates to be around USD 5.38 billion. The market is underpinned by advanced technologies, including automated bidding systems, real-time bidding data, and electronic bidding software, ensuring a seamless bidding process. Compliance management systems and fraud detection tools maintain transparency and security. For instance, a leading online auction platform reported a 20% increase in sales in 2021 due to the convenience and efficiency of their system.

Industry growth is expected to continue, with estimates suggesting a 15% annual expansion. Equipment condition reports, asset tracking systems, and equipment lifecycle management facilitate efficient asset depreciation calculations and post-auction settlement. Virtual equipment tours and mobile bidding apps expand reach and accessibility. Live auction streaming and inventory management software optimize the auction process. Additionally, risk assessment tools and bidder qualification processes ensure secure online payments. Email marketing and reserve prices offer additional tools for sellers to attract potential buyers and manage their inventory effectively.

Market Dynamics

Our researchers analyzed the data with 2024 as the base year, along with the key drivers, trends, and challenges. A holistic analysis of drivers will help companies refine their marketing strategies to gain a competitive advantage.

The market is experiencing significant growth, driven by advanced technology and the convenience it offers to buyers and sellers. Heavy equipment online auction platforms provide features such as secure online payment processing for auctions, ensuring seamless transactions. Real-time bidding data analytics enable bidders to make informed decisions, while automated bidding systems streamline the bidding process. Equipment condition reporting and inspection scheduling ensure transparency and accuracy, and mobile bidding apps allow bidders to participate in heavy machinery auctions from anywhere. Online auction platform data security protocols protect sensitive information, and auctioneer support systems offer communication tools for efficient transactions. An asset tracking system facilitates the sales process, and a compliance management system ensures regulatory requirements are met.

Seller onboarding and support systems simplify the process for new sellers, and a digital asset catalog and management system provides easy access to equipment information. Equipment valuation models and price forecasting tools help determine fair market value, and risk assessment and fraud detection measures safeguard against potential issues. Auction logistics management and delivery systems ensure smooth transportation, and auction site accessibility and usability features attract a wider audience. Bidder qualification and registration process management ensure a legitimate buyer pool, and post-auction settlement and payment processing streamline the final stages of the transaction. Live auction streaming and virtual equipment tours offer increased visibility and flexibility, and equipment lifecycle management and maintenance tools ensure optimal performance and longevity.

What are the key market drivers leading to the rise in the adoption of Hard Asset Equipment Online Auction Industry?

  • The significant shift towards online auctioning from conventional methods is the primary market driver, given its convenience, accessibility, and efficiency. The market is experiencing significant growth due to the numerous advantages it offers over traditional on-site auctions. Online auctions provide bidders with unparalleled convenience, enabling them to participate from anywhere at any time, reducing both time and travel costs. Furthermore, online auctions foster transparency, allowing bidders to access comprehensive product information, including images and videos, enabling informed decision-making.
  • According to industry reports, online hard asset equipment auctions are expected to grow by over 15% annually, underscoring their increasing popularity. For instance, a recent online auction event recorded a 25% increase in sales compared to its on-site counterpart, demonstrating the significant potential of this market. Sellers also benefit from this digital transformation as they can connect directly with potential buyers, eliminating the need to transport equipment to auction sites.

What are the market trends shaping the Hard Asset Equipment Online Auction Industry?

  • The emergence of AI-based online auctions represents a significant market trend. This advanced technology is poised to transform traditional auction processes. Artificial intelligence (AI) integration in hard asset equipment online auctions is experiencing significant growth. AI platforms employ machine learning and algorithms to streamline the bidding process for participants. By automating various processes, including internal operations, customer service inquiries, equipment packaging, and delivery, AI technology reduces administrative costs.
  • This collaboration underscores the increasing importance of AI in managing the online bidding process for hard asset equipment. According to recent studies, the adoption of AI in online auctions has grown by 18%, and it is anticipated to increase by 25% in the coming year. Moreover, AI enhances the overall efficiency of online auctions. For instance, in early 2023, Auction Edge, a leading online remarketing technology provider, and Montway LLC, a prominent US third-party logistics brokerage, announced a strategic alliance.

What challenges does the Hard Asset Equipment Online Auction Industry face during its growth?

  • The escalating prevalence of shill bidding in hard asset equipment online auctions poses a significant challenge to the industry's growth. Shill bidding, a deceptive practice involving collusive bidding, artificially inflates auction prices and undermines the transparency and fairness of the bidding process. This unethical behavior not only erodes consumer trust but also hampers the industry's ability to attract legitimate buyers and maintain a level playing field. Consequently, addressing this issue through stricter regulations and enhanced transparency measures is crucial for ensuring the integrity and sustainable growth of the online hard asset equipment auction market. 
  • Hard asset equipment online auctions have gained significant traction in the market, offering a convenient and cost-effective platform for buying and selling used equipment. However, this growth has brought about new challenges, particularly in the form of shill bidding. This illegal practice involves sellers or their associates placing bids to artificially inflate prices in forward auctions or deflate them in reverse auctions. With the ease of registration in auction systems and the ability for multiple users to collude, detecting shill bidding can be a daunting task. According to industry reports, shill bidding is estimated to account for up to 15% of all online auction transactions.

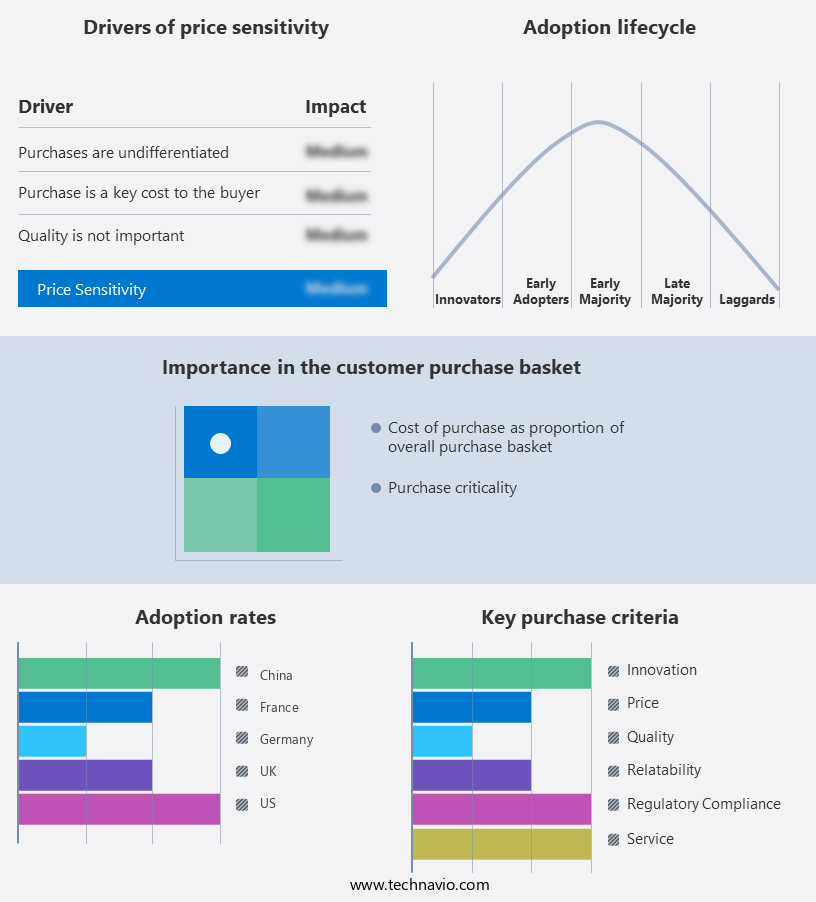
Exclusive Customer Landscape

The hard asset equipment online auction market forecasting report includes the adoption lifecycle of the market, covering from the innovator's stage to the laggard's stage. It focuses on adoption rates in different regions based on penetration. Furthermore, the hard asset equipment online auction market report also includes key purchase criteria and drivers of price sensitivity to help companies evaluate and develop their market growth analysis strategies.

Hard Asset Equipment Online Auction Market Share by Geography

 Customer Landscape

Key Companies & Market Insights

Companies are implementing various strategies, such as strategic alliances, hard asset equipment online auction market forecast, partnerships, mergers and acquisitions, geographical expansion, and product/service launches, to enhance their presence in the industry.

Absolute Auctions and Realty Inc. - The company specializes in online auctions for hard assets, facilitating the sale of vehicles, warehouses, real estate, and other high-value equipment through a digital auction platform.

The industry research and growth report includes detailed analyses of the competitive landscape of the market and information about key companies, including:

  • Absolute Auctions and Realty Inc.
  • Alex Lyon and Son Sales Managers and Auctioneers Inc.
  • AllStar Auctions Inc.
  • Asset Auctions
  • Auction Technology Group PLC
  • Bar None Auction
  • bidadoo Inc.
  • BPI Auctions Ltd.
  • Bruce Schapansky Auctioneers Inc.
  • Euro Auctions UK Ltd.
  • Heritage Global Inc.
  • Hess Auction Group
  • Joey Martin Auctioneers LLC
  • MachineWeb Inc.
  • NetBid Industrie Auktionen AGf
  • Perfection Global LLC
  • Ritchason Auctioneers Inc.
  • Ritchie Bros. Auctioneers Inc.
  • Sullivan Auctioneers LLC
  • TBAuctions B.V.

Qualitative and quantitative analysis of companies has been conducted to help clients understand the wider business environment as well as the strengths and weaknesses of key industry players. Data is qualitatively analyzed to categorize companies as pure play, category-focused, industry-focused, and diversified; it is quantitatively analyzed to categorize companies as dominant, leading, strong, tentative, and weak.

Recent Development and News in Hard Asset Equipment Online Auction Market

  • In January 2024, leading hard asset equipment online auction platform, BidSquare, announced the launch of its advanced AI-driven pricing algorithm, "SmartBid," designed to optimize bidding strategies for buyers and sellers, increasing transaction efficiency and value (BidSquare Press Release).
  • In March 2024, Ritchie Bros. Auctioneers, a major player in the market, formed a strategic partnership with Caterpillar Financial Services Corporation to offer financing solutions to buyers on Ritchie's platform, expanding its value proposition and attracting a broader customer base (Ritchie Bros. Press Release).
  • In May 2024, IronPlanet, another prominent the marketplace, secured a USD50 million investment from Summit Partners, a global growth equity firm, to accelerate its growth plans, including product innovation, geographic expansion, and strategic acquisitions (IronPlanet Press Release).
  • In January 2025, the European Union passed the Digital Services Act, which mandated stricter regulations for online marketplaces, including hard asset equipment auction platforms, ensuring transparency, accountability, and consumer protection (European Commission Press Release). This development is expected to reshape the market, with platforms adapting to comply with the new regulations and potentially increasing costs for sellers and buyers.

Research Analyst Overview

The market for hard asset equipment online auctions continues to evolve, with innovative features and applications emerging across various sectors. Auction platforms now offer advanced solutions for archiving record data, ensuring platform security, and scoring asset conditions. Equipment photos are meticulously managed, and bidder communication tools facilitate seamless interaction. Sales reporting provides valuable insights, while seller onboarding processes and support systems streamline transactions. Equipment price forecasting utilizes auction site analytics, and bidder account management ensures legal compliance. Equipment listing optimization and auction platform scalability attract more bidders, while online auction promotion and equipment description tagging enhance discoverability. Platform maintenance and accessibility ensure smooth operations, and rule enforcement maintains fairness.

The Hard Asset Equipment Online Auction Market is evolving with advanced features that ensure transparency, accuracy, and regulatory compliance. Sophisticated equipment valuation models help determine fair market value, improving buyer confidence and seller returns. Efficient bidding process management and a user-friendly digital asset catalog enhance the overall auction experience. Technologies like remote equipment inspection allow buyers to assess asset conditions without on-site visits. A robust compliance management system ensures that all transactions meet industry regulations. Streamlined bidder qualification processes and secure bidder registration processes help verify participants and maintain auction integrity. 

Bidder feedback mechanisms, online payment gateways, and seller communication channels further enhance the user experience. For instance, a leading auction platform reported a 25% increase in sales due to improved equipment documentation and digital asset verification. Industry growth is expected to reach 15% annually, driven by the continuous unfolding of these market activities and evolving patterns.

Dive into Technavio's robust research methodology, blending expert interviews, extensive data synthesis, and validated models for unparalleled Hard Asset Equipment Online Auction Market insights. See full methodology.

Market Scope

Report Coverage

Details

Page number

228

Base year

2024

Historic period

2019-2023

Forecast period

2025-2029

Growth momentum & CAGR

Accelerate at a CAGR of 28.9%

Market growth 2025-2029

USD 5.38 billion

Market structure

Fragmented

YoY growth 2024-2025(%)

23.5

Key countries

US, Canada, Germany, China, UK, Mexico, France, South Korea, Italy, and India

Competitive landscape

Leading Companies, Market Positioning of Companies, Competitive Strategies, and Industry Risks

Request Free Sample

What are the Key Data Covered in this Hard Asset Equipment Online Auction Market Research and Growth Report?

  • CAGR of the Hard Asset Equipment Online Auction industry during the forecast period
  • Detailed information on factors that will drive the growth and forecasting between 2025 and 2029
  • Precise estimation of the size of the market and its contribution of the industry in focus to the parent market
  • Accurate predictions about upcoming growth and trends and changes in consumer behaviour
  • Growth of the market across North America, Europe, APAC, Middle East and Africa, and South America
  • Thorough analysis of the market's competitive landscape and detailed information about companies
  • Comprehensive analysis of factors that will challenge the hard asset equipment online auction market growth of industry companies

We can help! Our analysts can customize this hard asset equipment online auction market research report to meet your requirements.

Get in touch

1 Executive Summary

  • 1.1 Market overview
    • Executive Summary - Chart on Market Overview
    • Executive Summary - Data Table on Market Overview
    • Executive Summary - Chart on Global Market Characteristics
    • Executive Summary - Chart on Market by Geography
    • Executive Summary - Chart on Market Segmentation by Product Type
    • Executive Summary - Chart on Market Segmentation by Application
    • Executive Summary - Chart on Market Segmentation by Type
    • Executive Summary - Chart on Incremental Growth
    • Executive Summary - Data Table on Incremental Growth
    • Executive Summary - Chart on Company Market Positioning

2 Technavio Analysis

  • 2.1 Analysis of price sensitivity, lifecycle, customer purchase basket, adoption rates, and purchase criteria
    • Analysis of price sensitivity, lifecycle, customer purchase basket, adoption rates, and purchase criteria
  • 2.2 Criticality of inputs and Factors of differentiation
    • Overview on criticality of inputs and factors of differentiation
  • 2.3 Factors of disruption
    • Overview on factors of disruption
  • 2.4 Impact of drivers and challenges
    • Impact of drivers and challenges in 2024 and 2029

3 Market Landscape

  • 3.1 Market ecosystem
    • Parent Market
    • Data Table on - Parent Market
  • 3.2 Market characteristics
    • Market characteristics analysis
  • 3.3 Value chain analysis
    • Value chain analysis

4 Market Sizing

  • 4.1 Market definition
    • Offerings of companies included in the market definition
  • 4.2 Market segment analysis
    • Market segments
  • 4.3 Market size 2024
    • 4.4 Market outlook: Forecast for 2024-2029
      • Chart on Global - Market size and forecast 2024-2029 ($ million)
      • Data Table on Global - Market size and forecast 2024-2029 ($ million)
      • Chart on Global Market: Year-over-year growth 2024-2029 (%)
      • Data Table on Global Market: Year-over-year growth 2024-2029 (%)

    5 Historic Market Size

    • 5.1 Global Hard Asset Equipment Online Auction Market 2019 - 2023
      • Historic Market Size - Data Table on Global Hard Asset Equipment Online Auction Market 2019 - 2023 ($ million)
    • 5.2 Product Type segment analysis 2019 - 2023
      • Historic Market Size - Product Type Segment 2019 - 2023 ($ million)
    • 5.3 Application segment analysis 2019 - 2023
      • Historic Market Size - Application Segment 2019 - 2023 ($ million)
    • 5.4 Type segment analysis 2019 - 2023
      • Historic Market Size - Type Segment 2019 - 2023 ($ million)
    • 5.5 Geography segment analysis 2019 - 2023
      • Historic Market Size - Geography Segment 2019 - 2023 ($ million)
    • 5.6 Country segment analysis 2019 - 2023
      • Historic Market Size - Country Segment 2019 - 2023 ($ million)

    6 Qualitative Analysis

    • 6.1 The impact of AI in the global hard asset equipment online auction market

      7 Five Forces Analysis

      • 7.1 Five forces summary
        • Five forces analysis - Comparison between 2024 and 2029
      • 7.2 Bargaining power of buyers
        • Bargaining power of buyers - Impact of key factors 2024 and 2029
      • 7.3 Bargaining power of suppliers
        • Bargaining power of suppliers - Impact of key factors in 2024 and 2029
      • 7.4 Threat of new entrants
        • Threat of new entrants - Impact of key factors in 2024 and 2029
      • 7.5 Threat of substitutes
        • Threat of substitutes - Impact of key factors in 2024 and 2029
      • 7.6 Threat of rivalry
        • Threat of rivalry - Impact of key factors in 2024 and 2029
      • 7.7 Market condition
        • Chart on Market condition - Five forces 2024 and 2029

      8 Market Segmentation by Product Type

      • 8.1 Market segments
        • Chart on Product Type - Market share (2024-2029) (%)
        • Data Table on Product Type - Market share (2024-2029) (%)
      • 8.2 Comparison by Product Type
        • Chart on Comparison by Product Type
        • Data Table on Comparison by Product Type
      • 8.3 Construction - Market size and forecast (2024-2029)
        • Chart on Construction - Market size and forecast (2024-2029) ($ million)
        • Data Table on Construction - Market size and forecast (2024-2029) ($ million)
        • Chart on Construction - Year-over-year growth (2024-2029) (%)
        • Data Table on Construction - Year-over-year growth (2024-2029) (%)
      • 8.4 Transportation - Market size and forecast (2024-2029)
        • Chart on Transportation - Market size and forecast (2024-2029) ($ million)
        • Data Table on Transportation - Market size and forecast (2024-2029) ($ million)
        • Chart on Transportation - Year-over-year growth (2024-2029) (%)
        • Data Table on Transportation - Year-over-year growth (2024-2029) (%)
      • 8.5 Agriculture - Market size and forecast (2024-2029)
        • Chart on Agriculture - Market size and forecast (2024-2029) ($ million)
        • Data Table on Agriculture - Market size and forecast (2024-2029) ($ million)
        • Chart on Agriculture - Year-over-year growth (2024-2029) (%)
        • Data Table on Agriculture - Year-over-year growth (2024-2029) (%)
      • 8.6 Others - Market size and forecast (2024-2029)
        • Chart on Others - Market size and forecast (2024-2029) ($ million)
        • Data Table on Others - Market size and forecast (2024-2029) ($ million)
        • Chart on Others - Year-over-year growth (2024-2029) (%)
        • Data Table on Others - Year-over-year growth (2024-2029) (%)
      • 8.7 Market opportunity by Product Type
        • Market opportunity by Product Type ($ million)
        • Data Table on Market opportunity by Product Type ($ million)

      9 Market Segmentation by Application

      • 9.1 Market segments
        • Chart on Application - Market share (2024-2029) (%)
        • Data Table on Application - Market share (2024-2029) (%)
      • 9.2 Comparison by Application
        • Chart on Comparison by Application
        • Data Table on Comparison by Application
      • 9.3 Enterprise buyer - Market size and forecast (2024-2029)
        • Chart on Enterprise buyer - Market size and forecast (2024-2029) ($ million)
        • Data Table on Enterprise buyer - Market size and forecast (2024-2029) ($ million)
        • Chart on Enterprise buyer - Year-over-year growth (2024-2029) (%)
        • Data Table on Enterprise buyer - Year-over-year growth (2024-2029) (%)
      • 9.4 Private buyer - Market size and forecast (2024-2029)
        • Chart on Private buyer - Market size and forecast (2024-2029) ($ million)
        • Data Table on Private buyer - Market size and forecast (2024-2029) ($ million)
        • Chart on Private buyer - Year-over-year growth (2024-2029) (%)
        • Data Table on Private buyer - Year-over-year growth (2024-2029) (%)
      • 9.5 Market opportunity by Application
        • Market opportunity by Application ($ million)
        • Data Table on Market opportunity by Application ($ million)

      10 Market Segmentation by Type

      • 10.1 Market segments
        • Chart on Type - Market share (2024-2029) (%)
        • Data Table on Type - Market share (2024-2029) (%)
      • 10.2 Comparison by Type
        • Chart on Comparison by Type
        • Data Table on Comparison by Type
      • 10.3 Timed auctions - Market size and forecast (2024-2029)
        • Chart on Timed auctions - Market size and forecast (2024-2029) ($ million)
        • Data Table on Timed auctions - Market size and forecast (2024-2029) ($ million)
        • Chart on Timed auctions - Year-over-year growth (2024-2029) (%)
        • Data Table on Timed auctions - Year-over-year growth (2024-2029) (%)
      • 10.4 Live auctions - Market size and forecast (2024-2029)
        • Chart on Live auctions - Market size and forecast (2024-2029) ($ million)
        • Data Table on Live auctions - Market size and forecast (2024-2029) ($ million)
        • Chart on Live auctions - Year-over-year growth (2024-2029) (%)
        • Data Table on Live auctions - Year-over-year growth (2024-2029) (%)
      • 10.5 Reserve auctions - Market size and forecast (2024-2029)
        • Chart on Reserve auctions - Market size and forecast (2024-2029) ($ million)
        • Data Table on Reserve auctions - Market size and forecast (2024-2029) ($ million)
        • Chart on Reserve auctions - Year-over-year growth (2024-2029) (%)
        • Data Table on Reserve auctions - Year-over-year growth (2024-2029) (%)
      • 10.6 Silent auctions - Market size and forecast (2024-2029)
        • Chart on Silent auctions - Market size and forecast (2024-2029) ($ million)
        • Data Table on Silent auctions - Market size and forecast (2024-2029) ($ million)
        • Chart on Silent auctions - Year-over-year growth (2024-2029) (%)
        • Data Table on Silent auctions - Year-over-year growth (2024-2029) (%)
      • 10.7 No-reserve auctions - Market size and forecast (2024-2029)
        • Chart on No-reserve auctions - Market size and forecast (2024-2029) ($ million)
        • Data Table on No-reserve auctions - Market size and forecast (2024-2029) ($ million)
        • Chart on No-reserve auctions - Year-over-year growth (2024-2029) (%)
        • Data Table on No-reserve auctions - Year-over-year growth (2024-2029) (%)
      • 10.8 Market opportunity by Type
        • Market opportunity by Type ($ million)
        • Data Table on Market opportunity by Type ($ million)

      11 Customer Landscape

      • 11.1 Customer landscape overview
        • Analysis of price sensitivity, lifecycle, customer purchase basket, adoption rates, and purchase criteria

      12 Geographic Landscape

      • 12.1 Geographic segmentation
        • Chart on Market share by geography 2024-2029 (%)
        • Data Table on Market share by geography 2024-2029 (%)
      • 12.2 Geographic comparison
        • Chart on Geographic comparison
        • Data Table on Geographic comparison
      • 12.3 North America - Market size and forecast 2024-2029
        • Chart on North America - Market size and forecast 2024-2029 ($ million)
        • Data Table on North America - Market size and forecast 2024-2029 ($ million)
        • Chart on North America - Year-over-year growth 2024-2029 (%)
        • Data Table on North America - Year-over-year growth 2024-2029 (%)
      • 12.4 Europe - Market size and forecast 2024-2029
        • Chart on Europe - Market size and forecast 2024-2029 ($ million)
        • Data Table on Europe - Market size and forecast 2024-2029 ($ million)
        • Chart on Europe - Year-over-year growth 2024-2029 (%)
        • Data Table on Europe - Year-over-year growth 2024-2029 (%)
      • 12.5 APAC - Market size and forecast 2024-2029
        • Chart on APAC - Market size and forecast 2024-2029 ($ million)
        • Data Table on APAC - Market size and forecast 2024-2029 ($ million)
        • Chart on APAC - Year-over-year growth 2024-2029 (%)
        • Data Table on APAC - Year-over-year growth 2024-2029 (%)
      • 12.6 Middle East and Africa - Market size and forecast 2024-2029
        • Chart on Middle East and Africa - Market size and forecast 2024-2029 ($ million)
        • Data Table on Middle East and Africa - Market size and forecast 2024-2029 ($ million)
        • Chart on Middle East and Africa - Year-over-year growth 2024-2029 (%)
        • Data Table on Middle East and Africa - Year-over-year growth 2024-2029 (%)
      • 12.7 South America - Market size and forecast 2024-2029
        • Chart on South America - Market size and forecast 2024-2029 ($ million)
        • Data Table on South America - Market size and forecast 2024-2029 ($ million)
        • Chart on South America - Year-over-year growth 2024-2029 (%)
        • Data Table on South America - Year-over-year growth 2024-2029 (%)
      • 12.8 US - Market size and forecast 2024-2029
        • Chart on US - Market size and forecast 2024-2029 ($ million)
        • Data Table on US - Market size and forecast 2024-2029 ($ million)
        • Chart on US - Year-over-year growth 2024-2029 (%)
        • Data Table on US - Year-over-year growth 2024-2029 (%)
      • 12.9 Canada - Market size and forecast 2024-2029
        • Chart on Canada - Market size and forecast 2024-2029 ($ million)
        • Data Table on Canada - Market size and forecast 2024-2029 ($ million)
        • Chart on Canada - Year-over-year growth 2024-2029 (%)
        • Data Table on Canada - Year-over-year growth 2024-2029 (%)
      • 12.10 Germany - Market size and forecast 2024-2029
        • Chart on Germany - Market size and forecast 2024-2029 ($ million)
        • Data Table on Germany - Market size and forecast 2024-2029 ($ million)
        • Chart on Germany - Year-over-year growth 2024-2029 (%)
        • Data Table on Germany - Year-over-year growth 2024-2029 (%)
      • 12.11 China - Market size and forecast 2024-2029
        • Chart on China - Market size and forecast 2024-2029 ($ million)
        • Data Table on China - Market size and forecast 2024-2029 ($ million)
        • Chart on China - Year-over-year growth 2024-2029 (%)
        • Data Table on China - Year-over-year growth 2024-2029 (%)
      • 12.12 UK - Market size and forecast 2024-2029
        • Chart on UK - Market size and forecast 2024-2029 ($ million)
        • Data Table on UK - Market size and forecast 2024-2029 ($ million)
        • Chart on UK - Year-over-year growth 2024-2029 (%)
        • Data Table on UK - Year-over-year growth 2024-2029 (%)
      • 12.13 Mexico - Market size and forecast 2024-2029
        • Chart on Mexico - Market size and forecast 2024-2029 ($ million)
        • Data Table on Mexico - Market size and forecast 2024-2029 ($ million)
        • Chart on Mexico - Year-over-year growth 2024-2029 (%)
        • Data Table on Mexico - Year-over-year growth 2024-2029 (%)
      • 12.14 France - Market size and forecast 2024-2029
        • Chart on France - Market size and forecast 2024-2029 ($ million)
        • Data Table on France - Market size and forecast 2024-2029 ($ million)
        • Chart on France - Year-over-year growth 2024-2029 (%)
        • Data Table on France - Year-over-year growth 2024-2029 (%)
      • 12.15 South Korea - Market size and forecast 2024-2029
        • Chart on South Korea - Market size and forecast 2024-2029 ($ million)
        • Data Table on South Korea - Market size and forecast 2024-2029 ($ million)
        • Chart on South Korea - Year-over-year growth 2024-2029 (%)
        • Data Table on South Korea - Year-over-year growth 2024-2029 (%)
      • 12.16 Italy - Market size and forecast 2024-2029
        • Chart on Italy - Market size and forecast 2024-2029 ($ million)
        • Data Table on Italy - Market size and forecast 2024-2029 ($ million)
        • Chart on Italy - Year-over-year growth 2024-2029 (%)
        • Data Table on Italy - Year-over-year growth 2024-2029 (%)
      • 12.17 India - Market size and forecast 2024-2029
        • Chart on India - Market size and forecast 2024-2029 ($ million)
        • Data Table on India - Market size and forecast 2024-2029 ($ million)
        • Chart on India - Year-over-year growth 2024-2029 (%)
        • Data Table on India - Year-over-year growth 2024-2029 (%)
      • 12.18 Market opportunity by geography
        • Market opportunity by geography ($ million)
        • Data Tables on Market opportunity by geography ($ million)
      • 12.19 Japan - Market size and forecast (2024-2029)
        • Chart on Japan - Market size and forecast (2024-2029) ($ million)
        • Data Table on Japan - Market size and forecast (2024-2029) ($ million)
        • Chart on Japan - Year-over-year growth (2024-2029) (%)
        • Data Table on Japan - Year-over-year growth (2024-2029) (%)
      • 12.20 Brazil - Market size and forecast (2024-2029)
        • Chart on Brazil - Market size and forecast (2024-2029) ($ million)
        • Data Table on Brazil - Market size and forecast (2024-2029) ($ million)
        • Chart on Brazil - Year-over-year growth (2024-2029) (%)
        • Data Table on Brazil - Year-over-year growth (2024-2029) (%)
      • 12.21 Egypt - Market size and forecast (2024-2029)
        • Chart on Egypt - Market size and forecast (2024-2029) ($ million)
        • Data Table on Egypt - Market size and forecast (2024-2029) ($ million)
        • Chart on Egypt - Year-over-year growth (2024-2029) (%)
        • Data Table on Egypt - Year-over-year growth (2024-2029) (%)
      • 12.22 UAE - Market size and forecast (2024-2029)
        • Chart on UAE - Market size and forecast (2024-2029) ($ million)
        • Data Table on UAE - Market size and forecast (2024-2029) ($ million)
        • Chart on UAE - Year-over-year growth (2024-2029) (%)
        • Data Table on UAE - Year-over-year growth (2024-2029) (%)
      • 12.23 Oman - Market size and forecast (2024-2029)
        • Chart on Oman - Market size and forecast (2024-2029) ($ million)
        • Data Table on Oman - Market size and forecast (2024-2029) ($ million)
        • Chart on Oman - Year-over-year growth (2024-2029) (%)
        • Data Table on Oman - Year-over-year growth (2024-2029) (%)
      • 12.24 Argentina - Market size and forecast (2024-2029)
        • Chart on Argentina - Market size and forecast (2024-2029) ($ million)
        • Data Table on Argentina - Market size and forecast (2024-2029) ($ million)
        • Chart on Argentina - Year-over-year growth (2024-2029) (%)
        • Data Table on Argentina - Year-over-year growth (2024-2029) (%)
      • 12.25 KSA - Market size and forecast (2024-2029)
        • Chart on KSA - Market size and forecast (2024-2029) ($ million)
        • Data Table on KSA - Market size and forecast (2024-2029) ($ million)
        • Chart on KSA - Year-over-year growth (2024-2029) (%)
        • Data Table on KSA - Year-over-year growth (2024-2029) (%)
      • 12.26 Rest of World (ROW) - Market size and forecast (2024-2029)
        • Chart on Rest of World (ROW) - Market size and forecast (2024-2029) ($ million)
        • Data Table on Rest of World (ROW) - Market size and forecast (2024-2029) ($ million)
        • Chart on Rest of World (ROW) - Year-over-year growth (2024-2029) (%)
        • Data Table on Rest of World (ROW) - Year-over-year growth (2024-2029) (%)

      13 Drivers, Challenges, and Opportunity/Restraints

      • 13.1 Market drivers
        • 13.2 Market challenges
          • 13.3 Impact of drivers and challenges
            • Impact of drivers and challenges in 2024 and 2029
          • 13.4 Market opportunities/restraints

            14 Competitive Landscape

            • 14.1 Overview
              • 14.2 Competitive Landscape
                • Overview on criticality of inputs and factors of differentiation
              • 14.3 Landscape disruption
                • Overview on factors of disruption
              • 14.4 Industry risks
                • Impact of key risks on business

              15 Competitive Analysis

              • 15.1 Companies profiled
                • Companies covered
              • 15.2 Company ranking index
                • Company ranking index
              • 15.3 Market positioning of companies
                • Matrix on companies position and classification
              • 15.4 Absolute Auctions and Realty Inc.
                • Absolute Auctions and Realty Inc. - Overview
                • Absolute Auctions and Realty Inc. - Product / Service
                • Absolute Auctions and Realty Inc. - Key offerings
                • SWOT
              • 15.5 Alex Lyon and Son Sales Managers and Auctioneers Inc.
                • Alex Lyon and Son Sales Managers and Auctioneers Inc. - Overview
                • Alex Lyon and Son Sales Managers and Auctioneers Inc. - Product / Service
                • Alex Lyon and Son Sales Managers and Auctioneers Inc. - Key offerings
                • SWOT
              • 15.6 AllStar Auctions Inc.
                • AllStar Auctions Inc. - Overview
                • AllStar Auctions Inc. - Product / Service
                • AllStar Auctions Inc. - Key offerings
                • SWOT
              • 15.7 Auction Technology Group PLC
                • Auction Technology Group PLC - Overview
                • Auction Technology Group PLC - Product / Service
                • Auction Technology Group PLC - Key offerings
                • SWOT
              • 15.8 Bar None Auction
                • Bar None Auction - Overview
                • Bar None Auction - Product / Service
                • Bar None Auction - Key offerings
                • SWOT
              • 15.9 bidadoo Inc.
                • bidadoo Inc. - Overview
                • bidadoo Inc. - Product / Service
                • bidadoo Inc. - Key offerings
                • SWOT
              • 15.10 BPI Auctions Ltd.
                • BPI Auctions Ltd. - Overview
                • BPI Auctions Ltd. - Product / Service
                • BPI Auctions Ltd. - Key offerings
                • SWOT
              • 15.11 Bruce Schapansky Auctioneers Inc.
                • Bruce Schapansky Auctioneers Inc. - Overview
                • Bruce Schapansky Auctioneers Inc. - Product / Service
                • Bruce Schapansky Auctioneers Inc. - Key offerings
                • SWOT
              • 15.12 Euro Auctions UK Ltd.
                • Euro Auctions UK Ltd. - Overview
                • Euro Auctions UK Ltd. - Product / Service
                • Euro Auctions UK Ltd. - Key offerings
                • SWOT
              • 15.13 Hess Auction Group
                • Hess Auction Group - Overview
                • Hess Auction Group - Product / Service
                • Hess Auction Group - Key offerings
                • SWOT
              • 15.14 Joey Martin Auctioneers LLC
                • Joey Martin Auctioneers LLC - Overview
                • Joey Martin Auctioneers LLC - Product / Service
                • Joey Martin Auctioneers LLC - Key offerings
                • SWOT
              • 15.15 NetBid Industrie Auktionen AGf
                • NetBid Industrie Auktionen AGf - Overview
                • NetBid Industrie Auktionen AGf - Product / Service
                • NetBid Industrie Auktionen AGf - Key offerings
                • SWOT
              • 15.16 Perfection Global LLC
                • Perfection Global LLC - Overview
                • Perfection Global LLC - Product / Service
                • Perfection Global LLC - Key offerings
                • SWOT
              • 15.17 Ritchason Auctioneers Inc.
                • Ritchason Auctioneers Inc. - Overview
                • Ritchason Auctioneers Inc. - Product / Service
                • Ritchason Auctioneers Inc. - Key offerings
                • SWOT
              • 15.18 Ritchie Bros. Auctioneers Inc.
                • Ritchie Bros. Auctioneers Inc. - Overview
                • Ritchie Bros. Auctioneers Inc. - Product / Service
                • Ritchie Bros. Auctioneers Inc. - Key offerings
                • SWOT

              16 Appendix

              • 16.1 Scope of the report
                • 16.2 Inclusions and exclusions checklist
                  • Inclusions checklist
                  • Exclusions checklist
                • 16.3 Currency conversion rates for US$
                  • Currency conversion rates for US$
                • 16.4 Research methodology
                  • Research methodology
                • 16.5 Data procurement
                  • Information sources
                • 16.6 Data validation
                  • Data validation
                • 16.7 Validation techniques employed for market sizing
                  • Validation techniques employed for market sizing
                • 16.8 Data synthesis
                  • Data synthesis
                • 16.9 360 degree market analysis
                  • 360 degree market analysis
                • 16.10 List of abbreviations
                  • List of abbreviations

                Research Methodology

                Technavio presents a detailed picture of the market by way of study, synthesis, and summation of data from multiple sources. The analysts have presented the various facets of the market with a particular focus on identifying the key industry influencers. The data thus presented is comprehensive, reliable, and the result of extensive research, both primary and secondary.

                INFORMATION SOURCES

                Primary sources

                • Manufacturers and suppliers
                • Channel partners
                • Industry experts
                • Strategic decision makers

                Secondary sources

                • Industry journals and periodicals
                • Government data
                • Financial reports of key industry players
                • Historical data
                • Press releases

                DATA ANALYSIS

                Data Synthesis

                • Collation of data
                • Estimation of key figures
                • Analysis of derived insights

                Data Validation

                • Triangulation with data models
                • Reference against proprietary databases
                • Corroboration with industry experts

                REPORT WRITING

                Qualitative

                • Market drivers
                • Market challenges
                • Market trends
                • Five forces analysis

                Quantitative

                • Market size and forecast
                • Market segmentation
                • Geographical insights
                • Competitive landscape

                Interested in this report?

                Get your sample now to see our research methodology and insights!

                Download Now

                Frequently Asked Questions

                Hard Asset Equipment Online Auction market growth will increase by $ 5378.7 mn during 2025-2029 .

                The Hard Asset Equipment Online Auction market is expected to grow at a CAGR of 28.9% during 2025-2029 .

                Hard Asset Equipment Online Auction market is segmented by Product Type( Construction, Transportation, Agriculture, Others) Application( Enterprise buyer, Private buyer, Agriculture, Others, South America) Type( Timed auctions, Live auctions, Reserve auctions, Silent auctions, No-reserve auctions)

                Absolute Auctions and Realty Inc., Alex Lyon and Son Sales Managers and Auctioneers Inc., AllStar Auctions Inc., Asset Auctions, Auction Technology Group PLC, Bar None Auction, bidadoo Inc., BPI Auctions Ltd., Bruce Schapansky Auctioneers Inc., Euro Auctions UK Ltd., Heritage Global Inc., Hess Auction Group, Joey Martin Auctioneers LLC, MachineWeb Inc., NetBid Industrie Auktionen AGf, Perfection Global LLC, Ritchason Auctioneers Inc., Ritchie Bros. Auctioneers Inc., Sullivan Auctioneers LLC, TBAuctions B.V. are a few of the key vendors in the Hard Asset Equipment Online Auction market.

                North America will register the highest growth rate of 53% among the other regions. Therefore, the Hard Asset Equipment Online Auction market in North America is expected to garner significant business opportunities for the vendors during the forecast period.

                US, Canada, Germany, UK, Italy, France, China, India, Japan, Brazil, Egypt, UAE, Oman, Argentina, KSA, UAE, Brazil, Rest of World (ROW), Mexico, Italy

                • Shift in preference toward online auctioning from conventional auctioningThere is an ongoing shift toward hard asset equipment online auctioning from conventional on-site auctioning is the driving factor this market.
                • owing to its benefits. Online auction is convenient to bidders in terms of time is the driving factor this market.
                • place is the driving factor this market.
                • and cost. Bidders can easily log in to auctioning websites and participate in the auction is the driving factor this market.
                • which eliminates the need for physical presence. Hard asset equipment online auctioning helps connect sellers directly with buyers is the driving factor this market.
                • eliminating the need to move equipment to an auction site. Online auction provides transparency to bidders is the driving factor this market.
                • which helps in improving trust among users. Bidders can surf through the auctioning website and can gather the details of products. Also is the driving factor this market.
                • they have the opportunity to research prices and quality of products as well as compare prices through several images and videos that are available on online auction websites. To give buyers more precise information about the equipment is the driving factor this market.
                • online auctions can offer expert inspection reports that describe the features and condition of the equipment. In order to give prospective bidders time to review equipment reports is the driving factor this market.
                • some online auction websites also provide a preview of the equipment that will be auctioned off weeks prior to the actual auction date. These websites also provide buyers with helpful asset information is the driving factor this market.
                • such as depreciation curves and price indicators is the driving factor this market.
                • which aid in the selection of equipment that best meets their needs. In an online auction is the driving factor this market.
                • bidders have the chance to haggle with auctioneers or sellers during the auction. This eliminates the profits made by agents is the driving factor this market.
                • brokers is the driving factor this market.
                • or middlemen is the driving factor this market.
                • eventually making the process easy is the driving factor this market.
                • which will drive the demand for online auctioning. Online auctions aid in reducing transaction costs for both buyers and sellers. This helps in selling hard assets is the driving factor this market.
                • such as construction is the driving factor this market.
                • agricultural is the driving factor this market.
                • and transportation equipment is the driving factor this market.
                • through online auctions. These auctions aid in reducing the complexity of the overall auctioning process. Also is the driving factor this market.
                • online auctions make it possible to conduct multiunit auctions is the driving factor this market.
                • where bids from a large number of bidders are considered. The bids are then sorted out and dynamically allocated among the bidders according to predefined priority rules. For instance is the driving factor this market.
                • in January 2023 is the driving factor this market.
                • the online-only auction platform AuctionTime.com is the driving factor this market.
                • a service of Sandhills Global is the driving factor this market.
                • announced that its final sales of the month generated over $114 million in gross auction proceeds for sellers of construction equipment is the driving factor this market.
                • farm machinery is the driving factor this market.
                • trucks is the driving factor this market.
                • and trailers. The series of online auctions attracted nearly 20 is the driving factor this market.
                • 000 bidders from all 50 U.S. states and 44 countries is the driving factor this market.
                • demonstrating the extensive reach and significant transaction capacity of digital platforms in the hard asset equipment market. This event highlights the industry move toward online-exclusive auctions is the driving factor this market.
                • which provide global access and facilitate high-value sales directly between buyers and sellers is the driving factor this market.
                • thereby reducing the logistical complexities and costs associated with traditional on-site events. Thus is the driving factor this market.
                • in turn is the driving factor this market.
                • will help fuel the growth of the global hard asset equipment online auction market during the forecast period. is the driving factor this market.

                The Hard Asset Equipment Online Auction market vendors should focus on grabbing business opportunities from the Construction segment as it accounted for the largest market share in the base year.