
Healthcare Third-party Logistics Market Analysis, Size, and Forecast 2026-2030: North America (US, Canada, and Mexico), Europe (Germany, UK, and France), APAC (China, Japan, and India), Middle East and Africa (Saudi Arabia, UAE, and South Africa), South America (Brazil, Argentina, and Chile), and Rest of World (ROW)

Healthcare Third-party Logistics Market Analysis, Size, and Forecast 2026-2030:
North America (US, Canada, and Mexico), Europe (Germany, UK, and France), APAC (China, Japan, and India), Middle East and Africa (Saudi Arabia, UAE, and South Africa), South America (Brazil, Argentina, and Chile), and Rest of World (ROW)

Published: Oct 2026 313 Pages SKU: IRTNTR80392

Market Overview at a Glance

$111.89 B
Market Opportunity
9.9%
CAGR 2025 - 2030
42.3%
North America Growth
$96.80 B
Unit packaging segment 2024

Healthcare Third-Party Logistics Market Size 2026-2030

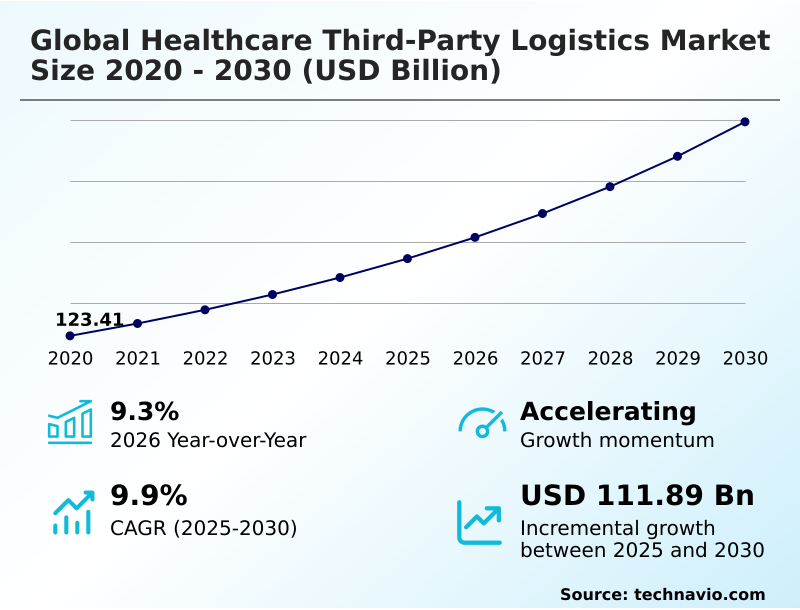
The healthcare third-party logistics market size is valued to increase by USD 111.89 billion, at a CAGR of 9.9% from 2025 to 2030. Rising demand for temperature-controlled pharmaceutical logistics will drive the healthcare third-party logistics market.

Major Market Trends & Insights

  • North America dominated the market and accounted for a 42.3% growth during the forecast period.
  • By Type - Unit packaging segment was valued at USD 96.80 billion in 2024
  • By Service Type - Warehousing and distribution segment accounted for the largest market revenue share in 2024

Market Size & Forecast

  • Market Opportunities: USD 175.10 billion
  • Market Future Opportunities: USD 111.89 billion
  • CAGR from 2025 to 2030 : 9.9%

Market Summary

  • The Healthcare Third-party Logistics market is experiencing structural expansion driven by increasingly complex pharmaceutical supply chains and stringent regulatory oversight. Specialized logistics networks have become essential for managing the distribution of highly sensitive therapeutics and diagnostic materials.
  • A primary driver of this market is the rising demand for temperature-controlled pharmaceutical logistics, which ensures the stability and efficacy of advanced therapies during transit. Conversely, high cold-chain compliance complexity presents a significant challenge, requiring continuous investments in validated infrastructure and monitoring technologies to prevent costly shipment deviations.
  • In a supply chain optimization scenario, integrating automated storage systems and predictive route planning enables facilities to synchronize inbound material flows with final-mile delivery schedules. Organizations implementing such digitally connected distribution networks report a 22% reduction in handling errors compared to traditional manual operations.
  • The Healthcare Third-party Logistics landscape continues to evolve as manufacturers outsource distribution activities to secure resilient network routing and specialized courier execution. Advanced tracking frameworks and dedicated healthcare cross-docking facilities are increasingly standardized to meet the rigorous handling requirements of modern patient care.

What will be the Size of the Healthcare Third-Party Logistics Market during the forecast period?
Get Key Insights on Market Forecast (PDF) Get Free Sample

How is the Healthcare Third-Party Logistics Market Segmented?

The healthcare third-party logistics industry research report provides comprehensive data (region-wise segment analysis), with forecasts and estimates in "USD million" for the period 2026-2030, as well as historical data from 2020-2024 for the following segments.

  • Type
    • Unit packaging
    • Bulk packaging
    • Specialized packaging
  • Service type
    • Warehousing and distribution
    • Transportation management
    • Packaging and labelling
    • Inventory management
    • Value-added services
  • End-user
    • Pharma and bio companies
    • Medical device companies
    • Healthcare facilities
    • Others
  • Geography
    • North America
      • US
      • Canada
      • Mexico
    • Europe
      • Germany
      • UK
      • France
      • Italy
      • Spain
      • The Netherlands
    • APAC
      • China
      • Japan
      • India
      • South Korea
      • Australia
      • Indonesia
    • Middle East and Africa
      • Saudi Arabia
      • UAE
      • South Africa
      • Israel
      • Turkey
    • South America
      • Brazil
      • Argentina
      • Chile

By Type Insights

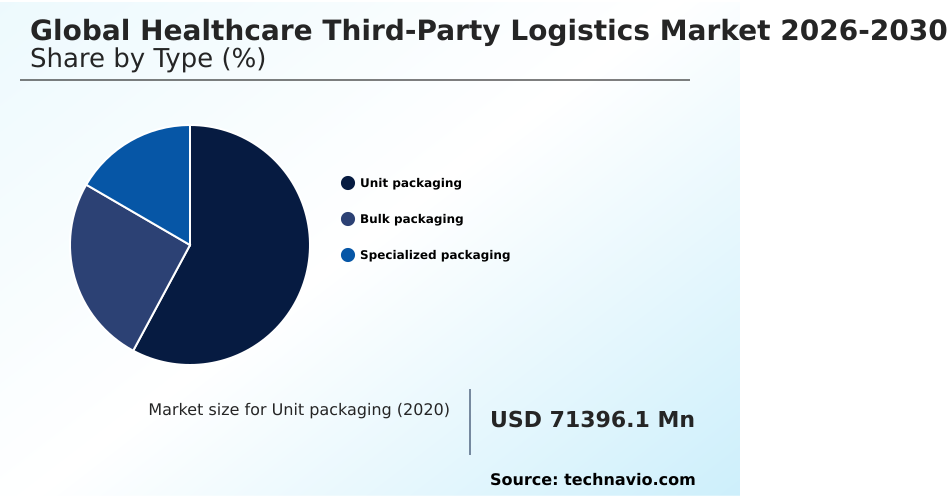
The unit packaging segment is estimated to witness significant growth during the forecast period.

The unit packaging segment within the Healthcare Third-party Logistics ecosystem serves a critical operational function by ensuring individual dose protection and precision medicine distribution accuracy.

Evolving supply chains require strict product handling, driving the integration of insulated shipper systems to maintain stability during transit. Organizations utilize continuous temperature monitoring and cold chain validation to prevent product degradation across decentralized fulfillment hubs and ambient storage nodes.

This granular containment strategy supports biologic therapy handling and clinical trial materials coordination, ensuring therapeutic efficacy.

Operations integrating these unit containment methods alongside autonomous mobile robots and cryogenic storage facilities have realized a 15% improvement in distribution accuracy, demonstrating a clear operational impact.

Advanced packaging solutions remain essential for mitigating risks and maintaining compliance as product portfolios grow increasingly sensitive.
Get Free Sample

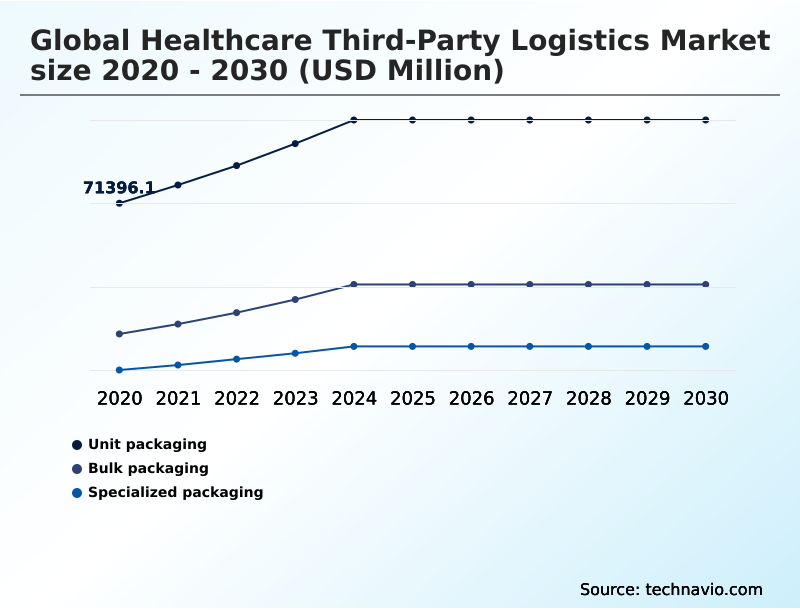
The Unit packaging segment was valued at USD 96.80 billion in 2024 and showed a gradual increase during the forecast period.
Get Free Sample

Regional Analysis

North America is estimated to contribute 42.3% to the growth of the global market during the forecast period.Technavio’s analysts have elaborately explained the regional trends and drivers that shape the market during the forecast period.
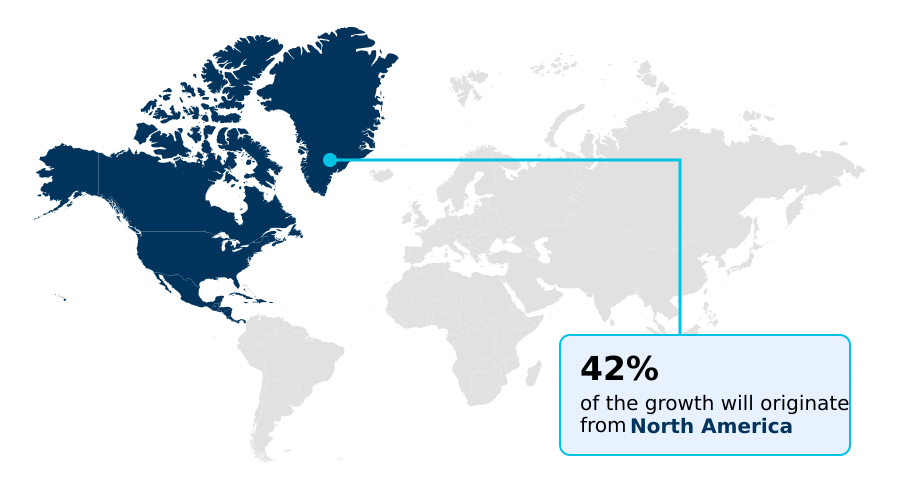
See How Healthcare Third-Party Logistics Market Demand is Rising in North America Get Free Sample

The Healthcare Third-party Logistics landscape reveals distinct operational variations driven by regional infrastructure maturity and specialized handling demands.

North America maintains a sophisticated supply chain network where multi temperature infrastructure and automated storage retrieval systems drive a 28% higher efficiency rate in pharmaceutical intermediate warehousing compared to European operations.

European networks heavily prioritize regulatory alignment, utilizing digital twin supply chain models and integrated visibility platforms to manage cross border compliance.

This technological integration across Europe has enhanced serialized track trace capabilities, reducing transit delays by 14% for advanced medicinal product logistics.

Meanwhile, North American facilities emphasize predictive route planning and specialized delivery orchestration to support time sensitive gene therapy transit across vast geographic areas.

The adoption of these localized strategies ensures supply continuity and operational resilience, allowing regional logistics providers to optimize overall network capacity.

Market Dynamics

Our researchers analyzed the data with 2025 as the base year, along with the key drivers, trends, and challenges. A holistic analysis of drivers will help companies refine their marketing strategies to gain a competitive advantage.

  • The Healthcare Third-party Logistics sector continues to evolve as pharmaceutical manufacturers seek comprehensive distribution frameworks capable of supporting highly sensitive product portfolios. Modern facilities increasingly rely on temperature controlled airfreight cross docking to minimize dwell times and safeguard the efficacy of advanced treatments during multi node transit.
  • This approach fundamentally transforms biologic supply chain operational orchestration by aligning rapid freight transfers with precise environmental controls, significantly mitigating product degradation risks. Organizations that transition to these integrated models often experience a 35% improvement in handling efficiency compared to legacy, disjointed storage practices.
  • Within distribution centers, the deployment of autonomous warehouse inventory picking systems enables faster order fulfillment and reduces the manual labor burdens that historically constrained throughput capacity. Strict adherence to clinical sample secure transit protocols remains vital for maintaining research integrity and ensuring uninterrupted laboratory workflows. By prioritizing rigorous documentation and continuous monitoring, supply chains achieve greater resilience against operational disruptions.
  • Furthermore, the integration of validated pharmaceutical secondary packaging solutions supports regulatory compliance and product customization without compromising primary containment integrity. These targeted capability enhancements allow logistics networks to synchronize inbound and outbound movements seamlessly. Consequently, businesses can effectively optimize their overall resource utilization, achieve superior delivery performance, and adapt to the increasingly rigorous demands of the healthcare ecosystem.
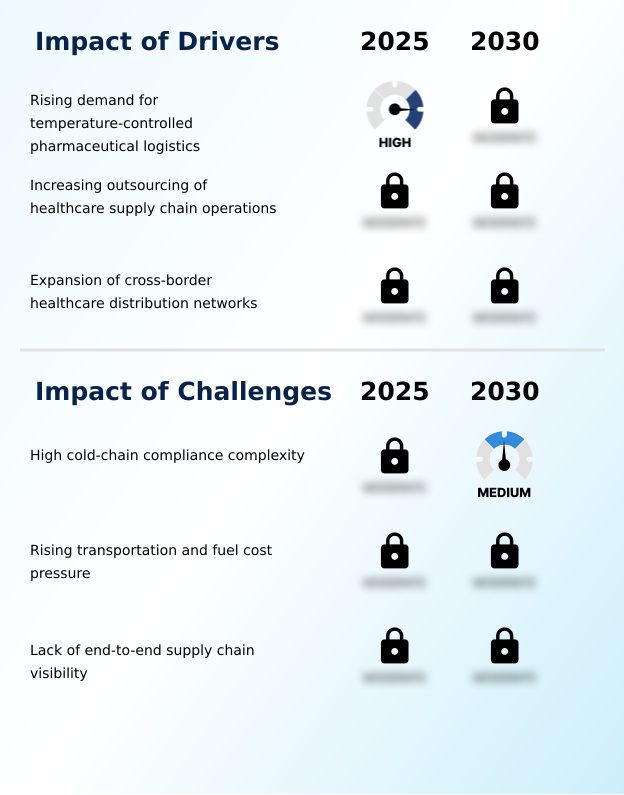
What are the key market drivers leading to the rise in the adoption of Healthcare Third-Party Logistics Industry?

  • The rising demand for temperature-controlled pharmaceutical logistics serves as a major driver propelling market expansion.

  • The increasing commercialization of specialty pharmaceuticals represents a primary structural driver for the Healthcare Third-party Logistics market. This surge in therapeutics compels manufacturers to outsource supply chain functions to partners equipped with rigorous quality assurance capabilities.
  • The integration of automated manifesting systems and specialized courier execution streamlines fulfillment operations across highly regulated distribution channels.
  • Businesses adopting pallet shuttle automation and kitting and repackaging workflows achieve a 25% improvement in facility throughput efficiency, directly addressing the demand for rapid order processing.
  • Enhancements in chain of custody documentation and cross border brokerage clearance reduce international transit bottlenecks. These operational upgrades facilitate reliable time definite dispatch and order customization processing, allowing healthcare organizations to expand geographic reach.
  • Expanding dedicated facilities utilizing specialized freight cross docking and strict compliant handling protocols ensures continuous product availability.

What are the market trends shaping the Healthcare Third-Party Logistics Industry?

  • A significant shift toward automated healthcare warehousing is emerging as a primary trend shaping the industry.

  • The integration of automated and digitized operational workflows is fundamentally shifting fulfillment strategies within the Healthcare Third-party Logistics ecosystem. This transition occurs as supply chains demand continuous visibility to support sensitive therapeutic distribution. Facilities increasingly deploy active thermal packaging and phase change materials alongside data logging transmitters to maintain continuous environmental supervision across secure transport chains.
  • By establishing real time deviation alerts, logistics operators can preemptively address temperature excursions before product integrity is compromised. Organizations utilizing multimodal transport consolidation and dynamic capacity allocation alongside advanced inventory positioning models report a 30% reduction in overall transit delays compared to traditional single mode shipping structures.
  • This technological evolution impacts businesses by strengthening secondary packaging execution and regulatory compliant handling. Enhanced supply chain synchronization ensures pharmaceutical manufacturers can scale their distribution networks efficiently while preserving strict quality control standards.

What challenges does the Healthcare Third-Party Logistics Industry face during its growth?

  • High cold-chain compliance complexity remains a critical challenge limiting operational efficiency and overall industry growth.

  • Severe operational constraints arise from escalating compliance requirements and fragmented supply chain visibility across the Healthcare Third-party Logistics ecosystem. Disconnected digital infrastructures frequently disrupt quality management parameters, complicating efforts to synchronize inbound materials with final delivery schedules. These structural bottlenecks force logistics providers to navigate intricate customs bonded coordination and continuously adapt resilient network routing to mitigate freight delays.
  • The absence of unified tracking platforms increases the administrative burden associated with automated label printing and regulatory reporting. Facilities implementing standardized integration protocols for returned goods disposition and reverse logistics management experience an 18% decrease in documentation errors compared to highly fragmented operations.
  • Such complexities impact businesses by increasing fixed operating costs for specialized infrastructure like ultra low temperature freezers and condition monitoring sensors, ultimately restricting the flexibility needed to scale distribution networks across diverse regulatory jurisdictions.

Exclusive Technavio Analysis on Customer Landscape

The healthcare third-party logistics market forecasting report includes the adoption lifecycle of the market, covering from the innovator’s stage to the laggard’s stage. It focuses on adoption rates in different regions based on penetration. Furthermore, the healthcare third-party logistics market report also includes key purchase criteria and drivers of price sensitivity to help companies evaluate and develop their market growth analysis strategies.
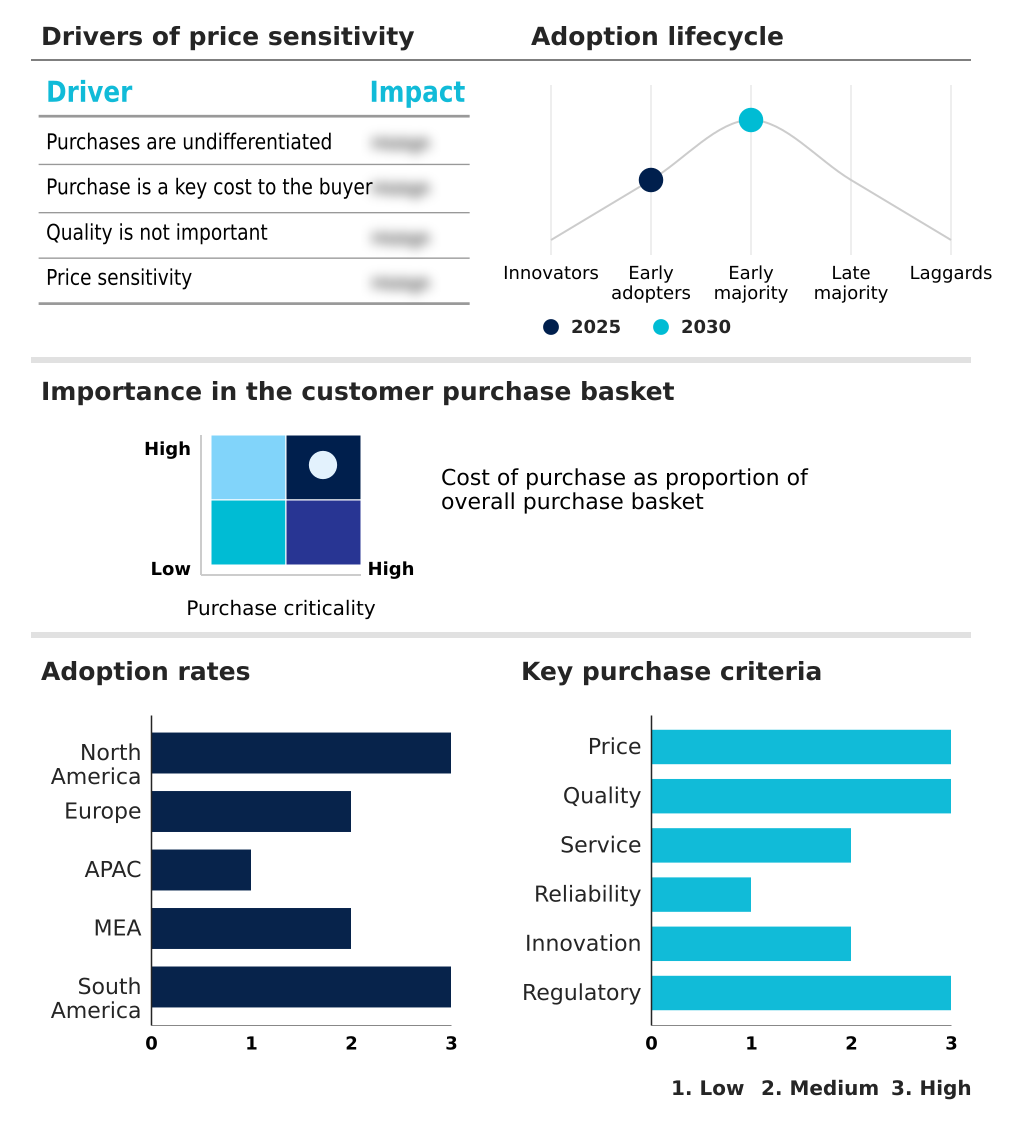
Customer Landscape of Healthcare Third-Party Logistics Industry

Competitive Landscape

Companies are implementing various strategies, such as strategic alliances, healthcare third-party logistics market forecast, partnerships, mergers and acquisitions, geographical expansion, and product/service launches, to enhance their presence in the industry.

AWL India Pvt. Ltd. - The provider delivers specialized healthcare third-party logistics services, optimizing pharmaceutical distribution, temperature-controlled transportation, and inventory management to enhance overall supply chain resilience and operational efficiency.

The industry research and growth report includes detailed analyses of the competitive landscape of the market and information about key companies, including:

  • AWL India Pvt. Ltd.
  • C H Robinson Worldwide Inc.
  • Cardinal Health Inc.
  • CEVA Logistics SA
  • DB Schenker
  • DHL International GmbH
  • DSV AS
  • FedEx Corp.
  • GEODIS
  • GXO Logistics Inc.
  • Hub Group Inc.
  • Kuehne Nagel Management AG
  • MARKEN Ltd.
  • Nippon Express Holdings Inc.
  • PSA BDP
  • Ryder System Inc.
  • SEKO Logistics
  • SF Express Co. Ltd.
  • World Courier

Qualitative and quantitative analysis of companies has been conducted to help clients understand the wider business environment as well as the strengths and weaknesses of key industry players. Data is qualitatively analyzed to categorize companies as pure play, category-focused, industry-focused, and diversified; it is quantitatively analyzed to categorize companies as dominant, leading, strong, tentative, and weak.

Recent Development and News in Healthcare third-party logistics market

  • In the Air Freight and Logistics industry, the widespread adoption of data logging transmitters and secure transport chains has directly improved transit stability, impacting Healthcare Third-party Logistics demand by reducing temperature excursion risks.
  • The integration of customs bonded coordination and automated label printing across global air freight nodes has enhanced chain of custody documentation, allowing Healthcare Third-party Logistics providers to meet strict regulatory compliant handling parameters.
  • Shifts toward dynamic capacity allocation and resilient network routing have optimized capacity utilization, directly improving Healthcare Third-party Logistics operational cost structures by 18% during high demand specialized delivery orchestration cycles.
  • The implementation of integrated visibility platforms within air cargo terminals has established real time deviation alerts, significantly increasing Healthcare Third-party Logistics reliability for advanced medicinal product logistics and precision medicine distribution.

Dive into Technavio’s robust research methodology, blending expert interviews, extensive data synthesis, and validated models for unparalleled Healthcare Third-Party Logistics Market insights. See full methodology.

Market Scope
Page number 313
Base year 2025
Historic period 2020-2024
Forecast period 2026-2030
Growth momentum & CAGR Accelerate at a CAGR of 9.9%
Market growth 2026-2030 USD 111893.7 million
Market structure Fragmented
YoY growth 2025-2026(%) 9.3%
Key countries US, Canada, Mexico, Germany, UK, France, Italy, Spain, The Netherlands, China, Japan, India, South Korea, Australia, Indonesia, Saudi Arabia, UAE, South Africa, Israel, Turkey, Brazil, Argentina and Chile
Competitive landscape Leading Companies, Market Positioning of Companies, Competitive Strategies, and Industry Risks

Request Free Sample

Research Analyst Overview

  • The Healthcare Third-party Logistics landscape is undergoing a structural transformation as pharmaceutical pipelines increasingly focus on temperature sensitive therapeutics and specialty care products. Facilities are heavily investing in ultra low temperature freezers and phase change materials to safeguard product integrity across complex distribution networks.
  • This shift toward advanced thermal protection directly influences boardroom level budgeting decisions, as continuous infrastructure modernization becomes mandatory for maintaining operational compliance. Implementing specialized freight cross docking and condition monitoring sensors ensures rapid product transfers while maintaining uninterrupted environmental visibility.
  • Supply chains utilizing these targeted strategies realize a 24% reduction in product spoilage rates compared to networks relying on traditional handling methods. The adoption of strict compliant handling protocols minimizes regulatory risks and enhances overall delivery reliability. Additionally, the refinement of reverse logistics management supports efficient product recalls and safe pharmaceutical disposal.
  • These operational improvements collectively enhance supply chain resilience, empowering healthcare organizations to optimize distribution workflows and support the expanding requirements of modern patient care.

What are the Key Data Covered in this Healthcare Third-Party Logistics Market Research and Growth Report?

  • What is the expected growth of the Healthcare Third-Party Logistics Market between 2026 and 2030?

    • USD 111.89 billion, at a CAGR of 9.9%

  • What segmentation does the market report cover?

    • The report is segmented by Type (Unit packaging, Bulk packaging, and Specialized packaging), Service Type (Warehousing and distribution, Transportation management, Packaging and labelling, Inventory management, and Value-added services), End-user (Pharma and bio companies, Medical device companies, Healthcare facilities, and Others) and Geography (North America, Europe, APAC, Middle East and Africa, South America)

  • Which regions are analyzed in the report?

    • North America, Europe, APAC, Middle East and Africa and South America

  • What are the key growth drivers and market challenges?

    • Rising demand for temperature-controlled pharmaceutical logistics, High cold-chain compliance complexity

  • Who are the major players in the Healthcare Third-Party Logistics Market?

    • AWL India Pvt. Ltd., C H Robinson Worldwide Inc., Cardinal Health Inc., CEVA Logistics SA, DB Schenker, DHL International GmbH, DSV AS, FedEx Corp., GEODIS, GXO Logistics Inc., Hub Group Inc., Kuehne Nagel Management AG, MARKEN Ltd., Nippon Express Holdings Inc., PSA BDP, Ryder System Inc., SEKO Logistics, SF Express Co. Ltd. and World Courier

Market Research Insights

  • The Healthcare Third-party Logistics market requires advanced operational coordination to manage sensitive therapeutic components and diagnostic materials. Logistics providers are enhancing dynamic capacity allocation to manage variable distribution volumes efficiently. This approach enables a 19% improvement in asset utilization compared to static infrastructure models.
  • Facilities executing regulatory compliant handling and sophisticated order customization processing maintain higher service levels across diverse medical networks. Incorporating specialized kitting and repackaging workflows reduces processing timelines, while structured returned goods disposition frameworks lower reverse logistics processing delays by 21%.
  • These measurable performance gains empower healthcare manufacturers to optimize their supply chain execution, mitigate operational risks, and maintain continuous product availability without compromising strict quality assurance protocols.

We can help! Our analysts can customize this healthcare third-party logistics market research report to meet your requirements.

Get in touch

1. Executive Summary

1.1 Market overview

Executive Summary - Chart on Market Overview
Executive Summary - Data Table on Market Overview
Executive Summary - Chart on Global Market Characteristics
Executive Summary - Chart on Market by Geography
Executive Summary - Chart on Market Segmentation by Type
Executive Summary - Chart on Market Segmentation by Service Type
Executive Summary - Chart on Market Segmentation by End-user
Executive Summary - Chart on Incremental Growth
Executive Summary - Data Table on Incremental Growth
Executive Summary - Chart on Company Market Positioning

2. Technavio Analysis

2.1 Analysis of price sensitivity, lifecycle, customer purchase basket, adoption rates, and purchase criteria

2.2 Criticality of inputs and Factors of differentiation

Chart on Overview on criticality of inputs and factors of differentiation

2.3 Factors of disruption

Chart on Overview on factors of disruption

2.4 Impact of drivers and challenges

Chart on Impact of drivers and challenges in 2025 and 2030

3. Market Landscape

3.1 Market ecosystem

Chart on Parent Market
Data Table on - Parent Market

3.2 Market characteristics

Chart on Market characteristics analysis

3.3 Value chain analysis

Chart on Value chain analysis

4. Market Sizing

4.1 Market definition

Data Table on Offerings of companies included in the market definition

4.2 Market segment analysis

Market segments

4.3 Market size 2025

4.4 Market outlook: Forecast for 2025-2030

Chart on Global - Market size and forecast 2025-2030 ($ million)
Data Table on Global - Market size and forecast 2025-2030 ($ million)
Chart on Global Market: Year-over-year growth 2025-2030 (%)
Data Table on Global Market: Year-over-year growth 2025-2030 (%)

5. Historic Market Size

5.1 Global Healthcare Third-Party Logistics Market 2020 - 2024

Historic Market Size - Data Table on Global Healthcare Third-Party Logistics Market 2020 - 2024 ($ million)

5.2 Type segment analysis 2020 - 2024

Historic Market Size - Type Segment 2020 - 2024 ($ million)

5.3 Service Type segment analysis 2020 - 2024

Historic Market Size - Service Type Segment 2020 - 2024 ($ million)

5.4 End-user segment analysis 2020 - 2024

Historic Market Size - End-user Segment 2020 - 2024 ($ million)

5.5 Geography segment analysis 2020 - 2024

Historic Market Size - Geography Segment 2020 - 2024 ($ million)

5.6 Country segment analysis 2020 - 2024

Historic Market Size - Country Segment 2020 - 2024 ($ million)

6. Qualitative Analysis

6.1 Impact of AI on global healthcare third-party logistics market

6.2 Impact of geopolitical conflicts on global healthcare third-party logistics market

7. Five Forces Analysis

7.1 Five forces summary

Five forces analysis - Comparison between 2025 and 2030

7.2 Bargaining power of buyers

Bargaining power of buyers - Impact of key factors 2025 and 2030

7.3 Bargaining power of suppliers

Bargaining power of suppliers - Impact of key factors in 2025 and 2030

7.4 Threat of new entrants

Threat of new entrants - Impact of key factors in 2025 and 2030

7.5 Threat of substitutes

Threat of substitutes - Impact of key factors in 2025 and 2030

7.6 Threat of rivalry

Threat of rivalry - Impact of key factors in 2025 and 2030

7.7 Market condition

Chart on Market condition - Five forces 2025 and 2030

8. Market Segmentation by Type

8.1 Market segments

Chart on Type - Market share 2025-2030 (%)
Data Table on Type - Market share 2025-2030 (%)

8.2 Comparison by Type

Chart on Comparison by Type
Data Table on Comparison by Type

8.3 Unit packaging - Market size and forecast 2025-2030

Chart on Unit packaging - Market size and forecast 2025-2030 ($ million)
Data Table on Unit packaging - Market size and forecast 2025-2030 ($ million)
Chart on Unit packaging - Year-over-year growth 2025-2030 (%)
Data Table on Unit packaging - Year-over-year growth 2025-2030 (%)

8.4 Bulk packaging - Market size and forecast 2025-2030

Chart on Bulk packaging - Market size and forecast 2025-2030 ($ million)
Data Table on Bulk packaging - Market size and forecast 2025-2030 ($ million)
Chart on Bulk packaging - Year-over-year growth 2025-2030 (%)
Data Table on Bulk packaging - Year-over-year growth 2025-2030 (%)

8.5 Specialized packaging - Market size and forecast 2025-2030

Chart on Specialized packaging - Market size and forecast 2025-2030 ($ million)
Data Table on Specialized packaging - Market size and forecast 2025-2030 ($ million)
Chart on Specialized packaging - Year-over-year growth 2025-2030 (%)
Data Table on Specialized packaging - Year-over-year growth 2025-2030 (%)

8.6 Market opportunity by Type

Market opportunity by Type ($ million)
Data Table on Market opportunity by Type ($ million)

9. Market Segmentation by Service Type

9.1 Market segments

Chart on Service Type - Market share 2025-2030 (%)
Data Table on Service Type - Market share 2025-2030 (%)

9.2 Comparison by Service Type

Chart on Comparison by Service Type
Data Table on Comparison by Service Type

9.3 Warehousing and distribution - Market size and forecast 2025-2030

Chart on Warehousing and distribution - Market size and forecast 2025-2030 ($ million)
Data Table on Warehousing and distribution - Market size and forecast 2025-2030 ($ million)
Chart on Warehousing and distribution - Year-over-year growth 2025-2030 (%)
Data Table on Warehousing and distribution - Year-over-year growth 2025-2030 (%)

9.4 Transportation management - Market size and forecast 2025-2030

Chart on Transportation management - Market size and forecast 2025-2030 ($ million)
Data Table on Transportation management - Market size and forecast 2025-2030 ($ million)
Chart on Transportation management - Year-over-year growth 2025-2030 (%)
Data Table on Transportation management - Year-over-year growth 2025-2030 (%)

9.5 Packaging and labelling - Market size and forecast 2025-2030

Chart on Packaging and labelling - Market size and forecast 2025-2030 ($ million)
Data Table on Packaging and labelling - Market size and forecast 2025-2030 ($ million)
Chart on Packaging and labelling - Year-over-year growth 2025-2030 (%)
Data Table on Packaging and labelling - Year-over-year growth 2025-2030 (%)

9.6 Inventory management - Market size and forecast 2025-2030

Chart on Inventory management - Market size and forecast 2025-2030 ($ million)
Data Table on Inventory management - Market size and forecast 2025-2030 ($ million)
Chart on Inventory management - Year-over-year growth 2025-2030 (%)
Data Table on Inventory management - Year-over-year growth 2025-2030 (%)

9.7 Value-added services - Market size and forecast 2025-2030

Chart on Value-added services - Market size and forecast 2025-2030 ($ million)
Data Table on Value-added services - Market size and forecast 2025-2030 ($ million)
Chart on Value-added services - Year-over-year growth 2025-2030 (%)
Data Table on Value-added services - Year-over-year growth 2025-2030 (%)

9.8 Market opportunity by Service Type

Market opportunity by Service Type ($ million)
Data Table on Market opportunity by Service Type ($ million)

10. Market Segmentation by End-user

10.1 Market segments

Chart on End-user - Market share 2025-2030 (%)
Data Table on End-user - Market share 2025-2030 (%)

10.2 Comparison by End-user

Chart on Comparison by End-user
Data Table on Comparison by End-user

10.3 Pharma and bio companies - Market size and forecast 2025-2030

Chart on Pharma and bio companies - Market size and forecast 2025-2030 ($ million)
Data Table on Pharma and bio companies - Market size and forecast 2025-2030 ($ million)
Chart on Pharma and bio companies - Year-over-year growth 2025-2030 (%)
Data Table on Pharma and bio companies - Year-over-year growth 2025-2030 (%)

10.4 Medical device companies - Market size and forecast 2025-2030

Chart on Medical device companies - Market size and forecast 2025-2030 ($ million)
Data Table on Medical device companies - Market size and forecast 2025-2030 ($ million)
Chart on Medical device companies - Year-over-year growth 2025-2030 (%)
Data Table on Medical device companies - Year-over-year growth 2025-2030 (%)

10.5 Healthcare facilities - Market size and forecast 2025-2030

Chart on Healthcare facilities - Market size and forecast 2025-2030 ($ million)
Data Table on Healthcare facilities - Market size and forecast 2025-2030 ($ million)
Chart on Healthcare facilities - Year-over-year growth 2025-2030 (%)
Data Table on Healthcare facilities - Year-over-year growth 2025-2030 (%)

10.6 Others - Market size and forecast 2025-2030

Chart on Others - Market size and forecast 2025-2030 ($ million)
Data Table on Others - Market size and forecast 2025-2030 ($ million)
Chart on Others - Year-over-year growth 2025-2030 (%)
Data Table on Others - Year-over-year growth 2025-2030 (%)

10.7 Market opportunity by End-user

Market opportunity by End-user ($ million)
Data Table on Market opportunity by End-user ($ million)

11. Customer Landscape

11.1 Customer landscape overview

Analysis of price sensitivity, lifecycle, customer purchase basket, adoption rates, and purchase criteria

12. Geographic Landscape

12.1 Geographic segmentation

Chart on Market share by geography 2025-2030 (%)
Data Table on Market share by geography 2025-2030 (%)

12.2 Geographic comparison

Chart on Geographic comparison
Data Table on Geographic comparison

12.3 North America - Market size and forecast 2025-2030

Chart on North America - Market size and forecast 2025-2030 ($ million)
Data Table on North America - Market size and forecast 2025-2030 ($ million)
Chart on North America - Year-over-year growth 2025-2030 (%)
Data Table on North America - Year-over-year growth 2025-2030 (%)
Chart on Regional Comparison - North America
Data Table on Regional Comparison - North America

12.3.1 US - Market size and forecast 2025-2030

Chart on US - Market size and forecast 2025-2030 ($ million)
Data Table on US - Market size and forecast 2025-2030 ($ million)
Chart on US - Year-over-year growth 2025-2030 (%)
Data Table on US - Year-over-year growth 2025-2030 (%)

12.3.2 Canada - Market size and forecast 2025-2030

Chart on Canada - Market size and forecast 2025-2030 ($ million)
Data Table on Canada - Market size and forecast 2025-2030 ($ million)
Chart on Canada - Year-over-year growth 2025-2030 (%)
Data Table on Canada - Year-over-year growth 2025-2030 (%)

12.3.3 Mexico - Market size and forecast 2025-2030

Chart on Mexico - Market size and forecast 2025-2030 ($ million)
Data Table on Mexico - Market size and forecast 2025-2030 ($ million)
Chart on Mexico - Year-over-year growth 2025-2030 (%)
Data Table on Mexico - Year-over-year growth 2025-2030 (%)

12.4 Europe - Market size and forecast 2025-2030

Chart on Europe - Market size and forecast 2025-2030 ($ million)
Data Table on Europe - Market size and forecast 2025-2030 ($ million)
Chart on Europe - Year-over-year growth 2025-2030 (%)
Data Table on Europe - Year-over-year growth 2025-2030 (%)
Chart on Regional Comparison - Europe
Data Table on Regional Comparison - Europe

12.4.1 Germany - Market size and forecast 2025-2030

Chart on Germany - Market size and forecast 2025-2030 ($ million)
Data Table on Germany - Market size and forecast 2025-2030 ($ million)
Chart on Germany - Year-over-year growth 2025-2030 (%)
Data Table on Germany - Year-over-year growth 2025-2030 (%)

12.4.2 UK - Market size and forecast 2025-2030

Chart on UK - Market size and forecast 2025-2030 ($ million)
Data Table on UK - Market size and forecast 2025-2030 ($ million)
Chart on UK - Year-over-year growth 2025-2030 (%)
Data Table on UK - Year-over-year growth 2025-2030 (%)

12.4.3 France - Market size and forecast 2025-2030

Chart on France - Market size and forecast 2025-2030 ($ million)
Data Table on France - Market size and forecast 2025-2030 ($ million)
Chart on France - Year-over-year growth 2025-2030 (%)
Data Table on France - Year-over-year growth 2025-2030 (%)

12.4.4 Italy - Market size and forecast 2025-2030

Chart on Italy - Market size and forecast 2025-2030 ($ million)
Data Table on Italy - Market size and forecast 2025-2030 ($ million)
Chart on Italy - Year-over-year growth 2025-2030 (%)
Data Table on Italy - Year-over-year growth 2025-2030 (%)

12.4.5 Spain - Market size and forecast 2025-2030

Chart on Spain - Market size and forecast 2025-2030 ($ million)
Data Table on Spain - Market size and forecast 2025-2030 ($ million)
Chart on Spain - Year-over-year growth 2025-2030 (%)
Data Table on Spain - Year-over-year growth 2025-2030 (%)

12.4.6 The Netherlands - Market size and forecast 2025-2030

Chart on The Netherlands - Market size and forecast 2025-2030 ($ million)
Data Table on The Netherlands - Market size and forecast 2025-2030 ($ million)
Chart on The Netherlands - Year-over-year growth 2025-2030 (%)
Data Table on The Netherlands - Year-over-year growth 2025-2030 (%)

12.5 APAC - Market size and forecast 2025-2030

Chart on APAC - Market size and forecast 2025-2030 ($ million)
Data Table on APAC - Market size and forecast 2025-2030 ($ million)
Chart on APAC - Year-over-year growth 2025-2030 (%)
Data Table on APAC - Year-over-year growth 2025-2030 (%)
Chart on Regional Comparison - APAC
Data Table on Regional Comparison - APAC

12.5.1 China - Market size and forecast 2025-2030

Chart on China - Market size and forecast 2025-2030 ($ million)
Data Table on China - Market size and forecast 2025-2030 ($ million)
Chart on China - Year-over-year growth 2025-2030 (%)
Data Table on China - Year-over-year growth 2025-2030 (%)

12.5.2 Japan - Market size and forecast 2025-2030

Chart on Japan - Market size and forecast 2025-2030 ($ million)
Data Table on Japan - Market size and forecast 2025-2030 ($ million)
Chart on Japan - Year-over-year growth 2025-2030 (%)
Data Table on Japan - Year-over-year growth 2025-2030 (%)

12.5.3 India - Market size and forecast 2025-2030

Chart on India - Market size and forecast 2025-2030 ($ million)
Data Table on India - Market size and forecast 2025-2030 ($ million)
Chart on India - Year-over-year growth 2025-2030 (%)
Data Table on India - Year-over-year growth 2025-2030 (%)

12.5.4 South Korea - Market size and forecast 2025-2030

Chart on South Korea - Market size and forecast 2025-2030 ($ million)
Data Table on South Korea - Market size and forecast 2025-2030 ($ million)
Chart on South Korea - Year-over-year growth 2025-2030 (%)
Data Table on South Korea - Year-over-year growth 2025-2030 (%)

12.5.5 Australia - Market size and forecast 2025-2030

Chart on Australia - Market size and forecast 2025-2030 ($ million)
Data Table on Australia - Market size and forecast 2025-2030 ($ million)
Chart on Australia - Year-over-year growth 2025-2030 (%)
Data Table on Australia - Year-over-year growth 2025-2030 (%)

12.5.6 Indonesia - Market size and forecast 2025-2030

Chart on Indonesia - Market size and forecast 2025-2030 ($ million)
Data Table on Indonesia - Market size and forecast 2025-2030 ($ million)
Chart on Indonesia - Year-over-year growth 2025-2030 (%)
Data Table on Indonesia - Year-over-year growth 2025-2030 (%)

12.6 Middle East and Africa - Market size and forecast 2025-2030

Chart on Middle East and Africa - Market size and forecast 2025-2030 ($ million)
Data Table on Middle East and Africa - Market size and forecast 2025-2030 ($ million)
Chart on Middle East and Africa - Year-over-year growth 2025-2030 (%)
Data Table on Middle East and Africa - Year-over-year growth 2025-2030 (%)
Chart on Regional Comparison - Middle East and Africa
Data Table on Regional Comparison - Middle East and Africa

12.6.1 Saudi Arabia - Market size and forecast 2025-2030

Chart on Saudi Arabia - Market size and forecast 2025-2030 ($ million)
Data Table on Saudi Arabia - Market size and forecast 2025-2030 ($ million)
Chart on Saudi Arabia - Year-over-year growth 2025-2030 (%)
Data Table on Saudi Arabia - Year-over-year growth 2025-2030 (%)

12.6.2 UAE - Market size and forecast 2025-2030

Chart on UAE - Market size and forecast 2025-2030 ($ million)
Data Table on UAE - Market size and forecast 2025-2030 ($ million)
Chart on UAE - Year-over-year growth 2025-2030 (%)
Data Table on UAE - Year-over-year growth 2025-2030 (%)

12.6.3 South Africa - Market size and forecast 2025-2030

Chart on South Africa - Market size and forecast 2025-2030 ($ million)
Data Table on South Africa - Market size and forecast 2025-2030 ($ million)
Chart on South Africa - Year-over-year growth 2025-2030 (%)
Data Table on South Africa - Year-over-year growth 2025-2030 (%)

12.6.4 Israel - Market size and forecast 2025-2030

Chart on Israel - Market size and forecast 2025-2030 ($ million)
Data Table on Israel - Market size and forecast 2025-2030 ($ million)
Chart on Israel - Year-over-year growth 2025-2030 (%)
Data Table on Israel - Year-over-year growth 2025-2030 (%)

12.6.5 Turkey - Market size and forecast 2025-2030

Chart on Turkey - Market size and forecast 2025-2030 ($ million)
Data Table on Turkey - Market size and forecast 2025-2030 ($ million)
Chart on Turkey - Year-over-year growth 2025-2030 (%)
Data Table on Turkey - Year-over-year growth 2025-2030 (%)

12.7 South America - Market size and forecast 2025-2030

Chart on South America - Market size and forecast 2025-2030 ($ million)
Data Table on South America - Market size and forecast 2025-2030 ($ million)
Chart on South America - Year-over-year growth 2025-2030 (%)
Data Table on South America - Year-over-year growth 2025-2030 (%)
Chart on Regional Comparison - South America
Data Table on Regional Comparison - South America

12.7.1 Brazil - Market size and forecast 2025-2030

Chart on Brazil - Market size and forecast 2025-2030 ($ million)
Data Table on Brazil - Market size and forecast 2025-2030 ($ million)
Chart on Brazil - Year-over-year growth 2025-2030 (%)
Data Table on Brazil - Year-over-year growth 2025-2030 (%)

12.7.2 Argentina - Market size and forecast 2025-2030

Chart on Argentina - Market size and forecast 2025-2030 ($ million)
Data Table on Argentina - Market size and forecast 2025-2030 ($ million)
Chart on Argentina - Year-over-year growth 2025-2030 (%)
Data Table on Argentina - Year-over-year growth 2025-2030 (%)

12.7.3 Chile - Market size and forecast 2025-2030

Chart on Chile - Market size and forecast 2025-2030 ($ million)
Data Table on Chile - Market size and forecast 2025-2030 ($ million)
Chart on Chile - Year-over-year growth 2025-2030 (%)
Data Table on Chile - Year-over-year growth 2025-2030 (%)

12.8 Market opportunity by geography

Market opportunity by geography ($ million)
Data Tables on Market opportunity by geography ($ million)

13. Drivers, Challenges, and Opportunity

13.1 Market drivers

Rising demand for temperature-controlled pharmaceutical logistics
Increasing outsourcing of healthcare supply chain operations
Expansion of cross-border healthcare distribution networks

13.2 Market challenges

High cold-chain compliance complexity
Rising transportation and fuel cost pressure
Lack of end-to-end supply chain visibility

13.3 Impact of drivers and challenges

Impact of drivers and challenges in 2025 and 2030

13.4 Market opportunities

Shift toward automated healthcare warehousing
Increasing investment in healthcare logistics infrastructure expansion
Expansion of specialty pharmaceutical and advanced therapy logistics

14. Competitive Landscape

14.1 Overview

14.2

Overview on criticality of inputs and factors of differentiation

14.3 Landscape disruption

Overview on factors of disruption

14.4 Industry risks

Impact of key risks on business

15. Competitive Analysis

15.1 Companies profiled

Companies covered

15.2 Company ranking index

15.3 Market positioning of companies

Matrix on companies position and classification

15.4 C H Robinson Worldwide Inc.

C H Robinson Worldwide Inc. - Overview
C H Robinson Worldwide Inc. - Business segments
C H Robinson Worldwide Inc. - Key news
C H Robinson Worldwide Inc. - Key offerings
C H Robinson Worldwide Inc. - Segment focus
SWOT

15.5 Cardinal Health Inc.

Cardinal Health Inc. - Overview
Cardinal Health Inc. - Business segments
Cardinal Health Inc. - Key news
Cardinal Health Inc. - Key offerings
Cardinal Health Inc. - Segment focus
SWOT

15.6 CEVA Logistics SA

CEVA Logistics SA - Overview
CEVA Logistics SA - Product / Service
CEVA Logistics SA - Key offerings
SWOT

15.7 DB Schenker

DB Schenker - Overview
DB Schenker - Product / Service
DB Schenker - Key offerings
SWOT

15.8 DHL International GmbH

DHL International GmbH - Overview
DHL International GmbH - Business segments
DHL International GmbH - Key news
DHL International GmbH - Key offerings
DHL International GmbH - Segment focus
SWOT

15.9 DSV AS

DSV AS - Overview
DSV AS - Business segments
DSV AS - Key offerings
DSV AS - Segment focus
SWOT

15.10 FedEx Corp.

FedEx Corp. - Overview
FedEx Corp. - Business segments
FedEx Corp. - Key news
FedEx Corp. - Key offerings
FedEx Corp. - Segment focus
SWOT

15.11 GXO Logistics Inc.

GXO Logistics Inc. - Overview
GXO Logistics Inc. - Product / Service
GXO Logistics Inc. - Key offerings
SWOT

15.12 Hub Group Inc.

Hub Group Inc. - Overview
Hub Group Inc. - Business segments
Hub Group Inc. - Key offerings
Hub Group Inc. - Segment focus
SWOT

15.13 Kuehne Nagel Management AG

Kuehne Nagel Management AG - Overview
Kuehne Nagel Management AG - Business segments
Kuehne Nagel Management AG - Key news
Kuehne Nagel Management AG - Key offerings
Kuehne Nagel Management AG - Segment focus
SWOT

15.14 Nippon Express Holdings Inc.

Nippon Express Holdings Inc. - Overview
Nippon Express Holdings Inc. - Business segments
Nippon Express Holdings Inc. - Key offerings
Nippon Express Holdings Inc. - Segment focus
SWOT

15.15 PSA BDP

PSA BDP - Overview
PSA BDP - Product / Service
PSA BDP - Key offerings
SWOT

15.16 Ryder System Inc.

Ryder System Inc. - Overview
Ryder System Inc. - Business segments
Ryder System Inc. - Key offerings
Ryder System Inc. - Segment focus
SWOT

15.17 SEKO Logistics

SEKO Logistics - Overview
SEKO Logistics - Product / Service
SEKO Logistics - Key offerings
SWOT

15.18 SF Express Co. Ltd.

SF Express Co. Ltd. - Overview
SF Express Co. Ltd. - Business segments
SF Express Co. Ltd. - Key offerings
SF Express Co. Ltd. - Segment focus
SWOT

16. Appendix

16.1 Scope of the report

Market definition
Objectives
Notes and caveats

16.2 Inclusions and exclusions checklist

Inclusions checklist
Exclusions checklist

16.3 Currency conversion rates for US$

16.4 Research methodology

16.5 Data procurement

Information sources

16.6 Data validation

16.7 Validation techniques employed for market sizing

16.8 Data synthesis

16.9 360 degree market analysis

16.10 List of abbreviations

Research Methodology

Technavio presents a detailed picture of the market by way of study, synthesis, and summation of data from multiple sources. The analysts have presented the various facets of the market with a particular focus on identifying the key industry influencers. The data thus presented is comprehensive, reliable, and the result of extensive research, both primary and secondary.

INFORMATION SOURCES

Primary sources

  • Manufacturers and suppliers
  • Channel partners
  • Industry experts
  • Strategic decision makers

Secondary sources

  • Industry journals and periodicals
  • Government data
  • Financial reports of key industry players
  • Historical data
  • Press releases

DATA ANALYSIS

Data Synthesis

  • Collation of data
  • Estimation of key figures
  • Analysis of derived insights

Data Validation

  • Triangulation with data models
  • Reference against proprietary databases
  • Corroboration with industry experts

REPORT WRITING

Qualitative

  • Market drivers
  • Market challenges
  • Market trends
  • Five forces analysis

Quantitative

  • Market size and forecast
  • Market segmentation
  • Geographical insights
  • Competitive landscape

Interested in this report?

Get your sample now to see our research methodology and insights!

Download Now

Frequently Asked Questions

Healthcare Third-Party Logistics market growth will increase by USD 111893.7 million during 2026-2030.

The Healthcare Third-Party Logistics market is expected to grow at a CAGR of 9.9% during 2026-2030.

Healthcare Third-Party Logistics market is segmented by Type (Unit packaging, Bulk packaging, Specialized packaging) Service type (Warehousing and distribution, Transportation management, Packaging and labelling, Inventory management, Value-added services) End-user (Pharma and bio companies, Medical device companies, Healthcare facilities, Others)

AWL India Pvt. Ltd., C H Robinson Worldwide Inc., Cardinal Health Inc., CEVA Logistics SA, DB Schenker, DHL International GmbH, DSV AS, FedEx Corp., GEODIS, GXO Logistics Inc., Hub Group Inc., Kuehne Nagel Management AG, MARKEN Ltd., Nippon Express Holdings Inc., PSA BDP, Ryder System Inc., SEKO Logistics, SF Express Co. Ltd., World Courier are a few of the key vendors in the Healthcare Third-Party Logistics market.

North America will register the highest growth rate of 42.3% among the other regions. Therefore, the Healthcare Third-Party Logistics market in North America is expected to garner significant business opportunities for the vendors during the forecast period.

US, Canada, Mexico, Germany, UK, France, Italy, Spain, The Netherlands, China, Japan, India, South Korea, Australia, Indonesia, Saudi Arabia, UAE, South Africa, Israel, Turkey, Brazil, Argentina, Chile

  • Rising demand for temperature-controlled pharmaceutical logistics is the driving factor this market.

The Healthcare Third-Party Logistics market vendors should focus on grabbing business opportunities from the Type segment as it accounted for the largest market share in the base year.
RIA - Research AI Assistant
Ask RIA
