Heat and Energy Recovery Ventilation System Market Analysis North America, Europe, APAC, South America, Middle East and Africa - US, Canada, China, Japan, UK - Size and Forecast 2024-2028

Heat and Energy Recovery Ventilation System Market Analysis North America, Europe, APAC, South America, Middle East and Africa - US, Canada, China, Japan, UK - Size and Forecast 2024-2028

Published: Nov 2023 172 Pages SKU: IRTNTR76778

Market Overview at a Glance

$1.77 B
Market Opportunity
8.17%
CAGR
7.66
YoY growth 2023-2024(%)

Heat and Energy Recovery Ventilation System Market Size 2024-2028 

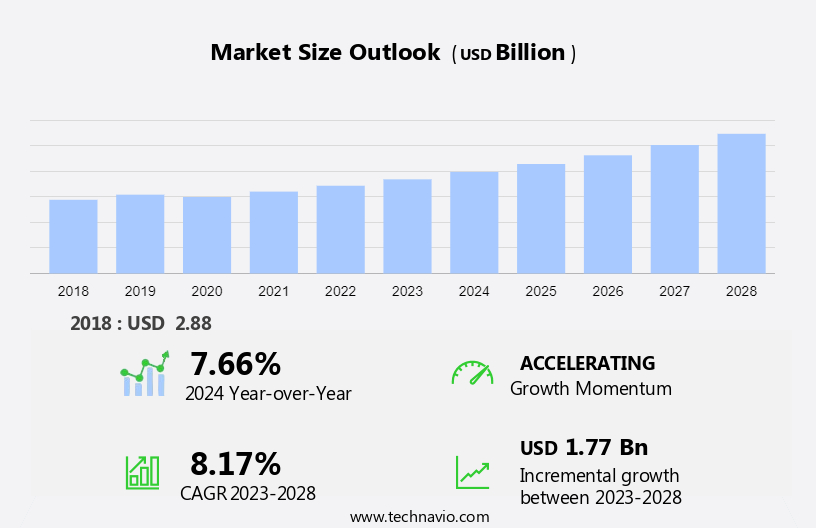
The heat and energy recovery ventilation system market size is forecast to increase by USD 1.77 billion at a CAGR of 8.17% between 2023 and 2028.

  • The market is driven by several key factors. Primarily, the rising awareness of indoor air quality has led to an increasing demand for HERV systems. These systems effectively recover heat and energy from exhaust air, making them an essential component of modern buildings. Additionally, the integration of HERV systems with smart building technologies and the Internet of Things (IoT) is trending, enabling remote monitoring and control of ventilation systems for enhanced energy efficiency and comfort. However, the high initial upfront cost of HERV systems remains a significant challenge, which may hinder market growth. Despite this, the long-term energy savings and improved indoor air quality offered by HERV systems make them a worthwhile investment for building owners and managers.

What will be the Size of the Market During the Forecast Period?

Heat and Energy Recovery Ventilation System Market Size

 Request Free Sample

  • The market encompasses the production, sales, and installation of HERV systems used for maintaining pleasant air quality in buildings. These systems, which include ERV air exchangers and air handling units, facilitate the exchange of indoor and outdoor air while conserving energy. HERV systems play a crucial role in mitigating the impact of pollutants, pollen, and hazardous contaminants in buildings, contributing significantly to Environmental Protection and the enhancement of cognitive function. The market for these systems is experiencing growth trends in the context of Green Buildings, as asset value and air quality become increasingly important considerations.
  • Furthermore, the market research methodology for HERV systems involves the use of secondary sources, such as industry reports and publications, to gather data on energy conservation, air filtration mechanisms, and ventilation ducts. The market is driven by the demand for improved indoor air quality, as well as the need for sustainable and energy-efficient building solutions. Air handling units and ductwork are integral components of HERV systems, ensuring efficient heat and energy transfer between the indoor and outdoor air streams. The HERV market is expected to continue its growth trajectory, driven by the increasing awareness of the importance of maintaining healthy indoor environments.

How is this market segmented and which is the largest segment?

The market research report provides comprehensive data (region-wise segment analysis), with forecasts and estimates in "USD billion" for the period 2024-2028, as well as historical data from 2018-2022 for the following segments.
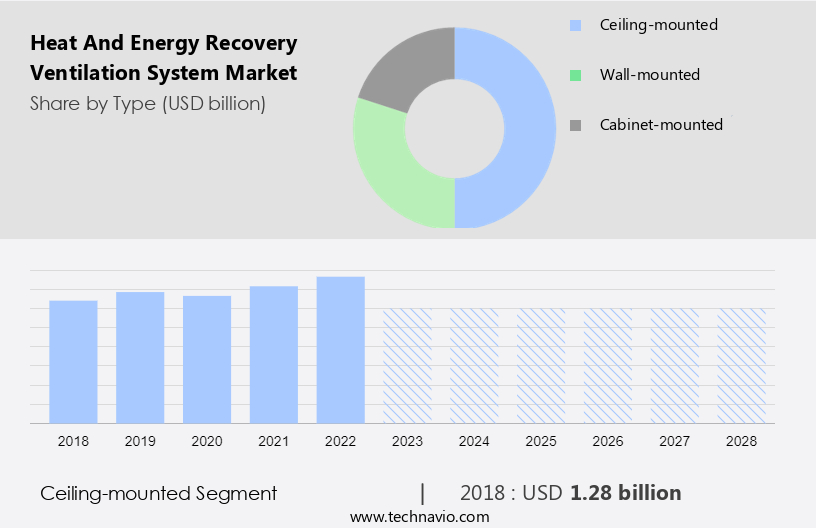
  • Type
    • Ceiling-mounted
    • Wall-mounted
    • Cabinet-mounted
  • End-user
    • Commercial
    • Residential
    • Industrial
  • Geography
    • North America
      • Canada
      • US
    • Europe
      • UK
    • APAC
      • China
      • Japan
    • South America
    • Middle East and Africa

By Type Insights

  • The ceiling-mounted segment is estimated to witness significant growth during the forecast period.

Ceiling-mounted heat and energy recovery ventilation systems have gained significant popularity in the global market due to their adaptability, efficiency, and compact design. These systems are favored for both residential and commercial applications due to their ability to be discreetly installed in ceiling spaces, enhancing interior design and minimizing installation footprint. In commercial buildings, they are often chosen to optimize usable floor areas. The efficient dispersion of conditioned air, made possible by their centralized positioning, is another advantage. Ceiling-mounted systems also minimize visual effects in living spaces and ensure improved air quality in residential situations. Government regulations promoting energy efficiency and sustainable building solutions have driven the market's YOY growth.

Furthermore, the fragmented market is witnessing increasing competition among key players, leading to innovations and advancements in air filtration technologies. Smart building integration and the increasing focus on energy expenses are also key trends in the market. Ceiling-mounted heat and energy recovery ventilation systems offer an excellent return on investment by reducing energy expenses in the long run. The market is expected to continue growing as more buildings adopt sustainable building solutions to reduce their carbon footprint.

Heat and Energy Recovery Ventilation System Market Size

Get a glance at the market report of share of various segments Request Free Sample

The Ceiling-mounted segment was valued at USD 1.28 billion in 2018 and showed a gradual increase during the forecast period.

Regional Analysis

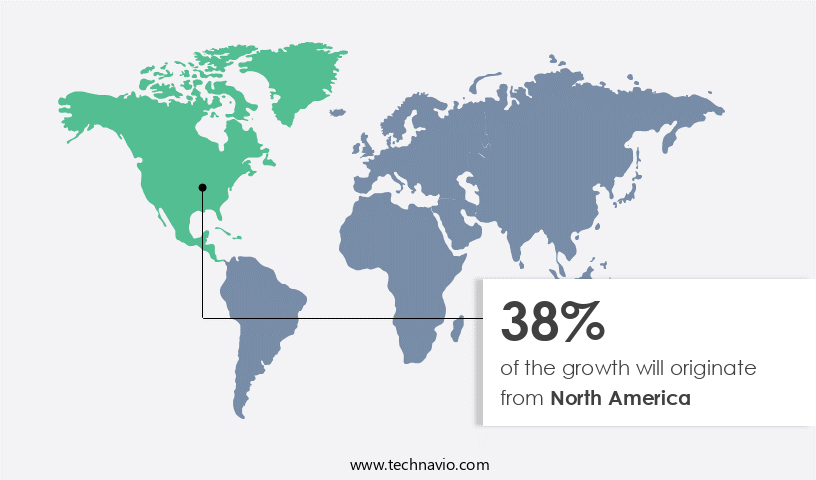
  • North America is estimated to contribute 38% to the growth of the global market during the forecast period.

Technavio's analysts have elaborately explained the regional trends and drivers that shape the market during the forecast period.

Heat and Energy Recovery Ventilation System Market Share by Geography

For more insights on the market share of various regions Request Free Sample

The North American market represents a fragmented landscape, experiencing year-on-year growth. This expansion is driven by the increasing demand for smart and sustainable building solutions, as well as stricter environmental regulations. Heat and energy recovery ventilation systems are gaining popularity due to their ability to conserve energy while maintaining optimal interior climate. These systems incorporate advanced technologies, such as heat pumps and air handling units, to facilitate efficient heat exchange between incoming and outgoing air streams. The ceiling-mounted segment of energy recovery ventilation systems is particularly adaptable, offering compact designs that cater to various architectural requirements. Upfront expenses for these systems may be higher than traditional ventilation methods, but the long-term energy savings and air filtration mechanisms make them a worthwhile investment.

Furthermore, ventilation ducts and ductwork are essential components of these systems, ensuring proper air circulation and climate settings. Contaminants are effectively removed through air filtration mechanisms, contributing to improved indoor air quality. Modern heat and energy recovery systems are equipped with automation and control features, allowing for precise climate settings and energy conservation. As leading North American manufacturers, such as Lennox, Carrier, and Trane, continue to innovate and introduce new technologies, the market for energy recovery ventilation systems is poised for continued growth.

Market Dynamics

Our researchers analyzed the data with 2023 as the base year, along with the key drivers, trends, and challenges. A holistic analysis of drivers will help companies refine their marketing strategies to gain a competitive advantage.

What are the key market drivers leading to the rise in the adoption of Heat and Energy Recovery Ventilation System Market?

Rising demand for heat and energy recovery ventilation systems due to awareness of indoor air quality is the key driver of the market.

  • The significance of indoor air quality in green buildings is gaining increasing recognition, leading to the growth of the heat and energy recovery ventilation systems market. With people becoming more conscious of the health hazards posed by indoor air pollution, there is a rising demand for systems that offer superior air filtration and efficient ventilation. Heat and energy recovery ventilation systems address this need by recovering heat or energy from the exhausted interior air and introducing fresh outdoor air. This approach not only enhances indoor air quality but also reduces energy costs, making it an attractive solution for commercial and residential buildings.
  • In densely populated cities like Los Angeles, Delhi, and Beijing, where air pollution is a major concern, these systems have gained popularity due to their ability to maintain good indoor air quality by filtering out contaminants. By investing in these systems, building owners not only contribute to the well-being and productivity of their occupants but also reduce their carbon footprint and improve energy efficiency.

What are the market trends shaping the Heat and Energy Recovery Ventilation System Market?

Integration of heat and energy recovery ventilation systems with smart building technologies and the Internet of Things is the upcoming trend in the market.

  • In the market, raw material suppliers are collaborating with leading companies to integrate the Internet of Things (IoT) and smart building technologies. This integration aims to enhance the functionality and efficiency of ventilation systems. The demand for energy-efficient and sustainable building solutions is fueling this trend.
  • IoT sensors and automation enable ventilation systems to respond to real-time changes in temperature, air quality, and occupancy levels, optimizing air quality and reducing energy consumption. For instance, Panasonic's smart ventilation solutions employ IoT technology to analyze indoor air quality data and make precise, automated adjustments. This not only ensures optimal air quality but also contributes to energy savings.

What challenges does Heat and Energy Recovery Ventilation System Market face during the growth?

The high initial upfront cost is a key challenge affecting the market growth.

  • The market experiences growth driven by the energy efficiency and indoor air quality benefits these systems provide. However, the high upfront costs of purchasing and installing these systems can be a significant barrier for some customers, particularly in residential applications where less expensive ventilation alternatives may be preferred.
  • The cost of a household unit can range from USD 1,500 to USD 5,000, while industrial or commercial installations can cost tens of thousands of dollars. To gain a comprehensive understanding of the market, this analysis utilizes a combination of primary and secondary sources. Primary sources include interviews with industry experts, such as chief executive officers, and the market engineering process.

Exclusive Customer Landscape

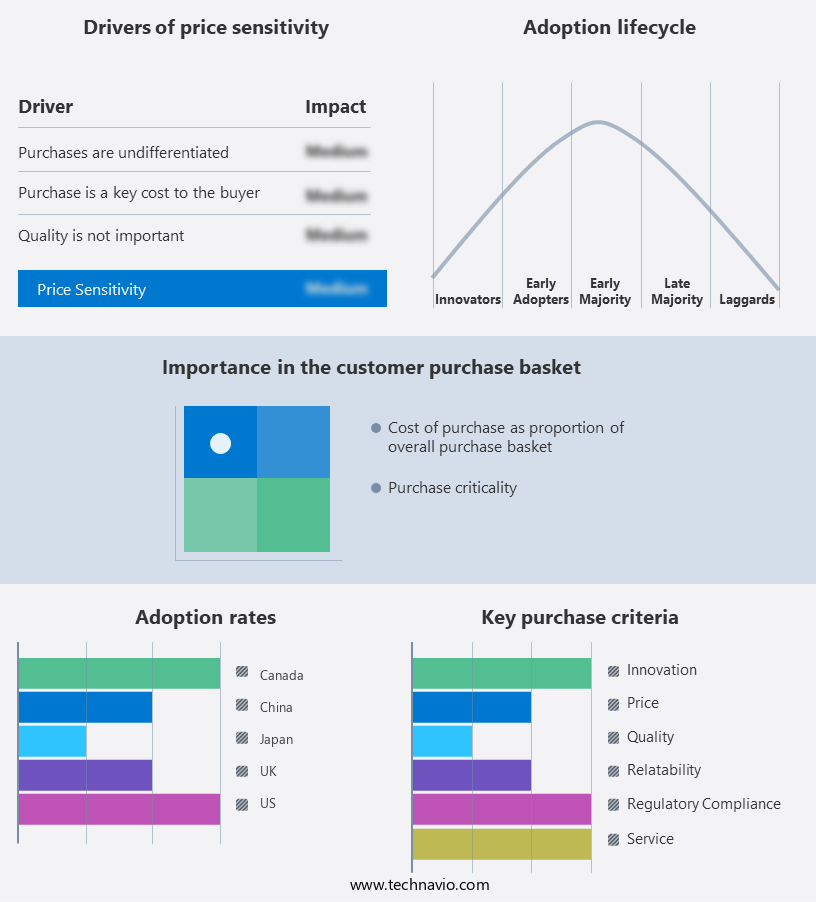
The market forecasting report includes the adoption lifecycle of the market, covering from the innovator's stage to the laggard's stage. It focuses on adoption rates in different regions based on penetration. Furthermore, the market report also includes key purchase criteria and drivers of price sensitivity to help companies evaluate and develop their market growth analysis strategies.

Heat and Energy Recovery Ventilation System Market Share by Geography

 Customer Landscape

Key Companies & Market Insights

Companies are implementing various strategies, such as strategic alliances, market forecast, partnerships, mergers and acquisitions, geographical expansion, and product/service launches, to enhance their presence in the market.

The market research and growth report includes detailed analyses of the competitive landscape of the market and information about key companies, including:

  • Airxchange Inc.
  • Carrier Global Corp.
  • Daikin Industries Ltd.
  • Dais Corp.
  • Fujitsu General Ltd.
  • Greenheck Fan Corp.
  • Johnson Controls International Plc
  • Lennox International Inc.
  • LG Electronics Inc.
  • Loren Cook Co.
  • Mitsubishi Electric Corp.
  • Munters Group AB
  • Nortek Air Solutions LLC
  • Ostberg Group AB
  • Panasonic Holdings Corp.
  • Paschal Air Plumbing and Electric.
  • S and P SISTEMAS DE VENTILACION S.L.U.
  • Trane Technologies plc
  • Zehnder Group AG
  • KARYER Heat Transfer San. and Tic. Inc.

Qualitative and quantitative analysis of companies has been conducted to help clients understand the wider business environment as well as the strengths and weaknesses of key market players. Data is qualitatively analyzed to categorize companies as pure play, category-focused, industry-focused, and diversified; it is quantitatively analyzed to categorize companies as dominant, leading, strong, tentative, and weak.

Research Analyst Overview

The market is witnessing significant growth due to the increasing focus on environmental protection and the need for pleasant air in buildings. ERV ventilation systems help in reducing energy consumption by recovering heat or cool from the exhaust air and using it to precondition the incoming fresh air. These systems play a crucial role in maintaining air quality by removing pollutants, pollen, and hazardous contaminants, contributing to better cognitive function, productivity, and well-being. ERV air exchangers are gaining popularity in both residential and commercial applications, with the latter segment accounting for a larger market share.

Furthermore, energy efficiency and carbon footprint reduction are key drivers for the adoption of ERV systems in green buildings and smart buildings. The market is fragmented with several players, including Daikin, Mitsubishi Electric, Munters, Nortek Air Solutions, and Greenheck Fan Corporation, among others. The market is witnessing growth trends in the form of increasing government regulations on air quality and energy efficiency, the adoption of automation and control in HVAC systems, and the integration of ERV systems with heat pumps and air handling units. The market engineering process involves secondary sources, including industry reports, whitepapers, and publications, as well as primary research through interviews with chief executive officers and other key personnel in the value chain.

Market Scope

Report Coverage

Details

Page number

172

Base year

2023

Historic period

2018-2022

Forecast period

2024-2028

Growth momentum & CAGR

Accelerate at a CAGR of 8.17%

Market Growth 2024-2028

USD 1.77 billion

Market structure

Fragmented

YoY growth 2023-2024(%)

7.66

Key countries

US, Canada, China, Japan, and UK

Competitive landscape

Leading Companies, Market Positioning of Companies, Competitive Strategies, and Industry Risks

Request Free Sample

What are the Key Data Covered in this Market Research and Growth Report?

  • CAGR of the market during the forecast period
  • Detailed information on factors that will drive the market growth and forecasting between 2024 and 2028
  • Precise estimation of the size of the market  and its contribution of the market in focus to the parent market
  • Accurate predictions about upcoming market growth and trends and changes in consumer behaviour
  • Growth of the market across North America, Europe, APAC, South America, and Middle East and Africa
  • Thorough analysis of the market's competitive landscape and detailed information about companies
  • Comprehensive analysis of factors that will challenge the growth of market companies

We can help! Our analysts can customize this market research report to meet your requirements. Get in touch

1 Executive Summary

  • 1.1 Market overview
    • Exhibit 01: Executive Summary – Chart on Market Overview
    • Exhibit 02: Executive Summary – Data Table on Market Overview
    • Exhibit 03: Executive Summary – Chart on Global Market Characteristics
    • Exhibit 04: Executive Summary – Chart on Market by Geography
    • Exhibit 05: Executive Summary – Chart on Market Segmentation by Type
    • Exhibit 06: Executive Summary – Chart on Market Segmentation by End-user
    • Exhibit 07: Executive Summary – Chart on Incremental Growth
    • Exhibit 08: Executive Summary – Data Table on Incremental Growth
    • Exhibit 09: Executive Summary – Chart on Vendor Market Positioning

2 Market Landscape

  • 2.1 Market ecosystem
    • Exhibit 10: Parent market
    • Exhibit 11: Market Characteristics

3 Market Sizing

  • 3.1 Market definition
    • Exhibit 12: Offerings of vendors included in the market definition
  • 3.2 Market segment analysis
    • Exhibit 13: Market segments
  • 3.3 Market size 2023
    • 3.4 Market outlook: Forecast for 2023-2028
      • Exhibit 14: Chart on Global - Market size and forecast 2023-2028 ($ billion)
      • Exhibit 15: Data Table on Global - Market size and forecast 2023-2028 ($ billion)
      • Exhibit 16: Chart on Global Market: Year-over-year growth 2023-2028 (%)
      • Exhibit 17: Data Table on Global Market: Year-over-year growth 2023-2028 (%)

    4 Historic Market Size

    • 4.1 Global heat and energy recovery ventilation system market 2018 - 2022
      • Exhibit 18: Historic Market Size – Data Table on global heat and energy recovery ventilation system market 2018 - 2022 ($ billion)
    • 4.2 Type Segment Analysis 2018 - 2022
      • Exhibit 19: Historic Market Size – Type Segment 2018 - 2022 ($ billion)
    • 4.3 End-user Segment Analysis 2018 - 2022
      • Exhibit 20: Historic Market Size – End-user Segment 2018 - 2022 ($ billion)
    • 4.4 Geography Segment Analysis 2018 - 2022
      • Exhibit 21: Historic Market Size – Geography Segment 2018 - 2022 ($ billion)
    • 4.5 Country Segment Analysis 2018 - 2022
      • Exhibit 22: Historic Market Size – Country Segment 2018 - 2022 ($ billion)

    5 Five Forces Analysis

    • 5.1 Five forces summary
      • Exhibit 23: Five forces analysis - Comparison between 2023 and 2028
    • 5.2 Bargaining power of buyers
      • Exhibit 24: Chart on Bargaining power of buyers – Impact of key factors 2023 and 2028
    • 5.3 Bargaining power of suppliers
      • Exhibit 25: Bargaining power of suppliers – Impact of key factors in 2023 and 2028
    • 5.4 Threat of new entrants
      • Exhibit 26: Threat of new entrants – Impact of key factors in 2023 and 2028
    • 5.5 Threat of substitutes
      • Exhibit 27: Threat of substitutes – Impact of key factors in 2023 and 2028
    • 5.6 Threat of rivalry
      • Exhibit 28: Threat of rivalry – Impact of key factors in 2023 and 2028
    • 5.7 Market condition
      • Exhibit 29: Chart on Market condition - Five forces 2023 and 2028

    6 Market Segmentation by Type

    • 6.1 Market segments
      • Exhibit 30: Chart on Type - Market share 2023-2028 (%)
      • Exhibit 31: Data Table on Type - Market share 2023-2028 (%)
    • 6.2 Comparison by Type
      • Exhibit 32: Chart on Comparison by Type
      • Exhibit 33: Data Table on Comparison by Type
    • 6.3 Ceiling-mounted - Market size and forecast 2023-2028
      • Exhibit 34: Chart on Ceiling-mounted - Market size and forecast 2023-2028 ($ billion)
      • Exhibit 35: Data Table on Ceiling-mounted - Market size and forecast 2023-2028 ($ billion)
      • Exhibit 36: Chart on Ceiling-mounted - Year-over-year growth 2023-2028 (%)
      • Exhibit 37: Data Table on Ceiling-mounted - Year-over-year growth 2023-2028 (%)
    • 6.4 Wall-mounted - Market size and forecast 2023-2028
      • Exhibit 38: Chart on Wall-mounted - Market size and forecast 2023-2028 ($ billion)
      • Exhibit 39: Data Table on Wall-mounted - Market size and forecast 2023-2028 ($ billion)
      • Exhibit 40: Chart on Wall-mounted - Year-over-year growth 2023-2028 (%)
      • Exhibit 41: Data Table on Wall-mounted - Year-over-year growth 2023-2028 (%)
    • 6.5 Cabinet-mounted - Market size and forecast 2023-2028
      • Exhibit 42: Chart on Cabinet-mounted - Market size and forecast 2023-2028 ($ billion)
      • Exhibit 43: Data Table on Cabinet-mounted - Market size and forecast 2023-2028 ($ billion)
      • Exhibit 44: Chart on Cabinet-mounted - Year-over-year growth 2023-2028 (%)
      • Exhibit 45: Data Table on Cabinet-mounted - Year-over-year growth 2023-2028 (%)
    • 6.6 Market opportunity by Type
      • Exhibit 46: Market opportunity by Type ($ billion)
      • Exhibit 47: Data Table on Market opportunity by Type ($ billion)

    7 Market Segmentation by End-user

    • 7.1 Market segments
      • Exhibit 48: Chart on End-user - Market share 2023-2028 (%)
      • Exhibit 49: Data Table on End-user - Market share 2023-2028 (%)
    • 7.2 Comparison by End-user
      • Exhibit 50: Chart on Comparison by End-user
      • Exhibit 51: Data Table on Comparison by End-user
    • 7.3 Commercial - Market size and forecast 2023-2028
      • Exhibit 52: Chart on Commercial - Market size and forecast 2023-2028 ($ billion)
      • Exhibit 53: Data Table on Commercial - Market size and forecast 2023-2028 ($ billion)
      • Exhibit 54: Chart on Commercial - Year-over-year growth 2023-2028 (%)
      • Exhibit 55: Data Table on Commercial - Year-over-year growth 2023-2028 (%)
    • 7.4 Residential - Market size and forecast 2023-2028
      • Exhibit 56: Chart on Residential - Market size and forecast 2023-2028 ($ billion)
      • Exhibit 57: Data Table on Residential - Market size and forecast 2023-2028 ($ billion)
      • Exhibit 58: Chart on Residential - Year-over-year growth 2023-2028 (%)
      • Exhibit 59: Data Table on Residential - Year-over-year growth 2023-2028 (%)
    • 7.5 Industrial - Market size and forecast 2023-2028
      • Exhibit 60: Chart on Industrial - Market size and forecast 2023-2028 ($ billion)
      • Exhibit 61: Data Table on Industrial - Market size and forecast 2023-2028 ($ billion)
      • Exhibit 62: Chart on Industrial - Year-over-year growth 2023-2028 (%)
      • Exhibit 63: Data Table on Industrial - Year-over-year growth 2023-2028 (%)
    • 7.6 Market opportunity by End-user
      • Exhibit 64: Market opportunity by End-user ($ billion)
      • Exhibit 65: Data Table on Market opportunity by End-user ($ billion)

    8 Customer Landscape

    • 8.1 Customer landscape overview
      • Exhibit 66: Analysis of price sensitivity, lifecycle, customer purchase basket, adoption rates, and purchase criteria

    9 Geographic Landscape

    • 9.1 Geographic segmentation
      • Exhibit 67: Chart on Market share by geography 2023-2028 (%)
      • Exhibit 68: Data Table on Market share by geography 2023-2028 (%)
    • 9.2 Geographic comparison
      • Exhibit 69: Chart on Geographic comparison
      • Exhibit 70: Data Table on Geographic comparison
    • 9.3 North America - Market size and forecast 2023-2028
      • Exhibit 71: Chart on North America - Market size and forecast 2023-2028 ($ billion)
      • Exhibit 72: Data Table on North America - Market size and forecast 2023-2028 ($ billion)
      • Exhibit 73: Chart on North America - Year-over-year growth 2023-2028 (%)
      • Exhibit 74: Data Table on North America - Year-over-year growth 2023-2028 (%)
    • 9.4 Europe - Market size and forecast 2023-2028
      • Exhibit 75: Chart on Europe - Market size and forecast 2023-2028 ($ billion)
      • Exhibit 76: Data Table on Europe - Market size and forecast 2023-2028 ($ billion)
      • Exhibit 77: Chart on Europe - Year-over-year growth 2023-2028 (%)
      • Exhibit 78: Data Table on Europe - Year-over-year growth 2023-2028 (%)
    • 9.5 APAC - Market size and forecast 2023-2028
      • Exhibit 79: Chart on APAC - Market size and forecast 2023-2028 ($ billion)
      • Exhibit 80: Data Table on APAC - Market size and forecast 2023-2028 ($ billion)
      • Exhibit 81: Chart on APAC - Year-over-year growth 2023-2028 (%)
      • Exhibit 82: Data Table on APAC - Year-over-year growth 2023-2028 (%)
    • 9.6 South America - Market size and forecast 2023-2028
      • Exhibit 83: Chart on South America - Market size and forecast 2023-2028 ($ billion)
      • Exhibit 84: Data Table on South America - Market size and forecast 2023-2028 ($ billion)
      • Exhibit 85: Chart on South America - Year-over-year growth 2023-2028 (%)
      • Exhibit 86: Data Table on South America - Year-over-year growth 2023-2028 (%)
    • 9.7 Middle East and Africa - Market size and forecast 2023-2028
      • Exhibit 87: Chart on Middle East and Africa - Market size and forecast 2023-2028 ($ billion)
      • Exhibit 88: Data Table on Middle East and Africa - Market size and forecast 2023-2028 ($ billion)
      • Exhibit 89: Chart on Middle East and Africa - Year-over-year growth 2023-2028 (%)
      • Exhibit 90: Data Table on Middle East and Africa - Year-over-year growth 2023-2028 (%)
    • 9.8 US - Market size and forecast 2023-2028
      • Exhibit 91: Chart on US - Market size and forecast 2023-2028 ($ billion)
      • Exhibit 92: Data Table on US - Market size and forecast 2023-2028 ($ billion)
      • Exhibit 93: Chart on US - Year-over-year growth 2023-2028 (%)
      • Exhibit 94: Data Table on US - Year-over-year growth 2023-2028 (%)
    • 9.9 China - Market size and forecast 2023-2028
      • Exhibit 95: Chart on China - Market size and forecast 2023-2028 ($ billion)
      • Exhibit 96: Data Table on China - Market size and forecast 2023-2028 ($ billion)
      • Exhibit 97: Chart on China - Year-over-year growth 2023-2028 (%)
      • Exhibit 98: Data Table on China - Year-over-year growth 2023-2028 (%)
    • 9.10 Canada - Market size and forecast 2023-2028
      • Exhibit 99: Chart on Canada - Market size and forecast 2023-2028 ($ billion)
      • Exhibit 100: Data Table on Canada - Market size and forecast 2023-2028 ($ billion)
      • Exhibit 101: Chart on Canada - Year-over-year growth 2023-2028 (%)
      • Exhibit 102: Data Table on Canada - Year-over-year growth 2023-2028 (%)
    • 9.11 UK - Market size and forecast 2023-2028
      • Exhibit 103: Chart on UK - Market size and forecast 2023-2028 ($ billion)
      • Exhibit 104: Data Table on UK - Market size and forecast 2023-2028 ($ billion)
      • Exhibit 105: Chart on UK - Year-over-year growth 2023-2028 (%)
      • Exhibit 106: Data Table on UK - Year-over-year growth 2023-2028 (%)
    • 9.12 Japan - Market size and forecast 2023-2028
      • Exhibit 107: Chart on Japan - Market size and forecast 2023-2028 ($ billion)
      • Exhibit 108: Data Table on Japan - Market size and forecast 2023-2028 ($ billion)
      • Exhibit 109: Chart on Japan - Year-over-year growth 2023-2028 (%)
      • Exhibit 110: Data Table on Japan - Year-over-year growth 2023-2028 (%)
    • 9.13 Market opportunity by geography
      • Exhibit 111: Market opportunity by geography ($ billion)
      • Exhibit 112: Data Tables on Market opportunity by geography ($ billion)

    10 Drivers, Challenges, and Trends

    • 10.1 Market drivers
      • 10.2 Market challenges
        • 10.3 Impact of drivers and challenges
          • Exhibit 113: Impact of drivers and challenges in 2023 and 2028
        • 10.4 Market trends

          11 Vendor Landscape

          • 11.1 Overview
            • 11.2 Vendor landscape
              • Exhibit 114: Overview on Criticality of inputs and Factors of differentiation
            • 11.3 Landscape disruption
              • Exhibit 115: Overview on factors of disruption
            • 11.4 Industry risks
              • Exhibit 116: Impact of key risks on business

            12 Vendor Analysis

            • 12.1 Vendors covered
              • Exhibit 117: Vendors covered
            • 12.2 Market positioning of vendors
              • Exhibit 118: Matrix on vendor position and classification
            • 12.3 Carrier Global Corp.
              • Exhibit 119: Carrier Global Corp. - Overview
              • Exhibit 120: Carrier Global Corp. - Business segments
              • Exhibit 121: Carrier Global Corp. - Key news
              • Exhibit 122: Carrier Global Corp. - Key offerings
              • Exhibit 123: Carrier Global Corp. - Segment focus
            • 12.4 Daikin Industries Ltd.
              • Exhibit 124: Daikin Industries Ltd. - Overview
              • Exhibit 125: Daikin Industries Ltd. - Business segments
              • Exhibit 126: Daikin Industries Ltd. - Key news
              • Exhibit 127: Daikin Industries Ltd. - Key offerings
              • Exhibit 128: Daikin Industries Ltd. - Segment focus
            • 12.5 Dais Corp.
              • Exhibit 129: Dais Corp. - Overview
              • Exhibit 130: Dais Corp. - Product / Service
              • Exhibit 131: Dais Corp. - Key offerings
            • 12.6 Fujitsu General Ltd.
              • Exhibit 132: Fujitsu General Ltd. - Overview
              • Exhibit 133: Fujitsu General Ltd. - Product / Service
              • Exhibit 134: Fujitsu General Ltd. - Key offerings
            • 12.7 Greenheck Fan Corp.
              • Exhibit 135: Greenheck Fan Corp. - Overview
              • Exhibit 136: Greenheck Fan Corp. - Product / Service
              • Exhibit 137: Greenheck Fan Corp. - Key offerings
            • 12.8 Johnson Controls International Plc
              • Exhibit 138: Johnson Controls International Plc - Overview
              • Exhibit 139: Johnson Controls International Plc - Business segments
              • Exhibit 140: Johnson Controls International Plc - Key news
              • Exhibit 141: Johnson Controls International Plc - Key offerings
              • Exhibit 142: Johnson Controls International Plc - Segment focus
            • 12.9 Lennox International Inc.
              • Exhibit 143: Lennox International Inc. - Overview
              • Exhibit 144: Lennox International Inc. - Business segments
              • Exhibit 145: Lennox International Inc. - Key news
              • Exhibit 146: Lennox International Inc. - Key offerings
              • Exhibit 147: Lennox International Inc. - Segment focus
            • 12.10 LG Electronics Inc.
              • Exhibit 148: LG Electronics Inc. - Overview
              • Exhibit 149: LG Electronics Inc. - Product / Service
              • Exhibit 150: LG Electronics Inc. - Key offerings
            • 12.11 Mitsubishi Electric Corp.
              • Exhibit 151: Mitsubishi Electric Corp. - Overview
              • Exhibit 152: Mitsubishi Electric Corp. - Business segments
              • Exhibit 153: Mitsubishi Electric Corp. - Key news
              • Exhibit 154: Mitsubishi Electric Corp. - Key offerings
              • Exhibit 155: Mitsubishi Electric Corp. - Segment focus
            • 12.12 Munters Group AB
              • Exhibit 156: Munters Group AB - Overview
              • Exhibit 157: Munters Group AB - Product / Service
              • Exhibit 158: Munters Group AB - Key offerings
            • 12.13 Nortek Air Solutions LLC
              • Exhibit 159: Nortek Air Solutions LLC - Overview
              • Exhibit 160: Nortek Air Solutions LLC - Product / Service
              • Exhibit 161: Nortek Air Solutions LLC - Key offerings
            • 12.14 Panasonic Holdings Corp.
              • Exhibit 162: Panasonic Holdings Corp. - Overview
              • Exhibit 163: Panasonic Holdings Corp. - Business segments
              • Exhibit 164: Panasonic Holdings Corp. - Key news
              • Exhibit 165: Panasonic Holdings Corp. - Key offerings
              • Exhibit 166: Panasonic Holdings Corp. - Segment focus
            • 12.15 S and P SISTEMAS DE VENTILACION S.L.U.
              • Exhibit 167: S and P SISTEMAS DE VENTILACION S.L.U. - Overview
              • Exhibit 168: S and P SISTEMAS DE VENTILACION S.L.U. - Product / Service
              • Exhibit 169: S and P SISTEMAS DE VENTILACION S.L.U. - Key offerings
            • 12.16 Trane Technologies plc
              • Exhibit 170: Trane Technologies plc - Overview
              • Exhibit 171: Trane Technologies plc - Business segments
              • Exhibit 172: Trane Technologies plc - Key offerings
              • Exhibit 173: Trane Technologies plc - Segment focus
            • 12.17 Zehnder Group AG
              • Exhibit 174: Zehnder Group AG - Overview
              • Exhibit 175: Zehnder Group AG - Business segments
              • Exhibit 176: Zehnder Group AG - Key offerings
              • Exhibit 177: Zehnder Group AG - Segment focus

            13 Appendix

            • 13.1 Scope of the report
              • 13.2 Inclusions and exclusions checklist
                • Exhibit 178: Inclusions checklist
                • Exhibit 179: Exclusions checklist
              • 13.3 Currency conversion rates for US$
                • Exhibit 180: Currency conversion rates for US$
              • 13.4 Research methodology
                • Exhibit 181: Research methodology
                • Exhibit 182: Validation techniques employed for market sizing
                • Exhibit 183: Information sources
              • 13.5 List of abbreviations
                • Exhibit 184: List of abbreviations

              Research Methodology

              Technavio presents a detailed picture of the market by way of study, synthesis, and summation of data from multiple sources. The analysts have presented the various facets of the market with a particular focus on identifying the key industry influencers. The data thus presented is comprehensive, reliable, and the result of extensive research, both primary and secondary.

              INFORMATION SOURCES

              Primary sources

              • Manufacturers and suppliers
              • Channel partners
              • Industry experts
              • Strategic decision makers

              Secondary sources

              • Industry journals and periodicals
              • Government data
              • Financial reports of key industry players
              • Historical data
              • Press releases

              DATA ANALYSIS

              Data Synthesis

              • Collation of data
              • Estimation of key figures
              • Analysis of derived insights

              Data Validation

              • Triangulation with data models
              • Reference against proprietary databases
              • Corroboration with industry experts

              REPORT WRITING

              Qualitative

              • Market drivers
              • Market challenges
              • Market trends
              • Five forces analysis

              Quantitative

              • Market size and forecast
              • Market segmentation
              • Geographical insights
              • Competitive landscape

              Interested in this report?

              Get your sample now to see our research methodology and insights!

              Download Now

              Frequently Asked Questions

              Heat and Energy Recovery Ventilation System market growth will increase by $ 1.77 bn during 2024-2028.

              The Heat and Energy Recovery Ventilation System market is expected to grow at a CAGR of 8.17% during 2024-2028.

              Heat and Energy Recovery Ventilation System market is segmented by Type( Ceiling-mounted, Wall-mounted, Cabinet-mounted) End-user( Commercial, Residential, Industrial)

              Airxchange Inc., Carrier Global Corp., Daikin Industries Ltd., Dais Corp., Fujitsu General Ltd., Greenheck Fan Corp., Johnson Controls International Plc, Lennox International Inc., LG Electronics Inc., Loren Cook Co., Mitsubishi Electric Corp., Munters Group AB, Nortek Air Solutions LLC, Ostberg Group AB, Panasonic Holdings Corp., Paschal Air Plumbing and Electric., S and P SISTEMAS DE VENTILACION S.L.U., Trane Technologies plc, Zehnder Group AG, KARYER Heat Transfer San. and Tic. Inc. are a few of the key vendors in the Heat and Energy Recovery Ventilation System market.

              North America will register the highest growth rate of 38% among the other regions. Therefore, the Heat and Energy Recovery Ventilation System market in North America is expected to garner significant business opportunities for the vendors during the forecast period.

              US, Canada, China, Japan, UK

              • Rising demand for heat and energy recovery ventilation system due to awareness of indoor air qualityThe global heat and energy recovery ventilation systems market is being driven by the growing recognition of the significance of clean indoor air quality. There is an increasing need for systems that offer both excellent air filtration and effective ventilation as people become more aware of the negative effects indoor air pollution has on their health. By recovering heat or energy from the exhausted interior air and bringing in fresh outdoor air is the driving factor this market.
              • the heat and energy recovery ventilation system presents a convincing alternative that lowers energy expenses. For example is the driving factor this market.
              • in highly polluted cities like Delhi is the driving factor this market.
              •  Beijing is the driving factor this market.
              • or Los Angeles is the driving factor this market.
              • these systems have become increasingly popular since they keep indoor air quality good by filtering out contaminants. Furthermore is the driving factor this market.
              • as indoor air quality rules and regulations become stricter is the driving factor this market.
              • there is an increasing need for heat and energy recovery ventilation systems from businesses is the driving factor this market.
              • institutions is the driving factor this market.
              • and homeowners who want to guarantee a more comfortable and healthy living and working environment. All these factors are expected to drive the global heat and energy recovery ventilation system market during the forecast period. is the driving factor this market.

              The Heat and Energy Recovery Ventilation System market vendors should focus on grabbing business opportunities from the Ceiling-mounted segment as it accounted for the largest market share in the base year.