North America Indoor Air Quality (IAQ) Solutions Market by Product and End-user - Forecast and Analysis 2024-2028

North America Indoor Air Quality (IAQ) Solutions Market by Product and End-user - Forecast and Analysis 2024-2028

Published: Apr 2024 151 Pages SKU: IRTNTR45565

Market Overview at a Glance

$4.52 B
Market Opportunity
7.77%
CAGR
6.55
YoY growth 2023-2024(%)

North America Indoor Air Quality Solutions Market Size 2024-2028 

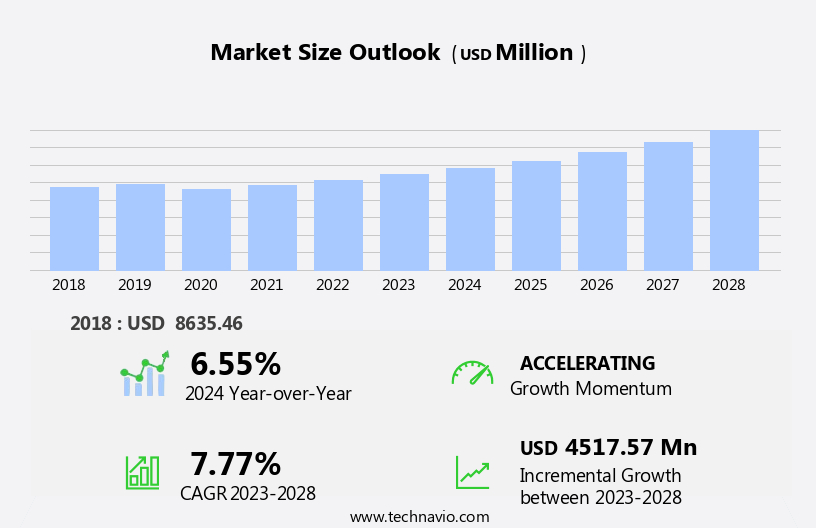
North America Indoor Air Quality Solutions market size is forecast to increase by USD 4.52 billion, at a CAGR of 7.77% between 2023 and 2028.

  • The market is driven by heightened concerns over indoor air quality, which poses significant health risks and negatively impacts productivity. This concern is further fueled by increasing awareness of the connection between indoor air quality and various health issues, such as respiratory diseases and allergies. Technological advancements in indoor air quality solutions offer opportunities for market growth, with innovations in smart sensors, filtration systems, and automation enabling more effective and efficient solutions. However, the long product lifecycle of indoor air quality solutions poses a challenge, as upgrading or replacing systems can be costly and time-consuming.
  • Companies seeking to capitalize on market opportunities must focus on offering cost-effective, technologically advanced solutions that cater to the evolving needs of consumers and businesses. Additionally, addressing the challenge of long product lifecycles through flexible financing options, extended warranties, and upgradability features can help maintain a competitive edge.

What will be the size of the North America Indoor Air Quality Solutions Market during the forecast period?

Indoor Air Quality Solutions Market in North America Size

Explore in-depth regional segment analysis with market size data - historical 2018-2022 and forecasts 2024-2028 - in the full report.  
 Request Free Sample

  • The indoor air quality (IAQ) solutions market in North America is witnessing significant growth due to heightened awareness of health and wellbeing, as well as the need for virus mitigation in the wake of the global pandemic. Air quality consulting firms are in high demand, providing expertise in engineering solutions such as electrostatic precipitators, carbon filters, and air ionizers. Pet allergens and airborne pathogens are major concerns, leading to a surge in demand for air quality certification and training. Customer satisfaction is paramount, driving the adoption of real-time monitoring systems and building automation for optimal air exchange rates.
  • Air quality research continues to uncover new challenges, including lead paint and dust mites, necessitating ongoing innovation in IAQ technology. Ozone generators and activated carbon filters are effective in controlling various pollutants, while health-conscious businesses prioritize employee productivity and airborne pathogen control. Air quality software enables comprehensive IAQ management, ensuring regulatory compliance and continuous improvement.

How is this market segmented?

The market research report provides comprehensive data (region-wise segment analysis), with forecasts and estimates in "USD million" for the period 2024-2028, as well as historical data from 2018-2022 for the following segments.

  • Product
    • Equipment
    • Services
  • End-user
    • Commercial
    • Residential
  • Geography
    • North America
      • US
      • Canada
      • Mexico

By Product Insights

The equipment segment is estimated to witness significant growth during the forecast period.

Indoor air quality is a significant factor in promoting health and well-being, necessitating regular testing for allergens, CO2 emissions, radon, and volatile organic compounds (VOCs) from electronic devices. Air monitoring sensors, HVAC equipment, and air conditioners are the primary types of equipment employed in indoor air quality solutions. The North American market for indoor air quality solutions, specifically equipment, is poised for substantial growth. This expansion is driven by the increasing demand for cost-effective, smart air monitoring sensors. Green building practices, building codes, and energy efficiency regulations are also influential in the market's evolution. Advanced technologies such as UV-C light technology, HVAC system optimization, and air filtration systems are becoming increasingly popular.

Commercial applications, including office buildings, schools and universities, and healthcare facilities, are significant markets for indoor air quality solutions. Residential applications, data centers, hotels and restaurants, retail stores, and manufacturing facilities also contribute to the market's growth. Maintenance and service, data analytics, and remote monitoring are essential aspects of the market, ensuring building performance and air quality management. Ashrae standards and HEPA filters are integral to the industry's best practices.

Indoor Air Quality Solutions Market in North America Size

Download Free Sample Report

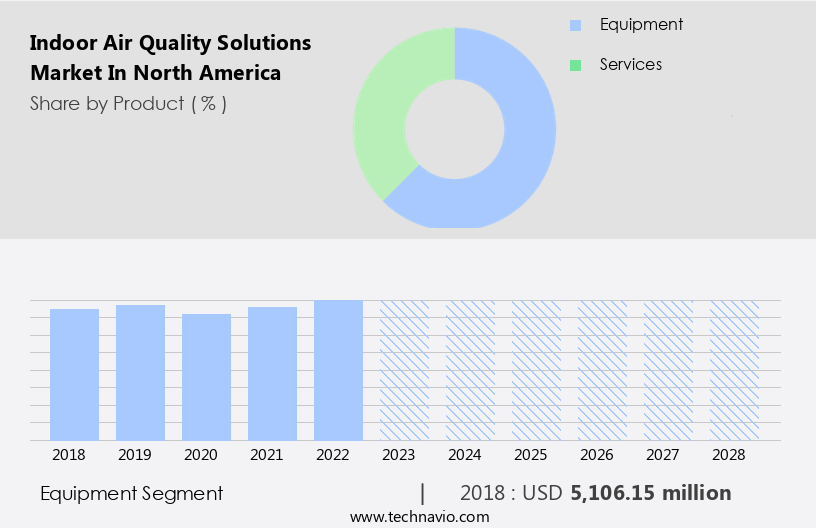
The Equipment segment was valued at  USD 5106.15 million in 2018 and showed a gradual increase during the forecast period.

Market Dynamics

Our researchers analyzed the data with 2023 as the base year, along with the key drivers, trends, and challenges. A holistic analysis of drivers will help companies refine their marketing strategies to gain a competitive advantage.

What are the North America Indoor Air Quality Solutions Market market drivers leading to the rise in adoption of the Industry?

  • Concerns over indoor air quality have significantly driven market growth, as increasing awareness and regulations emphasize the importance of maintaining healthy living environments. 
  • Air quality concerns have grown significantly in North America due to the increase in urbanization, industrialization, and vehicular emissions. This issue poses health risks such as headaches, lung cancer, heart problems, strokes, and respiratory diseases, including asthma. The deterioration of air quality is a major challenge for both authorities and citizens. Air filtration systems, HVAC systems, and data analytics are essential components of air quality control. HEPA filters and remote monitoring are crucial technologies for maintaining optimal air quality. Air quality standards, such as those set by ASHRAE, provide guidelines for maintaining healthy indoor environments.
  • The integration of air quality control technologies, including air filtration and HVAC systems, with data analytics and remote monitoring, offers enhanced capabilities for maintaining optimal indoor air quality. These solutions are essential for retail stores and manufacturing facilities to ensure the health and safety of their employees and customers.

What are the North America Indoor Air Quality Solutions Market market trends shaping the Industry?

  • Indoor air quality solutions are experiencing significant technological advancements, making it a noteworthy market trend. Professionals in this field are continually innovating to improve air quality and create healthier living spaces.
  • Indoor air quality is a critical aspect of building design and management, with a focus on life cycle analysis and energy efficiency. In North America, the market for indoor air quality solutions is evolving, driven by the integration of advanced technologies. Computational fluid dynamics and ventilation systems with air quality sensors are becoming increasingly popular. These systems enable real-time monitoring and responsive management of indoor air quality, addressing concerns related to carbon dioxide (CO2) levels and other pollutants. Building codes and green building practices are also promoting the adoption of these technologies in office buildings, schools, and universities. Innovative technologies, such as computerized simulation and micro-engineered machines, are expected to play a significant role in the future.
  • Detecting indoor air pollutants, which are often colorless and odorless, remains a challenge. New technologies are being developed to enhance the detection capabilities of indoor air quality systems, ensuring a healthier and more productive indoor environment.

How does North America Indoor Air Quality Solutions Market market faces challenges face during its growth?

  • The prolonged product lifecycle of indoor air quality solutions poses a significant challenge to the industry's growth trajectory. This issue, which is mandatory for industry professionals to acknowledge, can hinder advancements and innovation in the sector. 
  • Indoor air quality solutions from leading market participants, including 3M Company, Camfil AB, Daikin Industries Ltd., and Lennox International Inc., are renowned for their dependability and superior quality. These solutions are engineered using robust materials, such as hard metals, which ensure a lengthy replacement cycle. However, appliances that come into frequent contact with humid environments during cleaning and maintenance may succumb to rusting. To mitigate this risk, companies employ the use of stainless steel or high-grade plastic materials in manufacturing, resulting in lightweight yet durable indoor air quality solutions. Furthermore, these companies invest heavily in research and development to introduce innovative and long-lasting materials, thereby enhancing the operational lifespan of their products.
  • In the realm of indoor air quality management, air quality testing and improvement are essential aspects. Smart home integration, particle removal, system optimization, and volatile organic compound (VOC) removal are key focus areas for these solutions. Commercial applications, such as offices, schools, and healthcare facilities, require stringent air quality management to ensure optimal building performance. By providing advanced indoor air quality solutions, companies cater to the growing demand for healthier and more efficient indoor environments.

Exclusive North America Indoor Air Quality Solutions Market Customer Landscape

The market forecasting report includes the adoption lifecycle of the market, covering from the innovator's stage to the laggard's stage. It focuses on adoption rates in different regions based on penetration. Furthermore, the report also includes key purchase criteria and drivers of price sensitivity to help companies evaluate and develop their market growth analysis strategies.
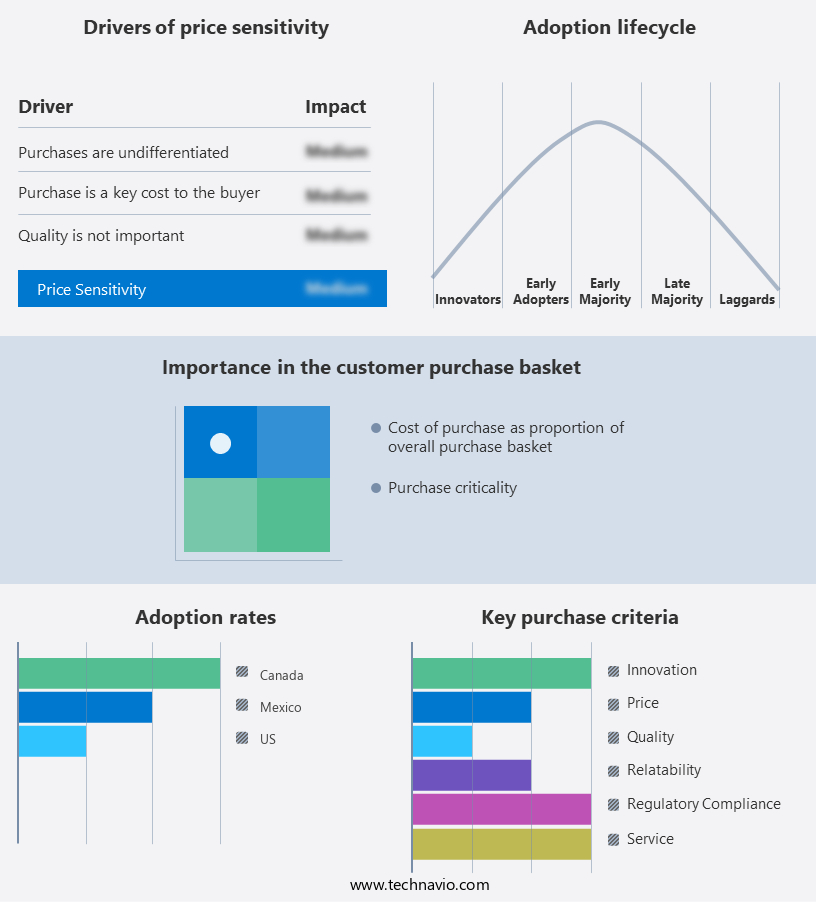
Indoor Air Quality Solutions Market in North America Share by Geography

 Customer Landscape

Key Companies & Market Insights

Companies are implementing various strategies, such as strategic alliances, market forecast partnerships, mergers and acquisitions, geographical expansion, and product/service launches, to enhance their presence in the market.

The market research and growth report includes detailed analyses of the competitive landscape of the market and information about key companies, including:

  • 3M Co.
  • Aeroqual Ltd.
  • Camfil AB
  • Carrier Global Corp.
  • ClimateCare
  • Daikin Industries Ltd.
  • Ferguson plc
  • Honeywell International Inc.
  • Ingersoll Rand Inc.
  • Johnson Controls
  • Lennox International Inc.
  • LG Electronics Inc.
  • MANN HUMMEL International GmbH and Co. KG
  • Nortek
  • Panasonic Holdings Corp.
  • QLEANAIR SCANDINAVIA AB
  • RGF Environmental Group Inc.
  • SGS SA
  • TSI Inc.
  • uHoo Ltd.
  • UL Solutions Inc.

Qualitative and quantitative analysis of companies has been conducted to help clients understand the wider business environment as well as the strengths and weaknesses of key market players. Data is qualitatively analyzed to categorize companies as pure play, category-focused, industry-focused, and diversified; it is quantitatively analyzed to categorize companies as dominant, leading, strong, tentative, and weak.

Recent Development and News in Indoor Air Quality Solutions Market In North America

  • In February 2023, Carrier Global Corporation, a leading heating, ventilating, and air conditioning (HVAC) manufacturer, introduced its new line of Healthy Buildings solutions, which includes advanced indoor air quality (IAQ) technologies. This expansion is aimed at addressing the growing demand for improved IAQ in commercial and residential buildings (Carrier, 2023).
  • In April 2024, Honeywell International Inc. Announced a strategic partnership with Amazon Web Services (AWS) to develop cloud-based IAQ solutions. This collaboration combines Honeywell's expertise in IAQ technologies with AWS's advanced data analytics capabilities, aiming to create more efficient and effective IAQ monitoring and management systems (Honeywell, 2024).
  • In June 2024, Daikin Industries, a major HVAC manufacturer, completed the acquisition of Air Quality Systems, a leading IAQ solutions provider in North America. This acquisition will enable Daikin to expand its product offerings and strengthen its presence in the North American market (Daikin, 2024).
  • In September 2025, the United States Environmental Protection Agency (EPA) introduced new regulations on indoor air quality standards for commercial buildings. These regulations require regular monitoring and reporting of IAQ metrics, setting a new benchmark for building owners and managers to prioritize IAQ and ensure healthier environments for occupants (EPA, 2025).

Research Analyst Overview

Indoor air quality (IAQ) solutions continue to gain significance in North America as the importance of maintaining healthy and energy-efficient built environments becomes increasingly recognized. The market for IAQ technologies is characterized by continuous evolution, with applications spanning various sectors. Life cycle analysis plays a crucial role in evaluating the environmental impact of IAQ systems, while energy efficiency remains a key consideration for building owners and operators. Ventilation systems, a cornerstone of IAQ, are being optimized through advanced design and smart integration with air quality sensors. Building codes and green building practices mandate stringent IAQ standards, driving demand for innovative solutions.

Carbon dioxide (CO2) levels, a critical IAQ parameter, are being closely monitored in office buildings, schools, and universities to ensure optimal learning and working conditions. Air quality testing and improvement are essential for maintaining healthy indoor environments in residential and commercial applications. Smart home integration, particle removal, system optimization, and volatile organic compound (VOC) removal are some of the emerging trends in IAQ solutions. IAQ management is a priority for data centers, hotels and restaurants, healthcare facilities, retail stores, and manufacturing facilities, as they strive to minimize their carbon footprint and ensure occupant comfort and health. Maintenance and service are essential components of IAQ systems, ensuring their longevity and optimal performance.

UV-C light technology, HVAC systems, data analytics, air filtration, remote monitoring, and Ashrae standards are some of the tools and frameworks that are shaping the future of IAQ solutions. The ongoing unfolding of market activities and evolving patterns underscore the importance of staying informed and adaptive in this dynamic market.

Dive into Technavio's robust research methodology, blending expert interviews, extensive data synthesis, and validated models for unparalleled Indoor Air Quality Solutions Market in North America insights. See full methodology.

Market Scope

Report Coverage

Details

Page number

151

Base year

2023

Historic period

2018-2022

Forecast period

2024-2028

Growth momentum & CAGR

Accelerate at a CAGR of 7.77%

Market growth 2024-2028

USD 4517.57 million

Market structure

Concentrated

YoY growth 2023-2024(%)

6.55

Competitive landscape

Leading Companies, Market Positioning of Companies, Competitive Strategies, and Industry Risks

Request Free Sample

What are the Key Data Covered in this Market Research Report?

  • CAGR of the market during the forecast period
  • Detailed information on factors that will drive the market growth and forecasting between 2024 and 2028
  • Precise estimation of the size of the market  and its contribution of the market in focus to the parent market
  • Accurate predictions about upcoming market growth and trends and changes in consumer behaviour
  • Growth of the market across North America
  • Thorough analysis of the market's competitive landscape and detailed information about companies
  • Comprehensive analysis of factors that will challenge the growth of market companies

We can help! Our analysts can customize this market research report to meet your requirements Get in touch

1 Executive Summary

  • 1.1 Market overview
    • Exhibit 01: Executive Summary – Chart on Market Overview
    • Exhibit 02: Executive Summary – Data Table on Market Overview
    • Exhibit 03: Executive Summary – Chart on Country Market Characteristics
    • Exhibit 04: Executive Summary – Chart on Market by Geography
    • Exhibit 05: Executive Summary – Chart on Market Segmentation by Product
    • Exhibit 06: Executive Summary – Chart on Market Segmentation by End-user
    • Exhibit 07: Executive Summary – Chart on Incremental Growth
    • Exhibit 08: Executive Summary – Data Table on Incremental Growth
    • Exhibit 09: Executive Summary – Chart on Vendor Market Positioning

2 Market Landscape

  • 2.1 Market ecosystem
    • Exhibit 10: Parent market
    • Exhibit 11: Market Characteristics

3 Market Sizing

  • 3.1 Market definition
    • Exhibit 12: Offerings of vendors included in the market definition
  • 3.2 Market segment analysis
    • Exhibit 13: Market segments
  • 3.3 Market size 2023
    • 3.4 Market outlook: Forecast for 2023-2028
      • Exhibit 14: Chart on North America - Market size and forecast 2023-2028 ($ million)
      • Exhibit 15: Data Table on Regional - Market size and forecast 2023-2028 ($ million)
      • Exhibit 16: Chart on North America: Year-over-year growth 2023-2028 (%)
      • Exhibit 17: Data Table on Regional - Market size and forecast 2023-2028 ($ million)

    4 Historic Market Size

    • 4.1 Indoor air quality solutions market in North America 2018 - 2022
      • Exhibit 18: Historic Market Size – Data Table on indoor air quality solutions market in north America 2018 - 2022 ($ million)
    • 4.2 Product Segment Analysis 2018 - 2022
      • Exhibit 19: Historic Market Size – Product Segment 2018 - 2022 ($ million)
    • 4.3 End-user Segment Analysis 2018 - 2022
      • Exhibit 20: Historic Market Size – End-user Segment 2018 - 2022 ($ million)
    • 4.4 Geography Segment Analysis 2018 - 2022
      • Exhibit 21: Historic Market Size – Geography Segment 2018 - 2022 ($ million)

    5 Five Forces Analysis

    • 5.1 Five forces summary
      • Exhibit 22: Five forces analysis - Comparison between 2023 and 2028
    • 5.2 Bargaining power of buyers
      • Exhibit 23: Chart on Bargaining power of buyers – Impact of key factors 2023 and 2028
    • 5.3 Bargaining power of suppliers
      • Exhibit 24: Bargaining power of suppliers – Impact of key factors in 2023 and 2028
    • 5.4 Threat of new entrants
      • Exhibit 25: Threat of new entrants – Impact of key factors in 2023 and 2028
    • 5.5 Threat of substitutes
      • Exhibit 26: Threat of substitutes – Impact of key factors in 2023 and 2028
    • 5.6 Threat of rivalry
      • Exhibit 27: Threat of rivalry – Impact of key factors in 2023 and 2028
    • 5.7 Market condition
      • Exhibit 28: Chart on Market condition - Five forces 2023 and 2028

    6 Market Segmentation by Product

    • 6.1 Market segments
      • Exhibit 29: Chart on Product - Market share 2023-2028 (%)
      • Exhibit 30: Data Table on Product - Market share 2023-2028 (%)
    • 6.2 Comparison by Product
      • Exhibit 31: Chart on Comparison by Product
      • Exhibit 32: Data Table on Comparison by Product
    • 6.3 Equipment - Market size and forecast 2023-2028
      • Exhibit 33: Chart on Equipment - Market size and forecast 2023-2028 ($ million)
      • Exhibit 34: Data Table on Equipment - Market size and forecast 2023-2028 ($ million)
      • Exhibit 35: Chart on Equipment - Year-over-year growth 2023-2028 (%)
      • Exhibit 36: Data Table on Equipment - Year-over-year growth 2023-2028 (%)
    • 6.4 Services - Market size and forecast 2023-2028
      • Exhibit 37: Chart on Services - Market size and forecast 2023-2028 ($ million)
      • Exhibit 38: Data Table on Services - Market size and forecast 2023-2028 ($ million)
      • Exhibit 39: Chart on Services - Year-over-year growth 2023-2028 (%)
      • Exhibit 40: Data Table on Services - Year-over-year growth 2023-2028 (%)
    • 6.5 Market opportunity by Product
      • Exhibit 41: Market opportunity by Product ($ million)
      • Exhibit 42: Data Table on Market opportunity by Product ($ million)

    7 Market Segmentation by End-user

    • 7.1 Market segments
      • Exhibit 43: Chart on End-user - Market share 2023-2028 (%)
      • Exhibit 44: Data Table on End-user - Market share 2023-2028 (%)
    • 7.2 Comparison by End-user
      • Exhibit 45: Chart on Comparison by End-user
      • Exhibit 46: Data Table on Comparison by End-user
    • 7.3 Commercial - Market size and forecast 2023-2028
      • Exhibit 47: Chart on Commercial - Market size and forecast 2023-2028 ($ million)
      • Exhibit 48: Data Table on Commercial - Market size and forecast 2023-2028 ($ million)
      • Exhibit 49: Chart on Commercial - Year-over-year growth 2023-2028 (%)
      • Exhibit 50: Data Table on Commercial - Year-over-year growth 2023-2028 (%)
    • 7.4 Residential - Market size and forecast 2023-2028
      • Exhibit 51: Chart on Residential - Market size and forecast 2023-2028 ($ million)
      • Exhibit 52: Data Table on Residential - Market size and forecast 2023-2028 ($ million)
      • Exhibit 53: Chart on Residential - Year-over-year growth 2023-2028 (%)
      • Exhibit 54: Data Table on Residential - Year-over-year growth 2023-2028 (%)
    • 7.5 Market opportunity by End-user
      • Exhibit 55: Market opportunity by End-user ($ million)
      • Exhibit 56: Data Table on Market opportunity by End-user ($ million)

    8 Customer Landscape

    • 8.1 Customer landscape overview
      • Exhibit 57: Analysis of price sensitivity, lifecycle, customer purchase basket, adoption rates, and purchase criteria

    9 Geographic Landscape

    • 9.1 Geographic segmentation
      • Exhibit 58: Chart on Market share by geography - 2023-2028 (%)
      • Exhibit 59: Data Table on Market share by geography - 2023-2028 (%)
    • 9.2 Geographic comparison
      • Exhibit 60: Chart on Geographic comparison
      • Exhibit 61: Data Table on Geographic comparison
    • 9.3 US - Market size and forecast 2023-2028
      • Exhibit 62: Chart on US - Market size and forecast 2023-2028 ($ million)
      • Exhibit 63: Data Table on US - Market size and forecast 2023-2028 ($ million)
      • Exhibit 64: Chart on US - Year-over-year growth 2023-2028 (%)
      • Exhibit 65: Data Table on US - Year-over-year growth 2023-2028 (%)
    • 9.4 Canada - Market size and forecast 2023-2028
      • Exhibit 66: Chart on Canada - Market size and forecast 2023-2028 ($ million)
      • Exhibit 67: Data Table on Canada - Market size and forecast 2023-2028 ($ million)
      • Exhibit 68: Chart on Canada - Year-over-year growth 2023-2028 (%)
      • Exhibit 69: Data Table on Canada - Year-over-year growth 2023-2028 (%)
    • 9.5 Mexico - Market size and forecast 2023-2028
      • Exhibit 70: Chart on Mexico - Market size and forecast 2023-2028 ($ million)
      • Exhibit 71: Data Table on Mexico - Market size and forecast 2023-2028 ($ million)
      • Exhibit 72: Chart on Mexico - Year-over-year growth 2023-2028 (%)
      • Exhibit 73: Data Table on Mexico - Year-over-year growth 2023-2028 (%)
    • 9.6 Market opportunity by geography
      • Exhibit 74: Market opportunity by geography ($ million)
      • Exhibit 75: Data Table on Market opportunity by geography ($ million)

    10 Drivers, Challenges, and Trends

    • 10.1 Market drivers
      • 10.2 Market challenges
        • 10.3 Impact of drivers and challenges
          • Exhibit 76: Impact of drivers and challenges in 2023 and 2028
        • 10.4 Market trends

          11 Vendor Landscape

          • 11.1 Overview
            • 11.2 Vendor landscape
              • Exhibit 77: Overview on Criticality of inputs and Factors of differentiation
            • 11.3 Landscape disruption
              • Exhibit 78: Overview on factors of disruption
            • 11.4 Industry risks
              • Exhibit 79: Impact of key risks on business

            12 Vendor Analysis

            • 12.1 Vendors covered
              • Exhibit 80: Vendors covered
            • 12.2 Market positioning of vendors
              • Exhibit 81: Matrix on vendor position and classification
            • 12.3 3M Co.
              • Exhibit 82: 3M Co. - Overview
              • Exhibit 83: 3M Co. - Business segments
              • Exhibit 84: 3M Co. - Key news
              • Exhibit 85: 3M Co. - Key offerings
              • Exhibit 86: 3M Co. - Segment focus
            • 12.4 Aeroqual Ltd.
              • Exhibit 87: Aeroqual Ltd. - Overview
              • Exhibit 88: Aeroqual Ltd. - Product / Service
              • Exhibit 89: Aeroqual Ltd. - Key offerings
            • 12.5 Camfil AB
              • Exhibit 90: Camfil AB - Overview
              • Exhibit 91: Camfil AB - Product / Service
              • Exhibit 92: Camfil AB - Key offerings
            • 12.6 Carrier Global Corp.
              • Exhibit 93: Carrier Global Corp. - Overview
              • Exhibit 94: Carrier Global Corp. - Business segments
              • Exhibit 95: Carrier Global Corp. - Key news
              • Exhibit 96: Carrier Global Corp. - Key offerings
              • Exhibit 97: Carrier Global Corp. - Segment focus
            • 12.7 Daikin Industries Ltd.
              • Exhibit 98: Daikin Industries Ltd. - Overview
              • Exhibit 99: Daikin Industries Ltd. - Business segments
              • Exhibit 100: Daikin Industries Ltd. - Key offerings
              • Exhibit 101: Daikin Industries Ltd. - Segment focus
            • 12.8 Honeywell International Inc.
              • Exhibit 102: Honeywell International Inc. - Overview
              • Exhibit 103: Honeywell International Inc. - Business segments
              • Exhibit 104: Honeywell International Inc. - Key news
              • Exhibit 105: Honeywell International Inc. - Key offerings
              • Exhibit 106: Honeywell International Inc. - Segment focus
            • 12.9 Ingersoll Rand Inc.
              • Exhibit 107: Ingersoll Rand Inc. - Overview
              • Exhibit 108: Ingersoll Rand Inc. - Business segments
              • Exhibit 109: Ingersoll Rand Inc. - Key offerings
              • Exhibit 110: Ingersoll Rand Inc. - Segment focus
            • 12.10 Johnson Controls
              • Exhibit 111: Johnson Controls - Overview
              • Exhibit 112: Johnson Controls - Business segments
              • Exhibit 113: Johnson Controls - Key news
              • Exhibit 114: Johnson Controls - Key offerings
              • Exhibit 115: Johnson Controls - Segment focus
            • 12.11 LG Electronics Inc.
              • Exhibit 116: LG Electronics Inc. - Overview
              • Exhibit 117: LG Electronics Inc. - Product / Service
              • Exhibit 118: LG Electronics Inc. - Key offerings
            • 12.12 MANN HUMMEL International GmbH and Co. KG
              • Exhibit 119: MANN HUMMEL International GmbH and Co. KG - Overview
              • Exhibit 120: MANN HUMMEL International GmbH and Co. KG - Business segments
              • Exhibit 121: MANN HUMMEL International GmbH and Co. KG - Key offerings
              • Exhibit 122: MANN HUMMEL International GmbH and Co. KG - Segment focus
            • 12.13 Nortek
              • Exhibit 123: Nortek - Overview
              • Exhibit 124: Nortek - Product / Service
              • Exhibit 125: Nortek - Key offerings
            • 12.14 Panasonic Holdings Corp.
              • Exhibit 126: Panasonic Holdings Corp. - Overview
              • Exhibit 127: Panasonic Holdings Corp. - Product / Service
              • Exhibit 128: Panasonic Holdings Corp. - Key news
              • Exhibit 129: Panasonic Holdings Corp. - Key offerings
            • 12.15 RGF Environmental Group Inc.
              • Exhibit 130: RGF Environmental Group Inc. - Overview
              • Exhibit 131: RGF Environmental Group Inc. - Product / Service
              • Exhibit 132: RGF Environmental Group Inc. - Key offerings
            • 12.16 SGS SA
              • Exhibit 133: SGS SA - Overview
              • Exhibit 134: SGS SA - Business segments
              • Exhibit 135: SGS SA - Key offerings
              • Exhibit 136: SGS SA - Segment focus
            • 12.17 UL Solutions Inc.
              • Exhibit 137: UL Solutions Inc. - Overview
              • Exhibit 138: UL Solutions Inc. - Product / Service
              • Exhibit 139: UL Solutions Inc. - Key offerings

            13 Appendix

            • 13.1 Scope of the report
              • 13.2 Inclusions and exclusions checklist
                • Exhibit 140: Inclusions checklist
                • Exhibit 141: Exclusions checklist
              • 13.3 Currency conversion rates for US$
                • Exhibit 142: Currency conversion rates for US$
              • 13.4 Research methodology
                • Exhibit 143: Research methodology
                • Exhibit 144: Validation techniques employed for market sizing
                • Exhibit 145: Information sources
              • 13.5 List of abbreviations
                • Exhibit 146: List of abbreviations

              Research Methodology

              Technavio presents a detailed picture of the market by way of study, synthesis, and summation of data from multiple sources. The analysts have presented the various facets of the market with a particular focus on identifying the key industry influencers. The data thus presented is comprehensive, reliable, and the result of extensive research, both primary and secondary.

              INFORMATION SOURCES

              Primary sources

              • Manufacturers and suppliers
              • Channel partners
              • Industry experts
              • Strategic decision makers

              Secondary sources

              • Industry journals and periodicals
              • Government data
              • Financial reports of key industry players
              • Historical data
              • Press releases

              DATA ANALYSIS

              Data Synthesis

              • Collation of data
              • Estimation of key figures
              • Analysis of derived insights

              Data Validation

              • Triangulation with data models
              • Reference against proprietary databases
              • Corroboration with industry experts

              REPORT WRITING

              Qualitative

              • Market drivers
              • Market challenges
              • Market trends
              • Five forces analysis

              Quantitative

              • Market size and forecast
              • Market segmentation
              • Geographical insights
              • Competitive landscape

              Interested in this report?

              Get your sample now to see our research methodology and insights!

              Download Now

              Frequently Asked Questions

              Indoor Air Quality Solutionsin North America market growth will increase by $ 4517.57 mn during 2024-2028.

              The Indoor Air Quality Solutionsin North America market is expected to grow at a CAGR of 7.77% during 2024-2028.

              Indoor Air Quality Solutionsin North America market is segmented by Product( Equipment, Services) End-user( Commercial, Residential)

              3M Co., Aeroqual Ltd., Camfil AB, Carrier Global Corp., ClimateCare, Daikin Industries Ltd., Ferguson plc, Honeywell International Inc., Ingersoll Rand Inc., Johnson Controls, Lennox International Inc., LG Electronics Inc., MANN HUMMEL International GmbH and Co. KG, Nortek, Panasonic Holdings Corp., QLEANAIR SCANDINAVIA AB, RGF Environmental Group Inc., SGS SA, TSI Inc., uHoo Ltd., UL Solutions Inc. are a few of the key vendors in the Indoor Air Quality Solutionsin North America market.

              North America will register the highest growth rate of 100% among the other regions. Therefore, the Indoor Air Quality Solutionsin North America market in North America is expected to garner significant business opportunities for the vendors during the forecast period.

              US, Canada, Mexico

              • Increased concerns over indoor air qualityAir quality across the world is the driving factor this market.
              • including North America is the driving factor this market.
              • has declined over the years is the driving factor this market.
              • which has exposed people to various health issues is the driving factor this market.
              • including frequent headaches is the driving factor this market.
              • lung cancer is the driving factor this market.
              • heart problems is the driving factor this market.
              • strokes is the driving factor this market.
              • and chronic and acute respiratory diseases is the driving factor this market.
              • such as asthma. Air pollution is linked to health problems that can lead to death. The control of the air quality across North America is still a big challenge for both authorities and citizens. The rapid increase in urbanization is the driving factor this market.
              • industrialization is the driving factor this market.
              • and pollution due to vehicular emissions are some of the major factors leading to the deterioration of air quality. There have been several disastrous incidents of air pollution reported in many countries over the years. As a result is the driving factor this market.
              • there is a rise in concerns over the quality of indoor air in households. The significant presence of VOCs is the driving factor this market.
              • smoke is the driving factor this market.
              • and pollen has an adverse impact on the quality of indoor air. The number of air pollution-related incidents is rising every year across the globe is the driving factor this market.
              • leading to several thousands of deaths. For instance is the driving factor this market.
              • in the US is the driving factor this market.
              • air pollution causes the deaths of approximately 90 is the driving factor this market.
              • 000- 360 is the driving factor this market.
              • 000 people every year. Such incidents are increasing awareness among the population about the impact of indoor air pollution. The presence of hazardous pollutants (PM 2.5 and PM 10) in indoor areas has raised concerns among people over the health problems associated with inhaling polluted air. Owing to these factors is the driving factor this market.
              • the indoor air quality solutions market in North America is expected to grow during the forecast period. is the driving factor this market.

              The Indoor Air Quality Solutionsin North America market vendors should focus on grabbing business opportunities from the Equipment segment as it accounted for the largest market share in the base year.
              RIA - Research AI Assistant
              Ask RIA