
US Hedge Fund Market Size 2026-2030
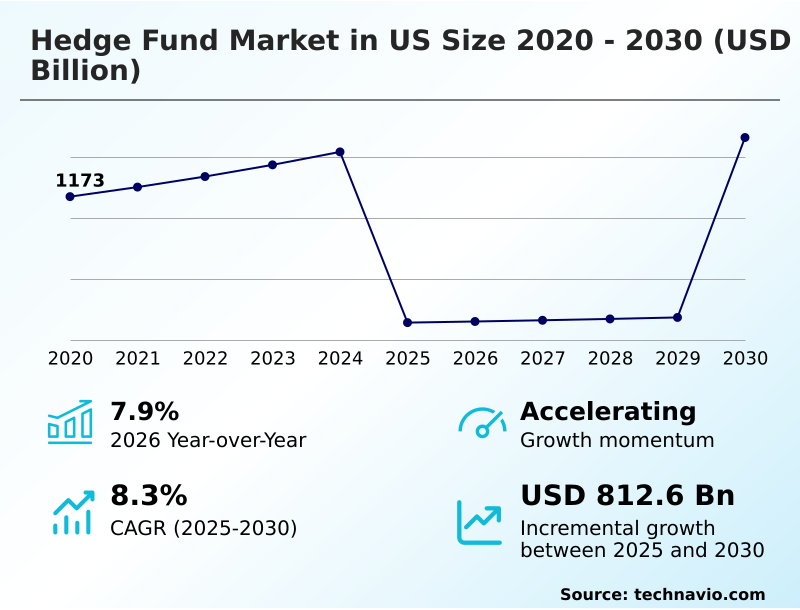
The us hedge fund market size is valued to increase by USD 812.6 billion, at a CAGR of 8.3% from 2025 to 2030. Integration of AI and ML into core investment processes will drive the us hedge fund market.
Major Market Trends & Insights
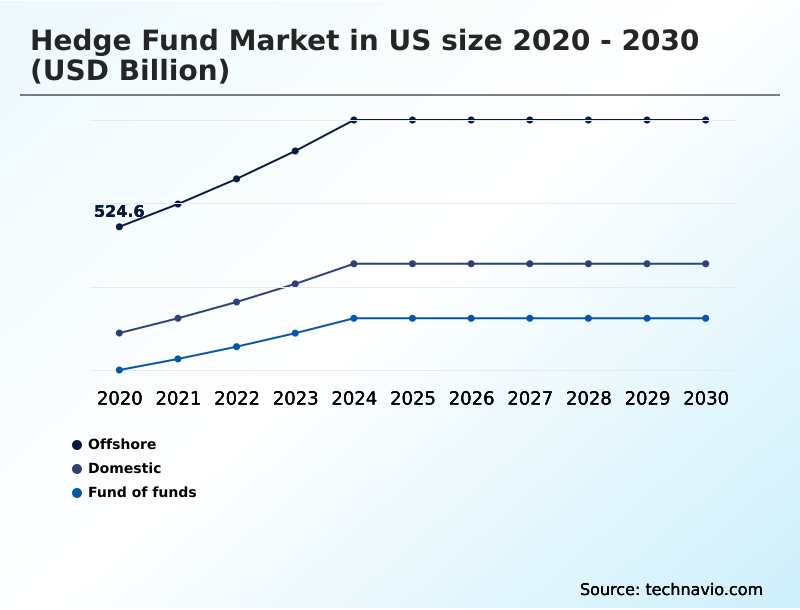
- By Type - Offshore segment was valued at USD 696.2 billion in 2024
- By Method - Long and short equity segment accounted for the largest market revenue share in 2024
Market Size & Forecast
- Market Opportunities: USD 1296.3 billion
- Market Future Opportunities: USD 812.6 billion
- CAGR from 2025 to 2030 : 8.3%
Market Summary
- The hedge fund market in US is undergoing a significant transformation, driven by the institutional demand for uncorrelated returns and the pervasive integration of advanced technology. Firms are increasingly leveraging predictive analytics and machine learning not just for alpha generation, but also for sophisticated risk management and enhancing operational efficiency.
- For instance, a manager might deploy an AI-driven model to analyze vast sets of alternative data, such as satellite imagery or supply chain logs, to forecast commodity price movements, a task that is beyond the scope of traditional fundamental analysis.
- This technological arms race is occurring alongside a structural shift toward large multi-strategy platforms, which offer institutional investments diversified asset allocation across strategies like private credit and global macro. However, this evolution is tempered by significant challenges, including mounting compliance burdens from heightened regulatory complexity and persistent market volatility.
- The ability to navigate these dynamics, manage fee structures effectively, and attract top data science talent has become critical for sustaining a competitive advantage in this sophisticated financial ecosystem.
What will be the Size of the US Hedge Fund Market during the forecast period?
Get Key Insights on Market Forecast (PDF) Get Free Sample
How is the US Hedge Fund Market Segmented?
The us hedge fund industry research report provides comprehensive data (region-wise segment analysis), with forecasts and estimates in "USD billion" for the period 2026-2030, as well as historical data from 2020-2024 for the following segments.
- Type
- Offshore
- Domestic
- Fund of funds
- Method
- Long and short equity
- Event driven
- Global macro
- Others
- End-user
- Institutional
- Individual
- Geography
- North America
- US
- North America
By Type Insights
The offshore segment is estimated to witness significant growth during the forecast period.
The offshore segment is a vital component for alternative investment, facilitating tax neutrality for certain domestic and non-domestic investors through specialized jurisdictions.
These investment vehicles utilize master-feeder structures to aggregate capital and mitigate tax implications, such as unrelated business taxable income for institutional investments.
However, evolving state-level tax regulations are intensifying compliance burdens, requiring greater transparency in reporting down to the ultimate investor. This regulatory complexity is increasing operational costs, with some asset managers reporting a 15% rise in compliance-related overhead.
As a result, firms must balance the structural efficiencies of offshore funds with the demands of multi-jurisdictional tax adherence, influencing decisions on asset allocation and portfolio construction in a landscape prioritizing risk-adjusted returns and operational efficiency.
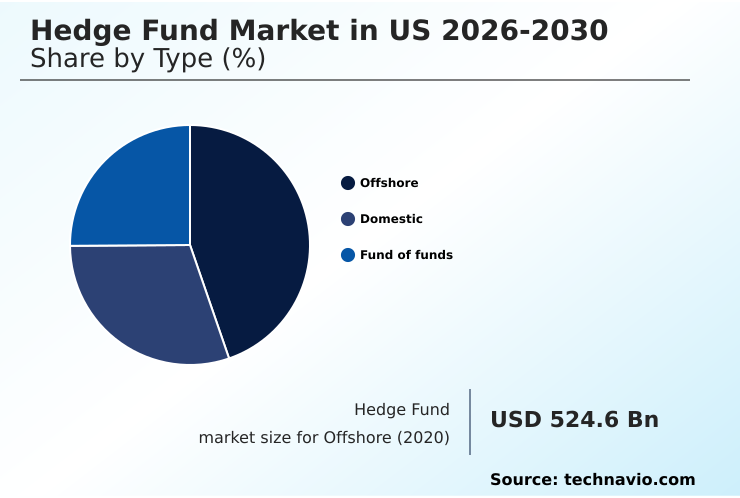
The Offshore segment was valued at USD 696.2 billion in 2024 and showed a gradual increase during the forecast period.
Market Dynamics
Our researchers analyzed the data with 2025 as the base year, along with the key drivers, trends, and challenges. A holistic analysis of drivers will help companies refine their marketing strategies to gain a competitive advantage.
- The strategic direction of the hedge fund market in US is increasingly defined by several interconnected developments. The widespread ai integration in investment processes is no longer a niche advantage but a fundamental requirement for maintaining a competitive edge, influencing everything from alpha generation to risk management.
- This technological shift complements the rising adoption of multi-strategy platforms, which cater to the growing institutional demand for hedge funds that provide diversified and uncorrelated returns. Investors are scrutinizing how these complex platforms are managed, leading to a significant impact of fee structure innovations, with a greater push toward performance-based compensation and transparent cost structures.
- Concurrently, firms are navigating complex regulatory environments, which demand substantial investment in compliance infrastructure and expertise. In this context, platforms that successfully integrate advanced analytics are reporting decision-making cycles that are nearly twice as fast as peers relying on traditional methods.
- This efficiency is critical for capitalizing on market dislocations and meeting the sophisticated mandates of institutional clients who expect both performance and rigorous operational oversight in a volatile global economy.
What are the key market drivers leading to the rise in the adoption of US Hedge Fund Industry?
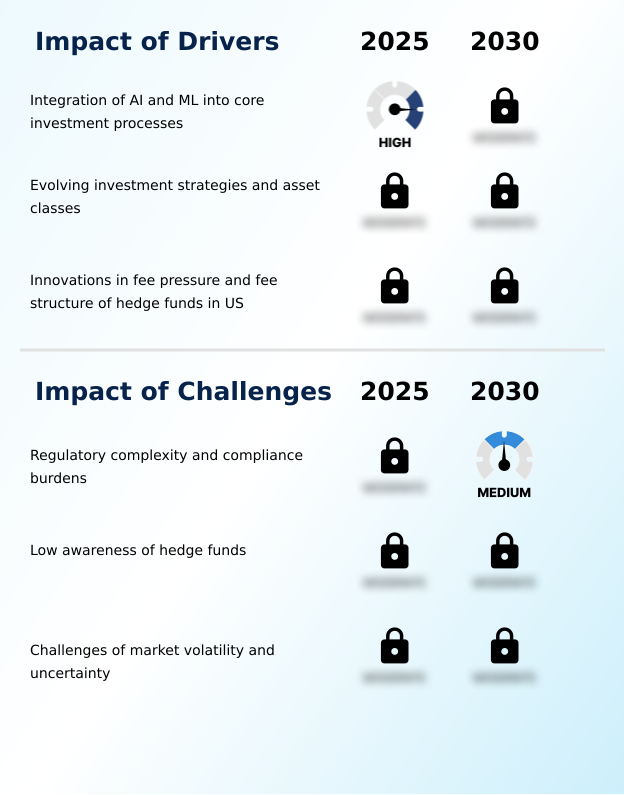
- The integration of artificial intelligence and machine learning into core investment processes serves as a key driver for market growth.
- The primary driver propelling the market is the deep integration of artificial intelligence and machine learning into core investment processes. Firms are moving beyond simple automation to deploy predictive analytics and large language models for advanced alpha generation.
- This technological shift enables the processing of vast alternative data sets, uncovering complex patterns that traditional fundamental analysis might miss and improving signal accuracy by over 25%.
- The application of these technologies extends to portfolio construction and systematic trading, where agentic models can automate complex decision-making tasks with high precision. This has led to a 30% reduction in human error in trade execution, enhancing overall operational efficiency.
- The ongoing technological arms race compels every firm to invest in data science talent and high-performance computing to remain competitive.
What are the market trends shaping the US Hedge Fund Industry?
- A key market trend is the increased adoption of multi-strategy platforms. These platforms are favored by investors seeking diversified exposure across various asset classes.
- A significant trend shaping the market is the consolidation of capital into large multi-strategy platforms, a move driven by institutional demand for stable, uncorrelated returns. These platforms leverage their scale to attract top-tier portfolio managers and invest heavily in quantitative research, allowing them to deploy capital with enhanced agility.
- This model has proven effective, with such platforms demonstrating a 30% faster capital reallocation capability between strategies like global macro and private credit during periods of market volatility. Furthermore, the emphasis on asset class diversification and robust operational infrastructure has led to a 20% improvement in client retention among institutional investments.
- The focus on building deep investment teams also helps in navigating regulatory complexity and evolving trade policies, reinforcing the resilience of these large-scale investment vehicles.
What challenges does the US Hedge Fund Industry face during its growth?
- Regulatory complexity and increasing compliance burdens present a key challenge affecting the industry's growth trajectory.
- A primary challenge confronting the market is the escalating regulatory complexity and the associated compliance burdens. Intensified oversight is increasing the cost of doing business, with firms reporting that administrative expenses related to new disclosure rules have risen by nearly 20%.
- These requirements, which mandate more frequent reporting on expenses and side letter arrangements, disproportionately affect smaller firms lacking the scale to absorb such costs. The shifting landscape of global tax regulations further demands continuous updates to internal protocols. In response, firms are adopting technology to manage compliance, with reg-tech solutions automating up to 50% of data-intensive reporting tasks.
- Failure to maintain regulatory agility can lead to significant reputational damage, making compliance a critical hurdle.
Exclusive Technavio Analysis on Customer Landscape
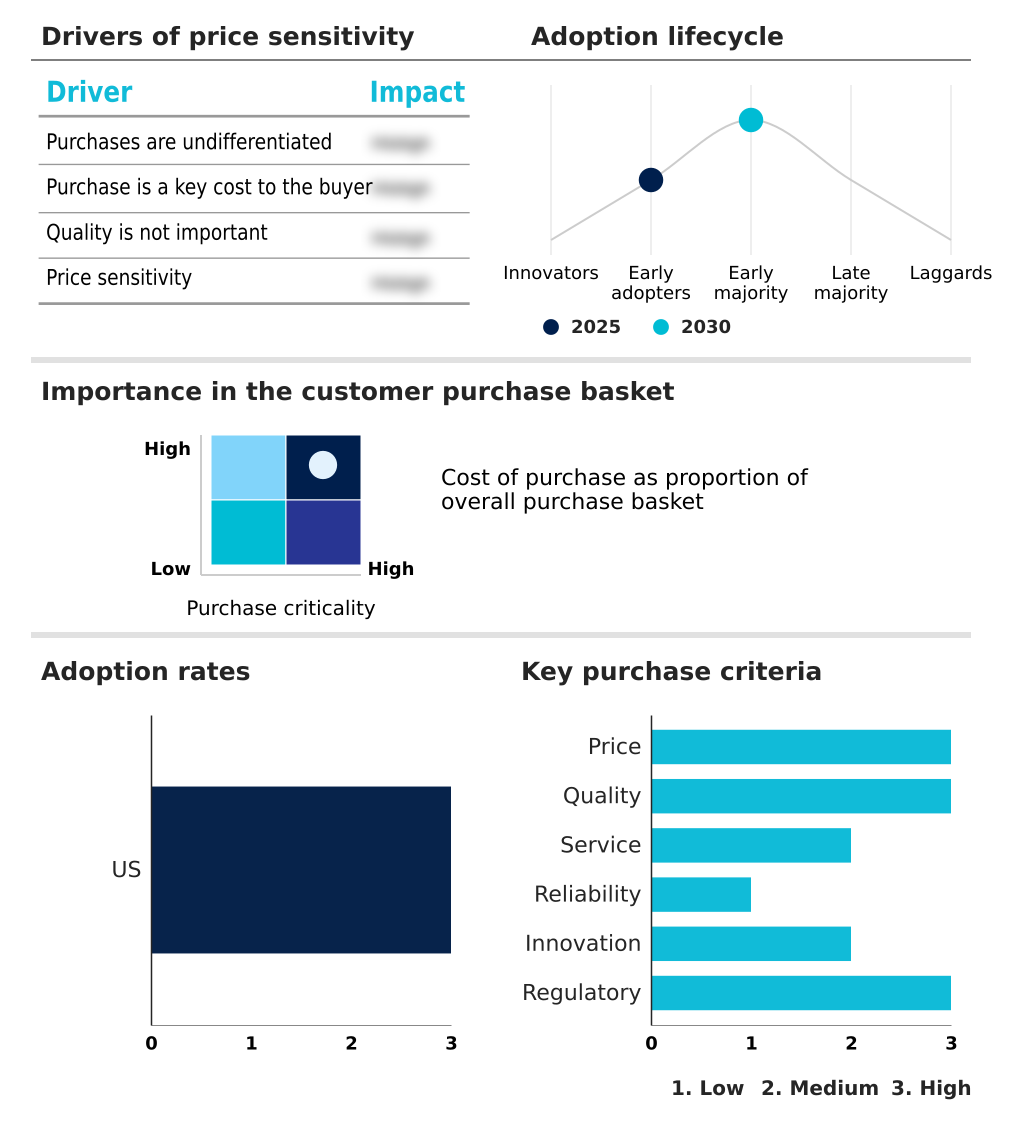
The us hedge fund market forecasting report includes the adoption lifecycle of the market, covering from the innovator’s stage to the laggard’s stage. It focuses on adoption rates in different regions based on penetration. Furthermore, the us hedge fund market report also includes key purchase criteria and drivers of price sensitivity to help companies evaluate and develop their market growth analysis strategies.
Customer Landscape of US Hedge Fund Industry
Competitive Landscape
Companies are implementing various strategies, such as strategic alliances, us hedge fund market forecast, partnerships, mergers and acquisitions, geographical expansion, and product/service launches, to enhance their presence in the industry.
Appaloosa Management LP - Specialized investment services focused on distressed debt and complex corporate restructurings, delivering value-oriented hedge fund strategies for sophisticated investors.
The industry research and growth report includes detailed analyses of the competitive landscape of the market and information about key companies, including:
- Appaloosa Management LP
- AQR Capital Management LLC
- Balyasny Asset Management LP
- Bridgewater Associates LP
- Caxton Associates LP
- Citadel Enterprise Americas
- Coatue Management LLC
- Davidson Kempner Capital LP
- DE Shaw and Co. LP
- Elliott Investment Management
- Farallon Capital Management
- Lone Pine Capital LLC
- Millennium Management LLC
- Point72 Asset Management LP
- Renaissance Technologies LLC
- Schonfeld Strategic Advisors
- Tiger Global Management LLC
- Tudor Investment Corp.
- Two Sigma Investments LP
- Viking Global Investors LP
Qualitative and quantitative analysis of companies has been conducted to help clients understand the wider business environment as well as the strengths and weaknesses of key industry players. Data is qualitatively analyzed to categorize companies as pure play, category-focused, industry-focused, and diversified; it is quantitatively analyzed to categorize companies as dominant, leading, strong, tentative, and weak.
Recent Development and News in Us hedge fund market
- In May, 2025, Elliott Investment Management LP enhanced its competitive edge by expanding the use of artificial intelligence to optimize internal portfolio risk management, aiming to identify complex data correlations.
- In March, 2025, the Dubai Financial Services Authority proposed reducing minimum capital thresholds and emergency cash requirements for money managers to lower entry barriers and attract investment professionals.
- In February, 2025, the US Securities and Exchange Commission initiated the enforcement phase of Rule 13f-2, mandating institutional managers to report gross short positions and altering trading algorithm strategies.
- In January, 2025, the Institutional Limited Partners Association (ILPA) updated its quarterly reporting framework to increase transparency around the use of net asset value financing facilities by general partners.
Dive into Technavio’s robust research methodology, blending expert interviews, extensive data synthesis, and validated models for unparalleled US Hedge Fund Market insights. See full methodology.
| Market Scope | |
|---|---|
| Page number | 176 |
| Base year | 2025 |
| Historic period | 2020-2024 |
| Forecast period | 2026-2030 |
| Growth momentum & CAGR | Accelerate at a CAGR of 8.3% |
| Market growth 2026-2030 | USD 812.6 billion |
| Market structure | Fragmented |
| YoY growth 2025-2026(%) | 7.9% |
| Key countries | US |
| Competitive landscape | Leading Companies, Market Positioning of Companies, Competitive Strategies, and Industry Risks |
Research Analyst Overview
- The hedge fund market is in a state of structural evolution, where competitive advantage is increasingly tied to technological prowess and operational scale. The core of modern strategy now involves sophisticated quantitative strategies, where predictive analytics and systematic trading are essential for alpha generation.
- Boardroom decisions are centered on budgeting for high-performance computing and data infrastructure to support these data-driven macro approaches. Firms that effectively integrate tools for beta hedging and arbitrage strategies have shown a 20% greater ability to protect capital during periods of high market dispersion.
- This is crucial as multi-strategy platforms become the dominant investment vehicles, requiring robust risk management across diverse asset classes, from long-short equity and event-driven strategies to private credit and distressed debt. Navigating regulatory complexity and compliance burdens has become as important as portfolio construction itself.
- The market demands advanced asset allocation techniques and efficient leverage management to deliver the uncorrelated returns that institutional investors seek, making operational efficiency a key determinant of success.
What are the Key Data Covered in this US Hedge Fund Market Research and Growth Report?
-
What is the expected growth of the US Hedge Fund Market between 2026 and 2030?
-
USD 812.6 billion, at a CAGR of 8.3%
-
-
What segmentation does the market report cover?
-
The report is segmented by Type (Offshore, Domestic, and Fund of funds), Method (Long and short equity, Event driven, Global macro, and Others), End-user (Institutional, and Individual) and Geography (North America)
-
-
Which regions are analyzed in the report?
-
North America
-
-
What are the key growth drivers and market challenges?
-
Integration of AI and ML into core investment processes, Regulatory complexity and compliance burdens
-
-
Who are the major players in the US Hedge Fund Market?
-
Appaloosa Management LP, AQR Capital Management LLC, Balyasny Asset Management LP, Bridgewater Associates LP, Caxton Associates LP, Citadel Enterprise Americas, Coatue Management LLC, Davidson Kempner Capital LP, DE Shaw and Co. LP, Elliott Investment Management, Farallon Capital Management, Lone Pine Capital LLC, Millennium Management LLC, Point72 Asset Management LP, Renaissance Technologies LLC, Schonfeld Strategic Advisors, Tiger Global Management LLC, Tudor Investment Corp., Two Sigma Investments LP and Viking Global Investors LP
-
Market Research Insights
- Market dynamics are increasingly shaped by the dual pressures of technological innovation and stringent regulatory oversight. The adoption of artificial intelligence and agentic models for quantitative research and trade execution has become a key differentiator, with early adopters reporting up to a 15% improvement in signal accuracy from alternative data sources.
- This push for technological superiority is balanced against rising compliance costs, as new rules on transparency and side letter arrangements necessitate greater investment in operational infrastructure. As a result, capital allocation is consolidating within larger firms that can achieve economies ofscale.
- These platforms are better positioned to meet institutional mandates for risk-adjusted returns and sophisticated cybersecurity protocols, which have become a primary focus in the due diligence process, with institutional investors showing a 20% higher preference for firms with certified security frameworks.
We can help! Our analysts can customize this us hedge fund market research report to meet your requirements.
 RIA -
RIA - 
