Canned Goods Market Size 2024-2028
The canned goods market size is forecast to increase by USD 70.5 billion, at a CAGR of 5% between 2023 and 2028.
- The market is experiencing significant growth due to the increasing disposable income of consumers, enabling them to afford a wider range of food products. A notable trend in this market is the rising demand for organic and non-GMO canned vegetables, reflecting consumers' growing preference for healthier food options. However, this market faces challenges from alternatives such as fresh produce and frozen foods, which may offer perceived superior taste and nutritional value.
- Companies in the canned goods industry must navigate these challenges by focusing on product innovation, sustainability, and effective marketing strategies to maintain their market share and cater to evolving consumer preferences.
What will be the Size of the Canned Goods Market during the forecast period?

Explore in-depth regional segment analysis with market size data - historical 2018-2022 and forecasts 2024-2028 - in the full report.
Request Free Sample
The market continues to evolve, with dynamic market activities shaping its landscape. Sealing integrity remains a critical focus, as advancements in canning technology, such as high-pressure processing and aseptic packaging systems, ensure fill level consistency and production efficiency. Ingredient sourcing and recipe formulation are also essential aspects, with demand forecasting models guiding procurement strategies. Retort pouch sterilization and sterilization validation are increasingly adopted for their flexibility and convenience. Sales data analysis and supply chain management are integral components, enabling businesses to optimize inventory and distribution logistics. Canned food spoilage and food safety regulations are ongoing concerns, with stringent quality control procedures and microbial contamination control measures in place.
Automated canning lines, vacuum sealing techniques, and product traceability are essential for maintaining high-quality standards. Nutritional value retention and texture analysis are crucial for meeting consumer preferences. Headspace oxygen levels, packaging material selection, and metal detection systems are essential considerations for ensuring product safety and shelf life. Modifications in thermal processing parameters and sanitation protocols continue to evolve, addressing challenges such as metal can corrosion and spoilage microorganism detection. The market's continuous dynamism is reflected in the ongoing research and development of advanced technologies, ensuring the industry remains at the forefront of food preservation and innovation.
How is this Canned Goods Industry segmented?
The canned goods industry research report provides comprehensive data (region-wise segment analysis), with forecasts and estimates in "USD billion" for the period 2024-2028, as well as historical data from 2018-2022 for the following segments.
- Packaging
- Metal cans
- Glass jars
- Plastic containers
- Distribution Channel
- Offline
- Online
- Product Type
- Canned Fruits
- Canned Vegetables
- Canned Meat and Poultry
- Canned Fish/Seafood
- Canned Soups
- Type
- Conventional
- Organic
- Geography
- North America
- US
- Canada
- Europe
- France
- Germany
- Italy
- UK
- APAC
- Australia
- China
- Japan
- South America
- Brazil
- Rest of World (ROW)
- North America
By Packaging Insights
The metal cans segment is estimated to witness significant growth during the forecast period.
The market is shaped by various factors, with packaging playing a pivotal role. Metal cans, predominantly made from aluminum or tinplate, are favored for their preservation capabilities. The canning process forms an airtight seal, preventing oxygen intrusion and maintaining food safety. This vacuum environment also preserves nutritional value and flavor. High-pressure processing and aseptic packaging systems ensure fill level consistency and production efficiency. However, metal can corrosion and microbial contamination are ongoing concerns, necessitating stringent sanitation protocols. Consumer preferences and recipe formulation drive ingredient sourcing, while demand forecasting models guide inventory management. Retort pouch sterilization and sterilization validation offer alternatives to metal cans.
Sales data analysis and supply chain management optimize distribution logistics. Nutritional value retention, product texture analysis, and headspace oxygen levels are essential considerations for maintaining product quality. Packaging material selection, metal detection systems, and modified atmosphere packaging are other critical factors. Thermal processing parameters and quality control procedures ensure can sealing integrity and weight control. Label printing technology completes the canning process. Food safety regulations govern all aspects of canned goods production, from raw materials to distribution.
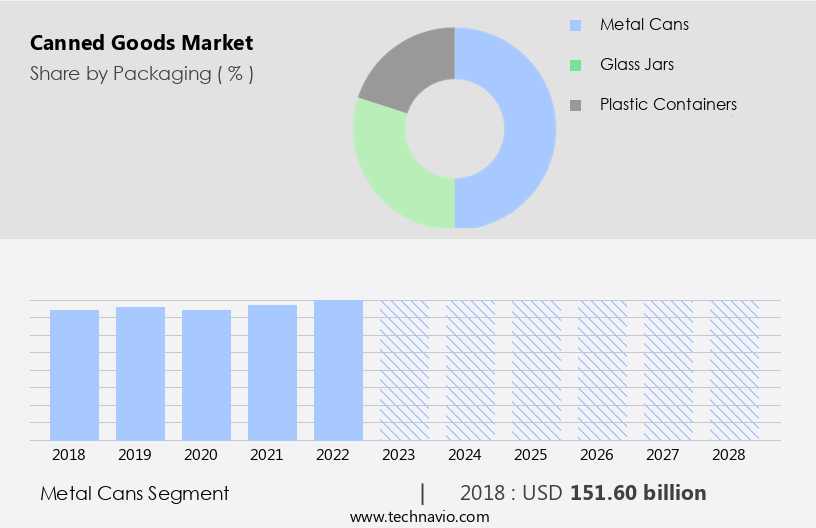
The Metal cans segment was valued at USD 151.60 billion in 2018 and showed a gradual increase during the forecast period.
Regional Analysis
North America is estimated to contribute 34% to the growth of the global market during the forecast period.Technavio's analysts have elaborately explained the regional trends and drivers that shape the market during the forecast period.
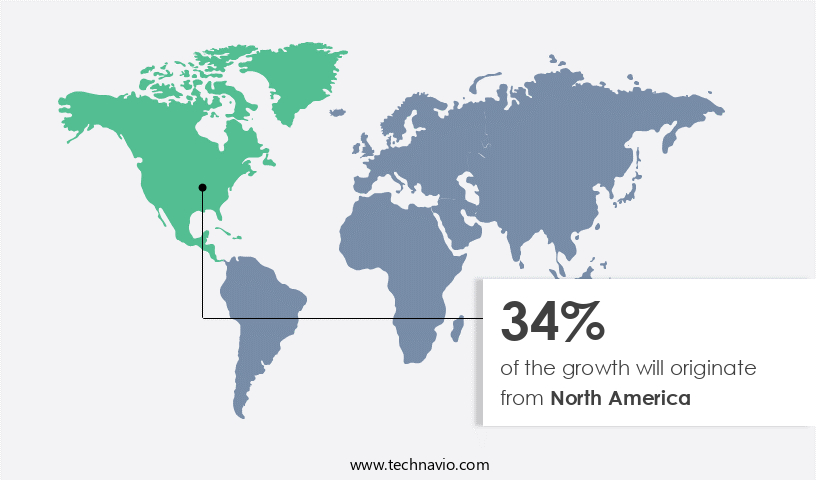
The North American the market experiences dynamic growth, fueled by diverse consumer preferences and evolving dietary trends. Approximately 5-8% of the US population, equating to around 13.7 million individuals, identify as vegetarian or vegan, creating a significant demand for plant-based canned goods. In Canada, the vegan population reached approximately 2 million in 2022. This expanding demographic of health-conscious consumers propels the market, necessitating a broader range of canning solutions. Inventory management systems and high-pressure processing ensure efficient production and maintain fill level consistency. Aseptic packaging systems and vacuum sealing techniques preserve nutritional value retention and microbial contamination control.
Production efficiency metrics and sterilization validation optimize canning lines, while metal detection systems and modified atmosphere packaging enhance product safety. Consumer preference studies inform recipe formulation, catering to various dietary requirements. Demand forecasting models and sales data analysis enable supply chain management, addressing the increasing demand for canned goods. Ingredient sourcing and thermal processing parameters prioritize food safety regulations. Automated canning lines and can sealing integrity maintain product texture analysis and headspace oxygen levels. Label printing technology ensures accurate product traceability. Distribution logistics and spoilage microorganism detection mitigate canned food spoilage risks. Packaging material selection and sanitation protocols prioritize product safety and consumer satisfaction.
Quality control procedures and weight control systems maintain canning line efficiency and consistency. The market's evolution underscores the importance of addressing these interconnected aspects to cater to the growing demand for canned goods.
Market Dynamics
Our researchers analyzed the data with 2023 as the base year, along with the key drivers, trends, and challenges. A holistic analysis of drivers will help companies refine their marketing strategies to gain a competitive advantage.
The market continues to evolve, with ongoing efforts to optimize various aspects of production, distribution, and consumer satisfaction. Sterilization procedures are being refined to ensure food safety and reduce spoilage rates. Packaging materials are being carefully selected to enhance product quality and improve shelf life. Quality control processes are being enhanced to maintain supply chain integrity and reduce production waste levels. Canned food production lines are being monitored for efficiency, with automation and label printing accuracy being key areas of focus. Consumer preference data is being analyzed to inform product development and distribution strategies. Canned food distribution networks are being evaluated to optimize inventory management practices and ensure regulatory compliance. Cost efficiencies are being measured to improve profitability, while sales and demand are being predicted to inform production planning. Supply chain risks are being managed to mitigate potential disruptions, and food safety standards are being maintained to protect consumer health. Continuous improvement is the name of the game in the market, with ongoing efforts to enhance thermal processing, reduce waste, and improve product traceability systems. The market's dynamism is driven by a range of factors, from evolving consumer preferences to changing regulatory requirements. As such, stakeholders must remain agile and adaptable to stay competitive in this ever-evolving landscape.
What are the key market drivers leading to the rise in the adoption of Canned Goods Industry?
- The increase in disposable income serves as the primary catalyst for market growth. The market is experiencing notable growth due to the increasing disposable income of consumers in various regions. This trend is driving demand for convenient and ready-to-eat food products, including canned goods. For instance, in some countries, the average income for employed individuals has risen significantly. In 2023, the estimated real monthly income for individuals aged 14 and above was USD548, representing a 7.2% increase from the previous year and a 1.8% surge compared to 2019. This income growth is contributing to higher consumer spending on canned goods, making them an affordable and practical option for households.
- To cater to this growing demand, manufacturers are implementing advanced technologies such as high-pressure processing and aseptic packaging systems to ensure fill level consistency and production efficiency. These technologies help maintain the quality and safety of canned goods while reducing the risk of metal can corrosion and contamination. Moreover, sanitation protocols and consumer preference studies are crucial factors in recipe formulation to meet evolving consumer demands. These market dynamics underscore the importance of an effective inventory management system for canned goods manufacturers to optimize production, minimize waste, and meet consumer demand.
What are the market trends shaping the Canned Goods Industry?
- The increasing preference for organic and non-Genetically Modified Organisms (GMO) in canned vegetables signifies a notable market trend. Consumers are increasingly seeking healthier and more natural food options, driving the demand for canned vegetables that adhere to these standards.
- The market is witnessing a significant trend toward organic and non-GMO canned vegetables due to shifting consumer preferences. Health-conscious consumers are increasingly seeking foods they perceive as healthier and more sustainable. This shift is evident in the rising demand for canned vegetables that are free from genetically modified organisms (GMOs) and certified organic. Key attributes such as clean labeling, fortification, and low sodium and sugar content are gaining popularity among consumers. These features cater to the growing segment of health-conscious individuals who prioritize nutritional benefits and transparency in food labeling. As a result, the market for organic and non-GMO canned vegetables is expanding, reflecting a broader trend toward healthier eating habits.
- To meet this demand, companies are focusing on ingredient sourcing and implementing rigorous can sealing integrity protocols to ensure product freshness and food safety. Advanced technologies such as retort pouch sterilization and sterilization validation are being employed to maintain the highest standards of food safety and quality. Sales data analysis and supply chain management are also crucial elements in maintaining the integrity of the canned goods supply chain. Canned food spoilage is a major concern, and food safety regulations are stringent to prevent contamination and ensure consumer safety. Overall, the market is dynamic and evolving, with a strong focus on meeting the changing needs and preferences of health-conscious consumers.
What challenges does the Canned Goods Industry face during its growth?
- The growth of the industry is significantly influenced by the intense competition posed by alternative options.
- The market confronts notable competition from alternative food options, such as fresh and frozen vegetables and meats. Consumers increasingly prioritize the perception of freshness and nutritional value in their food choices, which canned goods may not always meet. This preference for unprocessed produce poses a significant challenge, as many consumers may opt for fresh or frozen options instead. Frozen vegetables and meats represent another formidable competitor for canned goods. These products offer a compromise between fresh and canned produce, often perceived as retaining more nutrients and flavor than canned alternatives. Automated canning lines, vacuum sealing techniques, and advanced packaging materials are essential strategies employed by manufacturers to mitigate these competitive pressures.
- Product traceability, nutritional value retention, microbial contamination control, product texture analysis, headspace oxygen levels, and packaging material selection are crucial factors influencing the market's growth. Additionally, implementing a metal detection system ensures food safety and consumer confidence. The canned goods industry continues to innovate, focusing on enhancing product quality and addressing consumer preferences.
Exclusive Customer Landscape
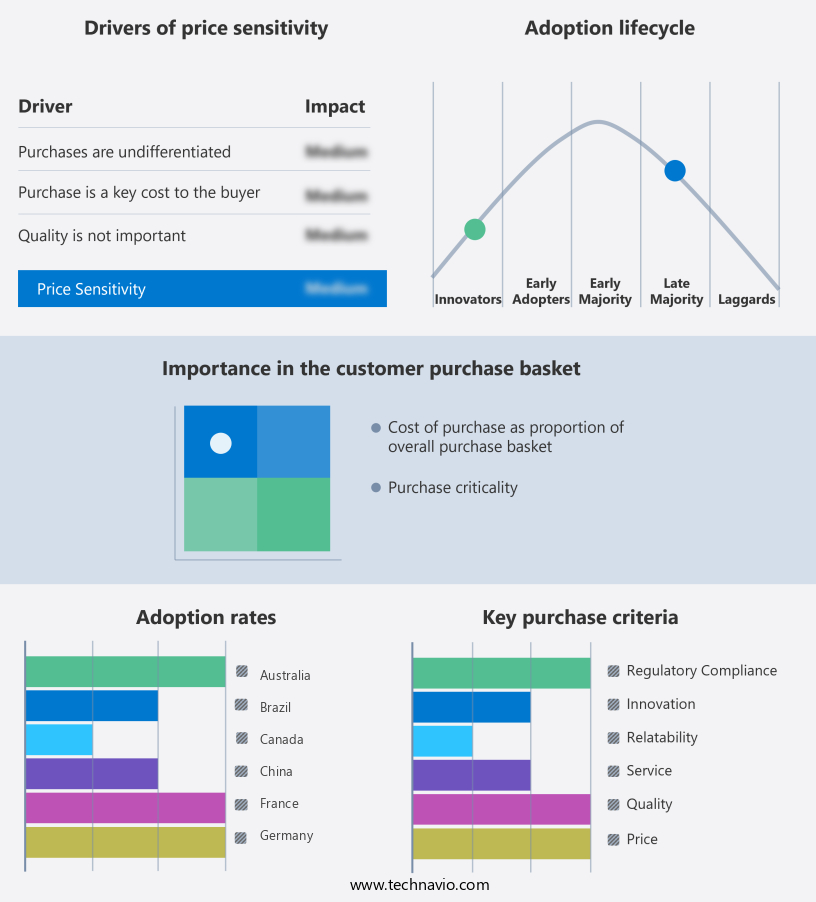
The canned goods market forecasting report includes the adoption lifecycle of the market, covering from the innovator's stage to the laggard's stage. It focuses on adoption rates in different regions based on penetration. Furthermore, the canned goods market report also includes key purchase criteria and drivers of price sensitivity to help companies evaluate and develop their market growth analysis strategies.
Customer Landscape
Key Companies & Market Insights
Companies are implementing various strategies, such as strategic alliances, canned goods market forecast, partnerships, mergers and acquisitions, geographical expansion, and product/service launches, to enhance their presence in the industry.
B and G Foods Inc. - This company specializes in producing a range of canned goods, including bagel chips, melba toasts, peas, and sweet carrots. Their offerings cater to various consumer preferences, providing convenient and versatile options for meals and snacks. The company's commitment to quality and innovation ensures consistent product excellence.
The industry research and growth report includes detailed analyses of the competitive landscape of the market and information about key companies, including:
- B and G Foods Inc.
- Baxters Food Group Ltd.
- BONDUELLE SA
- Campbell Soup Co.
- Century Pacific Food Inc.
- Del Monte Foods Inc.
- Denis Asia Pacific PTE LTD
- General Mills Inc.
- Goya Foods Inc.
- Greenyard NV
- Hormel Foods Corp.
- LA DORIA S.P.A.
- Ocean Spray Cranberries Inc.
- OTS Holdings Ltd.
- Scout
- Seneca Foods Corp.
- Tesco Plc
- The Kraft Heinz Co.
- Whole Foods Market Services Inc.
Qualitative and quantitative analysis of companies has been conducted to help clients understand the wider business environment as well as the strengths and weaknesses of key industry players. Data is qualitatively analyzed to categorize companies as pure play, category-focused, industry-focused, and diversified; it is quantitatively analyzed to categorize companies as dominant, leading, strong, tentative, and weak.
Recent Development and News in Canned Goods Market
- In January 2024, Campbell Soup Company, a leading player in the market, announced the launch of its new organic and plant-based product line, "Campbell's Well Yes!", to cater to the growing demand for healthier and sustainable food options (Campbell Soup Company Press Release).
- In March 2024, The Kroger Co., the largest supermarket chain in the US, and General Mills, a major canned goods manufacturer, signed a strategic partnership to expand their private label offerings and improve product innovation (The Kroger Co. Press Release).
- In May 2024, H.J. Heinz Company, a subsidiary of Kraft Heinz, completed the acquisition of Primal Kitchen, a leading producer of avocado oil mayonnaise and other healthy condiments, to expand its product portfolio in the health-conscious canned goods segment (Kraft Heinz Company Press Release).
- In April 2025, the European Union approved the merger of Nestle and Starbucks' canned coffee businesses, creating a major player in the global canned coffee market, with an estimated 30% market share (European Commission Press Release).
Research Analyst Overview
- In the market, quality assurance systems play a pivotal role in ensuring consumer safety and product integrity. Microbial inactivation kinetics and sensory evaluation methods are critical components of these systems, enabling manufacturers to monitor and improve product quality. Effective distribution network design and production scheduling methods are essential for maximizing profit margins. Process improvement initiatives, such as good manufacturing practices and yield optimization strategies, help reduce defects and improve efficiency. Moreover, process control technology, including heat transfer modeling and statistical process control, facilitates consistent production and minimizes energy consumption. Cost analysis methodologies and inventory control techniques enable resource optimization, while capacity planning techniques cater to market segmentation strategies.
- Food safety audits and risk assessment methodologies are crucial for maintaining a strong brand reputation and ensuring regulatory compliance. Failure analysis techniques and equipment maintenance schedules contribute to continuous process improvement, while energy consumption monitoring and waste reduction strategies promote sustainability. Effective supply chain visibility and market segmentation strategies enable manufacturers to cater to diverse consumer behavior patterns and optimize production lines. Ultimately, these strategies contribute to the overall competitiveness and success of canned goods manufacturers.
Dive into Technavio's robust research methodology, blending expert interviews, extensive data synthesis, and validated models for unparalleled Canned Goods Market insights. See full methodology.
|
Market Scope |
|
|
Report Coverage |
Details |
|
Page number |
201 |
|
Base year |
2023 |
|
Historic period |
2018-2022 |
|
Forecast period |
2024-2028 |
|
Growth momentum & CAGR |
Accelerate at a CAGR of 5% |
|
Market growth 2024-2028 |
USD 70.5 billion |
|
Market structure |
Fragmented |
|
YoY growth 2023-2024(%) |
4.3 |
|
Key countries |
US, Germany, UK, France, Italy, Canada, Japan, Brazil, Australia, and China |
|
Competitive landscape |
Leading Companies, Market Positioning of Companies, Competitive Strategies, and Industry Risks |
What are the Key Data Covered in this Canned Goods Market Research and Growth Report?
- CAGR of the Canned Goods industry during the forecast period
- Detailed information on factors that will drive the growth and forecasting between 2024 and 2028
- Precise estimation of the size of the market and its contribution of the industry in focus to the parent market
- Accurate predictions about upcoming growth and trends and changes in consumer behaviour
- Growth of the market across North America, Europe, APAC, Middle East and Africa, and South America
- Thorough analysis of the market's competitive landscape and detailed information about companies
- Comprehensive analysis of factors that will challenge the canned goods market growth of industry companies
We can help! Our analysts can customize this canned goods market research report to meet your requirements.
 RIA -
RIA - 
