
Hyper Converged Infrastructure Market Size 2025-2029
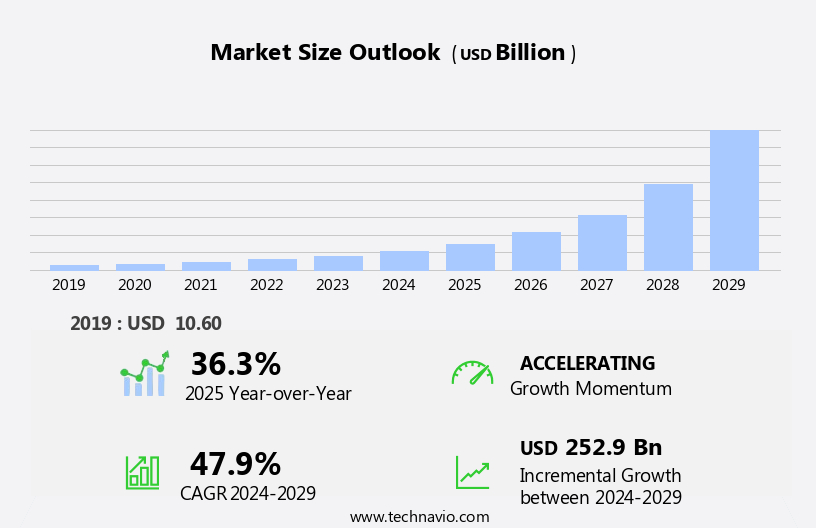
The hyper converged infrastructure market size is forecast to increase by USD 252.9 billion at a CAGR of 47.9% between 2024 and 2029.
- Hyper Converged Infrastructure (HCI) is a type of Converged Infrastructure that offers a more agile and efficient IT solution by integrating compute, storage, and networking resources into a single system. The market for HCI is experiencing significant growth due to various factors, including the increasing demand for data protection and the impact of digital transformation on businesses. The trend towards hybrid cloud deployments is also driving the adoption of HCI, as it allows organizations to easily extend their on-premises infrastructure to the cloud.
- Software-defined storage and server technologies are key components of HCI, enabling businesses to manage their data centers more effectively and reduce costs. Another trend is the increasing importance of data security, which is driving the adoption of HCI solutions that offer advanced security features. Composable infrastructure is also making waves In the HCI market, offering businesses the ability to dynamically allocate resources as needed, providing greater flexibility and efficiency.
- IT spending on data center infrastructure and cloud computing is expected to continue to grow, providing ample opportunities for HCI companies. However, the market also faces challenges, such as the need for professional services to deploy and manage HCI solutions, and the complexity of integrating HCI with existing IT environments. Overall, the HCI market is poised for continued growth, driven by the need for agility, efficiency, and data security in today's digital business landscape.
What will be the Size of the Hyper Converged Infrastructure Market During the Forecast Period?
- The market represents a significant shift in IT spending, with organizations increasingly turning to this technology to reduce capital expenditures and optimize operational expenditures. HCI integrates servers, storage, and networking into a single, easy-to-manage solution, enabling businesses to streamline their IT infrastructure and improve disaster recovery capabilities through built-in data deduplication and compression. The market's growth is driven by the increasing demand for scale computing, fueled by the proliferation of digital services, knowledge platforms, and the rise of remote work and online collaboration. HCI's ability to support distributed infrastructure and intelligent software solutions is also a key factor, as businesses seek to enhance data management, security, and digital technology offerings In the face of growing economic conditions and the increasing threat of data breaches.
- Hardware requirements, such as solid-state drives and servers, continue to play a critical role in the market, as businesses look to modernize their infrastructure and support the growing number of connected devices. Colocation services and virtual desktops are also gaining popularity, as businesses seek to optimize their data center resources and improve disaster recovery capabilities. Overall, the HCI market is expected to continue its strong growth trajectory, as businesses increasingly adopt this technology to meet their evolving IT needs.
How is this Hyper Converged Infrastructure Industry segmented and which is the largest segment?
The industry research report provides comprehensive data (region-wise segment analysis), with forecasts and estimates in "USD billion" for the period 2025-2029, as well as historical data from 2019-2023 for the following segments.
- Component
- Solutions
- Services
- End-user
- Financial services
- Healthcare
- Education
- Government
- Others
- Application
- Large enterprises
- SMEs
- Type
- Virtual desktop infrastructure
- Data center consolidation
- Virtualizing critical applications
- Backup and disaster recovery
- Others
- Geography
- North America
- Canada
- US
- Europe
- Germany
- UK
- France
- Italy
- APAC
- China
- India
- Japan
- South America
- Middle East and Africa
- North America
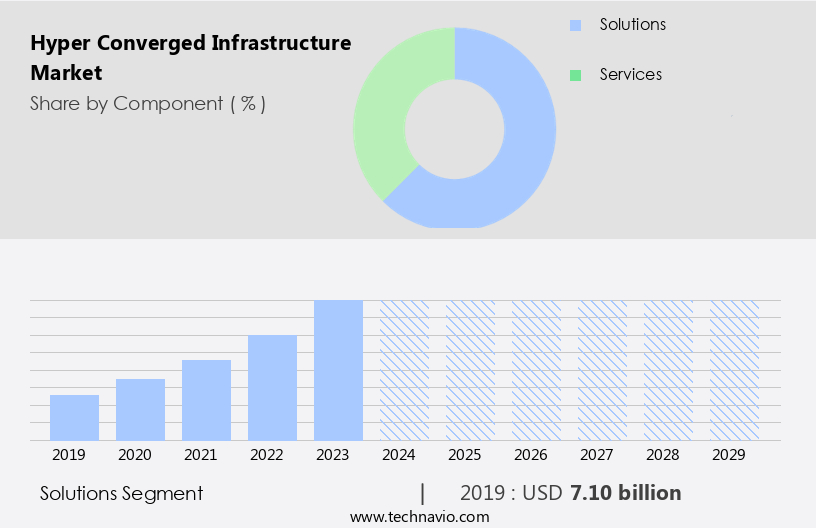
By Component Insights
- The solutions segment is estimated to witness significant growth during the forecast period.
The market is witnessing significant growth due to the increasing demand for cost-effective, efficient, and scalable IT solutions. The market's expansion is primarily driven by the solutions segment, which encompasses hardware components such as CPUs and monitors used in HCI. Integration of advanced hardware, including high-performance processors, solid-state drives (SSDs), and sophisticated networking technologies, is fueling the adoption of HCI solutions. These integrated systems offer organizations a reliable foundation for their IT infrastructure, allowing for streamlined operations, reduced maintenance costs, and enhanced performance. HCI solutions also enable businesses to improve data management, ensure business agility, and provide application availability.
Furthermore, economic conditions, infrastructure refreshments, and the shift towards cloud computing and hybrid cloud environments are additional factors contributing to the market's growth. The market is further driven by the integration of intelligent software, distributed infrastructure, and distributed software layers, which offer advanced features such as deduplication, compression, disaster recovery, and security. HCI solutions are suitable for various industries, including enterprises, data centers, edge infrastructure, and cloud computing. Systems integrators play a crucial role In the implementation and deployment of these solutions.
Get a glance at the Hyper Converged Infrastructure Industry report of share of various segments Request Free Sample
The solutions segment was valued at USD 7.10 billion in 2019 and showed a gradual increase during the forecast period.
Regional Analysis
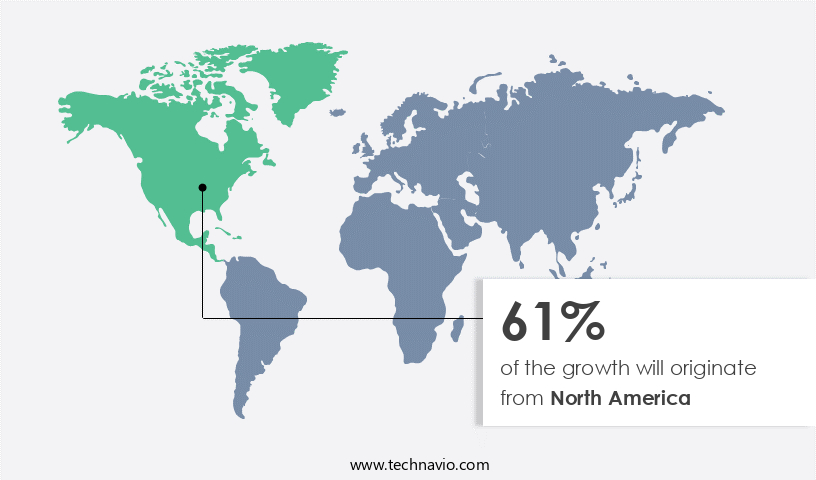
- North America is estimated to contribute 61% to the growth of the global market during the forecast period.
Technavio's analysts have elaborately explained the regional trends and drivers that shape the market during the forecast period.
For more insights on the market share of various regions, Request Free Sample
North America is a leading market due to its advanced technological landscape and favorable business environment. The region hosts numerous HCI companies, both established players and startups, with significant research and development investments and strong partnerships with system integrators. Channel sales dominate the HCI market in North America, and having established channels is crucial for boosting sales. HCI systems offer cost efficiency, business agility, application availability, and data security, making them increasingly popular for enterprises looking to modernize their IT infrastructure. Key components of HCI include deduplication, compression, and hardware requirements such as Solid State Drives (SSD) and Intellectual Property (IP) cores.
Economic conditions, infrastructure refresh, and disaster recovery are significant factors driving HCI adoption. HCI systems also integrate with cloud services as well as distributed infrastructure and software-defined storage solutions. The market is expected to grow due to the increasing demand for data management, data security, and digital services, as well as the proliferation of connected devices and the need for colocation services.
Market Dynamics
Our researchers analyzed the data with 2024 as the base year, along with the key drivers, trends, and challenges. A holistic analysis of drivers will help companies refine their marketing strategies to gain a competitive advantage.
What are the key market drivers leading to the rise In the adoption of Hyper Converged Infrastructure Industry?
Increasing demand for data protection is the key driver of the market.
- Hyper Converged Infrastructure (HCI) systems offer businesses capital expenditure savings by reducing hardware requirements through the integration of servers, storage, and networking into a single system. Operational expenditure is also minimized due to simplified management through a distributed software layer. HCI systems provide data management features such as deduplication and compression, ensuring cost efficiency. Infrastructure refresh is facilitated with the use of SolidState Drives and Flash storage. Businesses can maintain application availability and ensure data security with disaster recovery capabilities. HCI systems offer features like RAID and erasure coding for data protection. Economic conditions influence the adoption of HCI systems as they provide a more cost-effective alternative to traditional SAN Storage and legacy infrastructure.
- HCI systems enable business agility by allowing for easy scaling and management. Intelligent software and Systems Integrators assist In the deployment and management of these systems. While public clouds like Microsoft Azure and Google Cloud offer benefits, HCI systems cater to organizations with regulatory or compliance requirements that necessitate on-premises data centers. Networking and data center virtualization consolidate workloads, reducing the need for multiple systems and software licenses. HCI systems offer private clouds and support hybrid cloud environments. They cater to the needs of digital services, remote work, online collaboration, and virtual desktops. Data security, disaster recovery, and data breaches are addressed with HCI systems' advanced features.
What are the market trends shaping the Hyper Converged Infrastructure Industry?
Separate compute and storage nodes in HCI is the upcoming market trend.
- Hyper Converged Infrastructure (HCI) systems offer businesses significant advantages, including cost efficiency and business agility. HCI systems allow for easy scalability through the addition or removal of nodes, making infrastructure refreshes more flexible. However, earlier HCI systems had limitations, as they could not scale computation or storage independently. This led to challenges, such as increased licensing costs due to the need to add entire server nodes for additional capacity. To address these challenges, some companies have introduced innovative solutions. Instead of requiring customers to add entire nodes for additional computing or storage, these systems enable independent scaling. This approach eliminates the issue of HCI taxes and provides more cost-effective solutions.
- Data management is a critical concern for businesses, and HCI systems offer advanced features such as deduplication and compression to optimize storage utilization. Disaster recovery is also a priority, and HCI systems provide reliable solutions through distributed infrastructure and intelligent software. Economic conditions and the shift towards cloud computing have led enterprises to reconsider their infrastructure strategies. HCI systems offer a cost-effective alternative to traditional SAN Storage and commodity datacenters, with the added benefits of virtual desktops, software-defined storage, and networking. Scale Computing, Servers, Storage, and Systems Integrators are some of the key players In the market.
What challenges does the Hyper Converged Infrastructure Industry face during its growth?
The impact of composable infrastructure on HCI is a key challenge affecting the industry growth.
- Composable infrastructure represents a progressive data center solution that overcomes the constraints of traditional hyper converged systems. In contrast to hyper converged infrastructure (HCI), which organizes storage, computation, and network resources into pre-configured systems, composable infrastructure offers greater flexibility and scalability. HCI systems are optimized for specific workloads but may limit business agility due to their inflexible design. Moreover, buyers risk company lock-in when investing in pre-configured HCI systems. Composable infrastructure, on the other hand, delivers service tiers from pooled resources using intelligent software. This approach allows for on-demand allocation of resources, enabling businesses to adapt to changing workload requirements.
- Additionally, composable infrastructure supports a distributed software layer, which enhances data management capabilities through features like deduplication and compression. The economic conditions and digital transformation initiatives drive the adoption of composable infrastructure in enterprises. This technology facilitates cost efficiency by reducing capital expenditure on hardware and operational expenditure on maintenance. Furthermore, it offers improved disaster recovery capabilities, ensuring application availability and data security In the face of potential data breaches. In the evolving data center landscape, composable infrastructure supports various deployment models, including private clouds, hybrid clouds, and colocation services.
Exclusive Customer Landscape
The market forecasting report includes the adoption lifecycle of the market, covering from the innovator's stage to the laggard's stage. It focuses on adoption rates in different regions based on penetration. Furthermore, the market report also includes key purchase criteria and drivers of price sensitivity to help companies evaluate and develop their market growth analysis strategies.
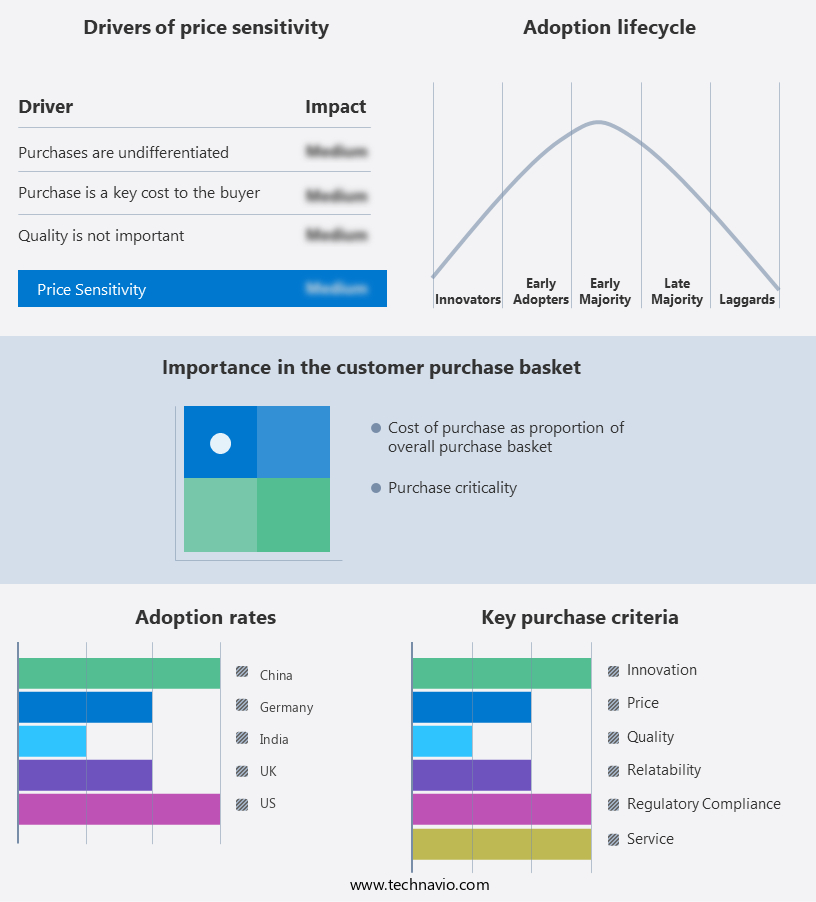
Customer Landscape
Key Companies & Market Insights
Companies are implementing various strategies, such as strategic alliances, market forecast, partnerships, mergers and acquisitions, geographical expansion, and product/service launches, to enhance their presence In the industry.
AT and T Inc: The company offers hyper-converged infrastructure through its subsidiary NEC Corporation namely NEC HyperConverged Infrastructure, powered by Scale Computing HC3 software, which transforms and simplifies data and storage management.
The industry research and growth report includes detailed analyses of the competitive landscape of the market and information about key companies, including:
- AT and T Inc.
- Cisco Systems Inc.
- DataCore Software Corp.
- Dell Technologies Inc.
- Dynamic Network Factory Inc.
- Furukawa Electric Co. Ltd.
- Hewlett Packard Enterprise Co.
- Hitachi Ltd.
- HiveIO Inc.
- Huawei Technologies Co. Ltd.
- Lenovo Group Ltd.
- Lumen Technologies Inc.
- Maxta Inc.
- Microsoft Corp.
- Nutanix Inc.
- Olabs Technology Co. Ltd.
- Quantum Corp.
- Scale Computing
- StarWind Software Inc.
- VMware Inc.
Qualitative and quantitative analysis of companies has been conducted to help clients understand the wider business environment as well as the strengths and weaknesses of key industry players. Data is qualitatively analyzed to categorize companies as pure play, category-focused, industry-focused, and diversified; it is quantitatively analyzed to categorize companies as dominant, leading, strong, tentative, and weak.
Research Analyst Overview
Hyperconverged infrastructure (HCI) is a technology that has gained significant traction In the corporate world due to its ability to simplify IT operations and improve business agility. This solution offers a more integrated approach to managing servers, storage, and networking in a single, easy-to-manage system. One of the primary advantages of HCI is its impact on capital and operational expenditures. By consolidating various IT components into a single, compact solution, enterprises can reduce their overall hardware requirements and associated costs. Additionally, HCI's efficient use of resources enables organizations to save on energy consumption and cooling expenses. Another key benefit of HCI is its role in disaster recovery and data management.
Moreover, with built-in data deduplication and compression, HCI helps businesses efficiently store and manage their data, reducing the need for extensive storage capacity. Furthermore, HCI solutions often include disaster recovery capabilities, ensuring business continuity In the event of an unplanned outage. Scaling IT infrastructure has become a critical concern for many enterprises, and HCI addresses this challenge through its distributed infrastructure design. By utilizing a distributed software layer and intelligent management pane, HCI enables organizations to easily add or remove nodes as needed, ensuring that their infrastructure can adapt to changing workload demands. As economic conditions continue to evolve, businesses are increasingly turning to HCI to optimize their IT investments.
Furthermore, legacy infrastructure, such as spinning disk arrays and traditional server environments, can be costly to maintain and may not provide the necessary agility for today's digital business landscape. HCI offers a more cost-efficient alternative, with its all-in-one design and simplified management. The adoption of HCI is not limited to traditional data centers but also extends to edge infrastructure and private clouds. With its ability to support a wide range of workloads and applications, HCI enables businesses to consolidate their IT infrastructure and streamline their operations, regardless of the deployment model. Security is a top priority for enterprises, and HCI addresses this concern through its integrated approach to IT management.
|
Market Scope |
|
|
Report Coverage |
Details |
|
Page number |
251 |
|
Base year |
2024 |
|
Historic period |
2019-2023 |
|
Forecast period |
2025-2029 |
|
Growth momentum & CAGR |
Accelerate at a CAGR of 47.9% |
|
Market Growth 2025-2029 |
USD 252.9 billion |
|
Market structure |
Fragmented |
|
YoY growth 2024-2025(%) |
36.3 |
|
Key countries |
US, Canada, UK, China, Germany, Japan, France, Italy, India, and The Netherlands |
|
Competitive landscape |
Leading Companies, Market Positioning of Companies, Competitive Strategies, and Industry Risks |
What are the Key Data Covered in this Hyper Converged Infrastructure Market Research and Growth Report?
- CAGR of the Hyper Converged Infrastructure industry during the forecast period
- Detailed information on factors that will drive the market growth and forecasting between 2025 and 2029
- Precise estimation of the size of the market and its contribution to the industry in focus on the parent market
- Accurate predictions about upcoming growth and trends and changes in consumer behaviour
- Growth of the market across North America, Europe, APAC, South America, and Middle East and Africa
- Thorough analysis of the market's competitive landscape and detailed information about companies
- Comprehensive analysis of factors that will challenge the hyper converged infrastructure market growth of industry companies
We can help! Our analysts can customize this hyper converged infrastructure market research report to meet your requirements.
 RIA -
RIA - 
