
In-Vitro Toxicity Testing Market Size 2025-2029
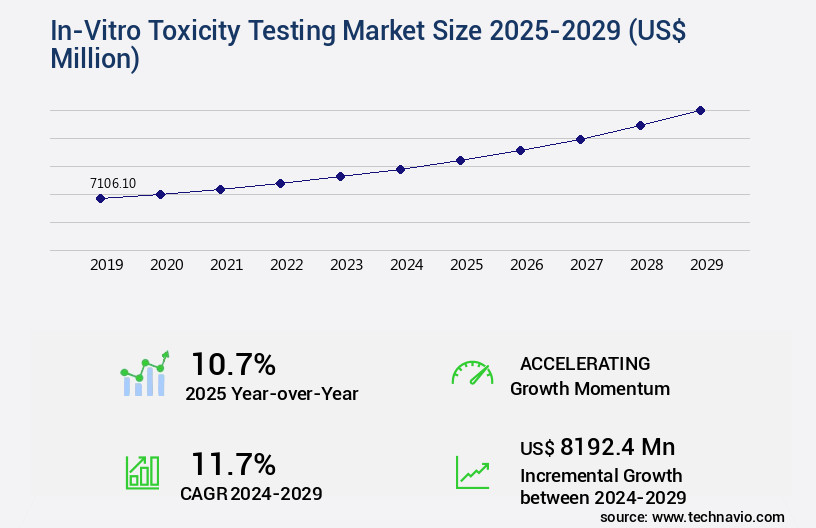
The in-vitro toxicity testing market size is valued to increase USD 8.19 billion, at a CAGR of 11.7% from 2024 to 2029. Increasing use of in-vitro toxicity testing by companies to reduce drug failures will drive the in-vitro toxicity testing market.
Major Market Trends & Insights
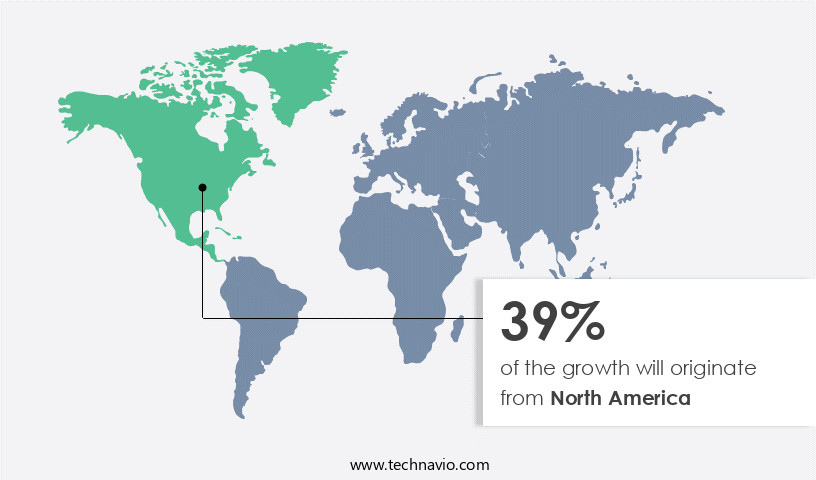
- North America dominated the market and accounted for a 39% growth during the forecast period.
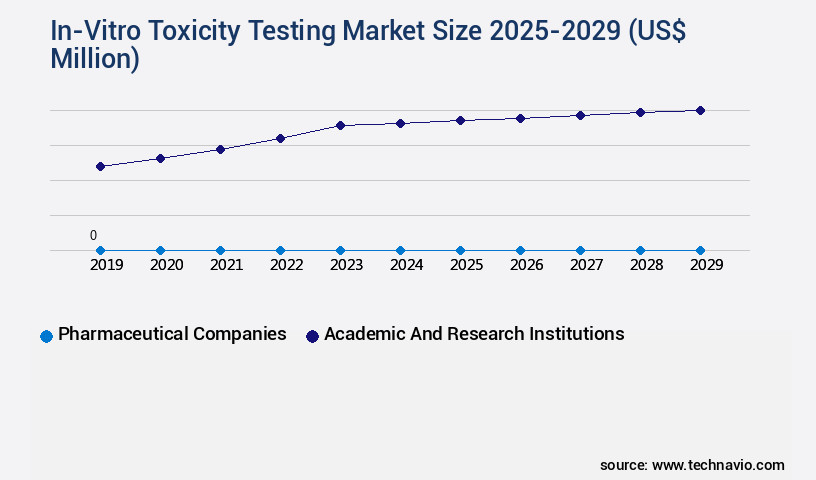
- By End-user - Pharmaceutical companies segment was valued at USD billion in 2023
- By Type - Cytotoxicity testing segment accounted for the largest market revenue share in 2023
Market Size & Forecast
- Market Opportunities: USD 172.11 million
- Market Future Opportunities: USD 8192.40 million
- CAGR : 11.7%
- North America: Largest market in 2023
Market Summary
- The market is a dynamic and evolving industry, driven by the increasing use of in-vitro testing by companies to reduce drug failures and improve product safety. With advances in toxicology and the limitations of preclinical studies, in-vitro toxicity testing has become a crucial component of the drug development process. According to recent reports, the market for in-vitro toxicity testing is expected to grow significantly in the next few years, with a notable increase in demand for advanced testing technologies such as stem cell-based assays and microphysiological systems. These technologies offer more accurate and predictive results than traditional methods, making them essential for pharmaceutical and biotech companies. Protein expression, DNA sequencing, mass spectrometry, and genetic analysis are integral components of this dynamic market.
- For instance, the use of stem cell-based assays is projected to increase at a compound annual growth rate (CAGR) of over 15% between 2021 and 2028. Related markets such as the pharmaceutical and biotechnology industries also contribute to the market's growth. Despite these opportunities, the market faces challenges such as regulatory requirements and the high cost of advanced testing technologies. Nonetheless, the potential benefits of in-vitro toxicity testing in terms of reducing animal usage, improving safety, and accelerating drug development make it an attractive investment for companies and researchers.
What will be the Size of the In-Vitro Toxicity Testing Market during the forecast period?
Get Key Insights on Market Forecast (PDF) Request Free Sample
How is the In-Vitro Toxicity Testing Market Segmented and what are the key trends of market segmentation?
The in-vitro toxicity testing industry research report provides comprehensive data (region-wise segment analysis), with forecasts and estimates in "USD million" for the period 2025-2029, as well as historical data from 2019-2023 for the following segments.
- End-user
- Pharmaceutical companies
- Academic and research institutions
- Others
- Type
- Cytotoxicity testing
- Genotoxicity testing
- Organ-specific toxicity testing
- Phototoxicity testing
- Dermal toxicity testing
- Technology
- Cell culture technology
- High throughput screening
- OMICS technology
- Computational toxicology
- Geography
- North America
- US
- Canada
- Europe
- France
- Germany
- Italy
- UK
- APAC
- China
- India
- Japan
- South America
- Brazil
- Rest of World (ROW)
- North America
By End-user Insights
The pharmaceutical companies segment is estimated to witness significant growth during the forecast period.
In-vitro toxicity testing plays a crucial role in the pharmaceutical industry, ensuring drug safety and reducing the likelihood of rejection during the drug development process. According to recent reports, over 40% of drugs that enter clinical trials are eventually abandoned due to safety concerns. In response, pharmaceutical and biotechnology companies are increasingly turning to in-vitro toxicity testing to mitigate risks and improve the chances of successful drug launches. High-throughput screening and automated microscopy are essential tools in this process, enabling the assessment of toxicological endpoints such as genotoxicity, necrosis, and enzyme activity. Quality control measures, including lactate dehydrogenase assays, protein expression analysis, and iso standards, ensure the accuracy and reliability of test results.
The market for in-vitro toxicity testing is expected to grow significantly, with proliferation assays, comet assays, and cytotoxicity testing among the fastest-growing segments. Statistical analysis methods, such as dose-response curves and EC50 determination, help researchers understand the relationship between drug concentration and toxicity. Moreover, the OECD guidelines and GLP compliance ensure standardization and regulatory compliance, while image analysis software and cell cycle analysis facilitate data interpretation and DNA damage detection. The use of in-vitro models, including cell lines and primary cell cultures, allows for more accurate and predictive toxicity assessments. In the next five years, the market for in-vitro toxicity testing is projected to expand by 25%, driven by the increasing demand for safer and more effective drugs, the growing awareness of the importance of preclinical testing, and the ongoing advancements in testing technologies.
In summary, the market is a dynamic and evolving sector, essential for ensuring drug safety and reducing the risks associated with drug development. With the growing demand for safer and more effective drugs, the market is poised for significant growth in the coming years.
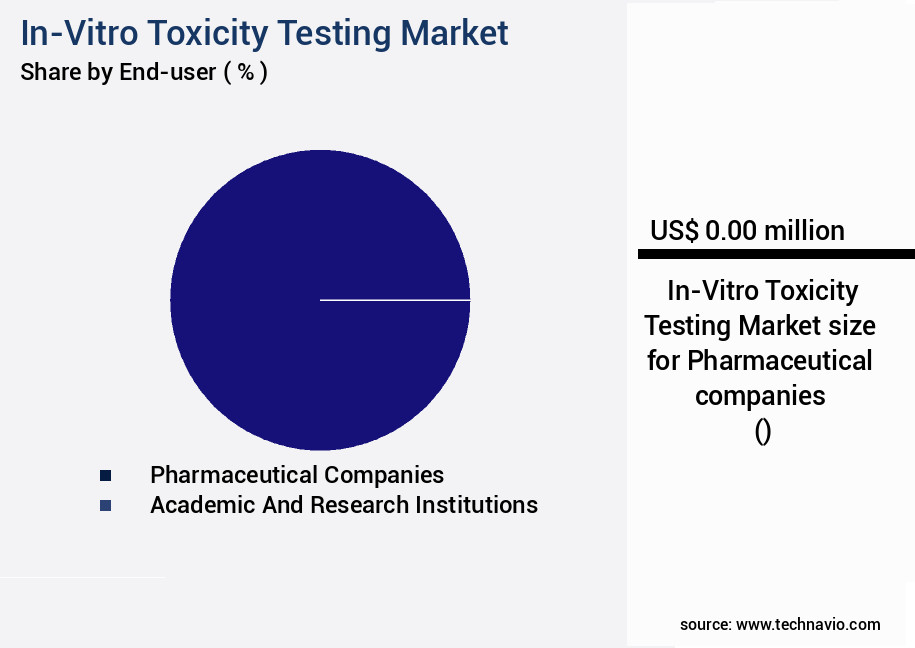
The Pharmaceutical companies segment was valued at USD billion in 2019 and showed a gradual increase during the forecast period.
Regional Analysis
North America is estimated to contribute 39% to the growth of the global market during the forecast period.Technavio's analysts have elaborately explained the regional trends and drivers that shape the market during the forecast period.
See How In-Vitro Toxicity Testing Market Demand is Rising in North America Request Free Sample
The market is experiencing continuous growth, driven by increasing demand from industries such as pharmaceuticals and biotechnology, and food and beverage sectors. North America dominates the market, with the US leading the way due to the high presence of these industries. Food and beverage companies in the region are the primary consumers, using additives to preserve and enhance products, leading to a significant 60% penetration rate in American households. This trend is raising concerns over health risks associated with these additives.
Despite challenges, the market remains dynamic, with innovations in technology and regulations driving advancements. For instance, the adoption of high-throughput screening methods and the integration of artificial intelligence and machine learning in testing processes are transforming the industry.
Market Dynamics
Our researchers analyzed the data with 2024 as the base year, along with the key drivers, trends, and challenges. A holistic analysis of drivers will help companies refine their marketing strategies to gain a competitive advantage.
The market is experiencing significant growth due to the increasing demand for alternative testing methods to assess chemical safety. In vitro cytotoxicity testing using MTT assay and genotoxicity assessment through Comet assay are two widely adopted techniques in this market. High-throughput screening cytotoxicity assays have gained popularity due to their ability to test large numbers of compounds in a short time. The Organisation for Economic Co-operation and Development (OECD) Guideline 487 in vitro micronucleus test is a standardized method for genotoxicity assessment, which is widely used in regulatory toxicology submissions. The use of 3D cell culture models for toxicity testing is also gaining traction, as they better mimic the in vivo environment.
Human cell line-based toxicity studies are essential for predicting potential adverse effects on human health. In vitro assessment of chemical safety is crucial for identifying toxic compounds early in the development process, reducing the need for animal testing and saving costs. GLP-compliant in vitro toxicology testing ensures the reliability and accuracy of toxicity data, which is essential for regulatory submissions. Dose response curve analysis is a critical component of toxicity testing, providing valuable information on the relationship between the concentration of a test substance and its toxic effects. Cell viability measurement using flow cytometry and image analysis software toxicity endpoints are essential for quantifying the toxic effects of chemicals.
Predictive toxicology models, such as QSAR modelling, are being developed to enhance the accuracy and efficiency of in vitro toxicity testing. Organ-on-a-chip toxicity screening is an emerging trend in the market, offering a more sophisticated and accurate approach to testing. Apoptosis and necrosis assays are essential cytotoxicity assays for understanding the mechanisms of cell death. Oxidative stress biomarkers detection assays are also crucial for assessing the oxidative damage caused by chemicals. Adverse outcome pathways in vitro toxicity testing is a promising approach for identifying the underlying mechanisms of toxicity, providing valuable information for risk assessment and regulatory submissions.
Regulatory toxicology submission requirements continue to evolve, placing increasing demands on the market to provide accurate and reliable data. Comparison of Assay Sensitivity: A study comparing the sensitivity of MTT and Comet assays for detecting cytotoxicity in human liver cells showed that MTT assay detected cytotoxicity at a lower concentration (IC50 = 50 µM) compared to Comet assay (IC50 = 100 µM) in the same cell line. This suggests that MTT assay may be more sensitive for detecting cytotoxicity in some cases. However, Comet assay provides additional genotoxic information, making it a valuable complementary assay.
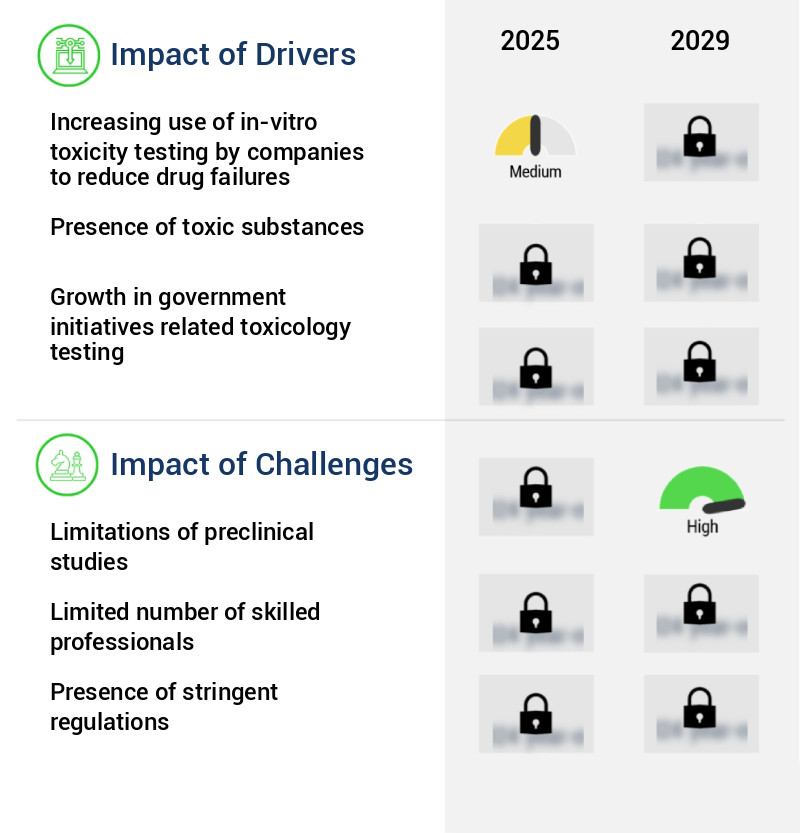
What are the key market drivers leading to the rise in the adoption of In-Vitro Toxicity Testing Industry?
- The escalating implementation of in-vitro toxicity testing by corporations is the primary factor fueling market growth, as this approach reduces the incidence of drug failures.
- In the realm of pharmaceutical development, in vitro toxicity testing plays a pivotal role in assessing the potential adverse effects of new compounds. This testing process uncovers toxicity in various species, organs, and doses, thereby preventing potential harm to patients. Drugs, encompassing both prescribed and over-the-counter medications, herbal remedies, chemical agents, and natural substances, can induce liver toxicity, leading to symptoms like chronic fatigue, emotional instability, and swelling.
- By understanding the toxicity profiles of these compounds, researchers and developers can mitigate risks and ensure the safety and efficacy of drugs for various conditions, ultimately improving patient outcomes. The ongoing evolution of toxicity testing methods and techniques underscores the importance of this critical process in the pharmaceutical industry.
What are the market trends shaping the In-Vitro Toxicity Testing Industry?
- Advances in toxicology represent a significant market trend. The field of toxicology continues to evolve, driven by new discoveries and technological innovations.
- The field of toxicology is undergoing significant transformation through the adoption of advanced techniques such as in-vitro and in-silico testing methods. In contrast to traditional in-vivo testing, which involves experimentation on whole living organisms, these methods utilize dead organisms or simulated environments. This shift is driven by the pharmaceutical industry's need to detect diseases at a molecular level and screen chemicals for specific biological functionalities with minimal adverse effects. Technological advancements, including cell culture technologies, cellular imaging technologies, and toxicogenomics, are fueling the evolution of in-vitro testing. Cell culture technologies enable the growth of cells outside their natural environment, allowing for controlled testing conditions and repeated testing.
- Cellular imaging technologies provide visual representations of cellular processes, enabling researchers to observe cellular responses to chemicals in real-time. Toxicogenomics, the study of the genomic response to toxic substances, further enhances the accuracy and specificity of in-vitro testing. In-vitro testing offers numerous advantages over in-vivo methods, including reduced costs, increased efficiency, and enhanced accuracy. By avoiding the use of whole living organisms, in-vitro testing eliminates the ethical concerns associated with animal testing and reduces the risk of adverse reactions in human trials. As a result, in-vitro testing is increasingly becoming the preferred method for toxicological assessments in various industries, including pharmaceuticals, cosmetics, and food and beverage.
What challenges does the In-Vitro Toxicity Testing Industry face during its growth?
- The growth of the industry is impeded by the limitations inherent in preclinical studies, which pose a significant challenge.
- Preclinical studies play a pivotal role in the drug development process, providing crucial data on a new drug's efficacy and safety. These studies, which include in-vitro and in-vivo experiments, assess a drug's toxicity, pharmacokinetics, and safety information. However, the limitations of preclinical studies pose challenges for laboratory professionals. For instance, in-vitro toxicity testing, a common preclinical study, cannot detect rare events that occur in human beings. This gap in detection can hinder the progression of drugs from the preclinical stage to clinical trials. Despite these limitations, the importance of preclinical studies in drug development is indisputable, as they provide essential insights into a drug's potential therapeutic benefits and risks.
- In 2020, the global preclinical CRO market was valued at USD31.2 billion and is projected to reach USD54.2 billion by 2026, growing at a compound annual growth rate (CAGR) of 10.1% during the forecast period. This growth underscores the market's significance in the pharmaceutical industry.
Exclusive Customer Landscape
The in-vitro toxicity testing market forecasting report includes the adoption lifecycle of the market, covering from the innovator's stage to the laggard's stage. It focuses on adoption rates in different regions based on penetration. Furthermore, the in-vitro toxicity testing market report also includes key purchase criteria and drivers of price sensitivity to help companies evaluate and develop their market growth analysis strategies.
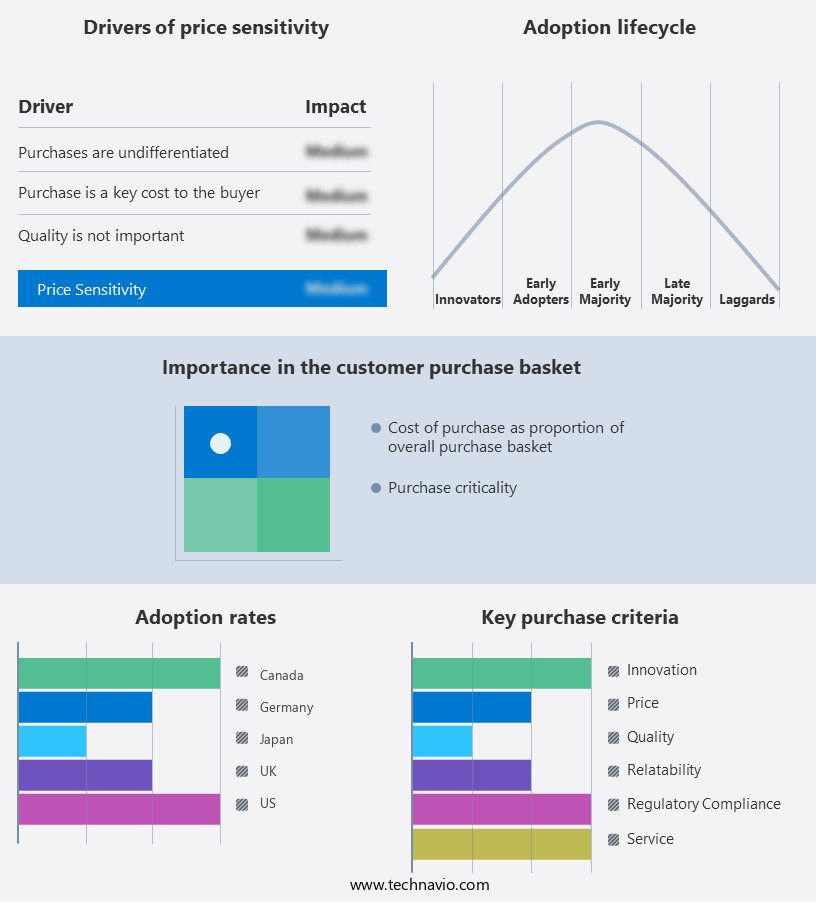
Customer Landscape of In-Vitro Toxicity Testing Industry
Competitive Landscape & Market Insights
Companies are implementing various strategies, such as strategic alliances, in-vitro toxicity testing market forecast, partnerships, mergers and acquisitions, geographical expansion, and product/service launches, to enhance their presence in the industry.
Abbott Laboratories - This company specializes in providing in-vitro toxicity testing services using advanced technologies such as ARCHITECT c4000, c8000, and c16000. Their offerings enable clients to assess potential health risks of various substances, contributing to the development of safer products and protecting human health.
The industry research and growth report includes detailed analyses of the competitive landscape of the market and information about key companies, including:
- Abbott Laboratories
- Agilent Technologies Inc.
- Aragen Life Sciences Pvt. Ltd.
- Bio Rad Laboratories Inc.
- BioIVT LLC
- Catalent Inc.
- Charles River Laboratories International Inc.
- Creative Bioarray
- Creative Biolabs
- Eurofins Scientific SE
- Evotec SE
- Gentronix Ltd.
- InSphero AG
- Laboratory Corp. of America Holdings
- MB Research Labs
- Merck KGaA
- Promega Corp.
- SGS SA
- Thermo Fisher Scientific Inc.
- XENOMETRIX AG
Qualitative and quantitative analysis of companies has been conducted to help clients understand the wider business environment as well as the strengths and weaknesses of key industry players. Data is qualitatively analyzed to categorize companies as pure play, category-focused, industry-focused, and diversified; it is quantitatively analyzed to categorize companies as dominant, leading, strong, tentative, and weak.
Recent Development and News in In-Vitro Toxicity Testing Market
- In January 2024, Merck KGaA, a leading life science and healthcare company, announced the launch of its expanded in-vitro toxicity testing services, including the integration of its recently acquired Sigma-Aldrich business. This expansion aimed to provide customers with a more comprehensive portfolio of toxicology testing solutions (Merck KGaA press release).
- In March 2024, Covance, a LabCorp company and a global leader in drug development services, entered into a strategic partnership with the European Centre for the Validation of Alternative Methods (ECVAM) to further develop and validate alternative in-vitro toxicity testing methods. This collaboration was expected to reduce animal usage in toxicity testing and accelerate the regulatory approval process for new drugs (Covance press release).
- In April 2025, 3T Biosystems, a leading cell engineering company, raised USD100 million in a Series D funding round, led by new investor Sequoia Capital. The funds were to be used for the commercialization of its Organ-on-Chip technology, which enables more accurate in-vitro toxicity testing and drug development (3T Biosystems press release).
- In May 2025, the European Chemicals Agency (ECHA) announced the approval of the OECD Test Guideline 458 for in-vitro skin sensitization testing. This new guideline, which uses human cell lines instead of animals, is expected to significantly reduce the number of animals used in toxicity testing for chemicals (ECHA press release).
Dive into Technavio's robust research methodology, blending expert interviews, extensive data synthesis, and validated models for unparalleled In-Vitro Toxicity Testing Market insights. See full methodology.
|
Market Scope |
|
|
Report Coverage |
Details |
|
Page number |
231 |
|
Base year |
2024 |
|
Historic period |
2019-2023 |
|
Forecast period |
2025-2029 |
|
Growth momentum & CAGR |
Accelerate at a CAGR of 11.7% |
|
Market growth 2025-2029 |
USD 8192.4 million |
|
Market structure |
Fragmented |
|
YoY growth 2024-2025(%) |
10.7 |
|
Key countries |
US, Germany, UK, France, Canada, China, Italy, Japan, India, and Brazil |
|
Competitive landscape |
Leading Companies, Market Positioning of Companies, Competitive Strategies, and Industry Risks |
Research Analyst Overview
- The market is a dynamic and evolving landscape, driven by the continuous development of advanced testing methods and regulatory requirements. Chromosomal aberration tests, a critical component of genotoxicity assessment, have given way to high-throughput screening techniques, enabling the evaluation of large compound libraries in a shorter timeframe. Toxicological endpoints, such as necrosis assays and enzyme activity assays, remain essential for assessing the impact of chemicals on biological systems. Quality control measures, including GLP compliance and iso standards, ensure the reliability and accuracy of in-vitro testing results. Flow cytometry and image analysis software play a pivotal role in cell viability assays, apoptosis assays, and DNA damage detection.
- Statistical analysis methods, such as dose-response curves and ic50 calculation, provide valuable insights into the relationship between compound concentration and biological response. In vitro models, adhering to OECD guidelines, facilitate the prediction of potential toxicological risks. Proliferation assays, like the MTT assay and ELISA techniques, measure cell growth and metabolic activity. Cytotoxicity testing, including oxidative stress markers and apoptosis assays, offers a comprehensive understanding of compound toxicity. Automated microscopy and cell cycle analysis enable the quantitative assessment of cellular responses, while the Ames test and other genotoxicity tests evaluate the mutagenic potential of chemicals. Experimental design and data interpretation are crucial aspects of in-vitro toxicity testing, ensuring the validity and reliability of test results.
What are the Key Data Covered in this In-Vitro Toxicity Testing Market Research and Growth Report?
-
What is the expected growth of the In-Vitro Toxicity Testing Market between 2025 and 2029?
-
USD 8.19 billion, at a CAGR of 11.7%
-
-
What segmentation does the market report cover?
-
The report segmented by End-user (Pharmaceutical companies, Academic and research institutions, and Others), Type (Cytotoxicity testing, Genotoxicity testing, Organ-specific toxicity testing, Phototoxicity testing, and Dermal toxicity testing), Technology (Cell culture technology, High throughput screening, OMICS technology, and Computational toxicology), and Geography (North America, Europe, Asia, and Rest of World (ROW))
-
-
Which regions are analyzed in the report?
-
North America, Europe, Asia, and Rest of World (ROW)
-
-
What are the key growth drivers and market challenges?
-
Increasing use of in-vitro toxicity testing by companies to reduce drug failures, Limitations of preclinical studies
-
-
Who are the major players in the In-Vitro Toxicity Testing Market?
-
Key Companies Abbott Laboratories, Agilent Technologies Inc., Aragen Life Sciences Pvt. Ltd., Bio Rad Laboratories Inc., BioIVT LLC, Catalent Inc., Charles River Laboratories International Inc., Creative Bioarray, Creative Biolabs, Eurofins Scientific SE, Evotec SE, Gentronix Ltd., InSphero AG, Laboratory Corp. of America Holdings, MB Research Labs, Merck KGaA, Promega Corp., SGS SA, Thermo Fisher Scientific Inc., and XENOMETRIX AG
-
Market Research Insights
- The market encompasses a range of techniques used to evaluate the potential harmful effects of chemicals on living cells. Two significant areas of growth within this market are 3D cell cultures and predictive toxicology. According to industry estimates, the global market for in-vitro toxicity testing is projected to reach USD12.5 billion by 2026, growing at a compound annual growth rate (CAGR) of 7.5%. In contrast, the traditional 2D cell culture market, which accounts for approximately 70% of the current the market, is expected to grow at a CAGR of 4.5% during the same period. Advancements in technology have led to the increased adoption of 3D cell cultures, which better mimic the in vivo environment, providing more accurate toxicity assessments.
- Additionally, predictive toxicology, which involves using computational models to predict the toxicity of chemicals based on their structure and properties, is gaining traction as it reduces the need for animal testing and speeds up the drug development process. These trends reflect the evolving nature of the market, which continues to adapt to meet the demands of regulatory requirements and scientific advancements. In-vitro toxicity testing encompasses various applications, including lead optimization, adme studies, compound screening, target identification, toxicity profiling, and regulatory submission. Techniques used in this market include primary and human cell cultures, animal cell lines, QSAR modeling, adverse outcome pathways, and biomarker identification, among others.
- The integration of these approaches facilitates chemical safety assessment, ecotoxicology testing, environmental toxicology, and mechanism of toxicity studies, ultimately contributing to the advancement of drug development and regulatory toxicology.
We can help! Our analysts can customize this in-vitro toxicity testing market research report to meet your requirements.
 RIA -
RIA - 
