
Industrial Services Market Size 2025-2029
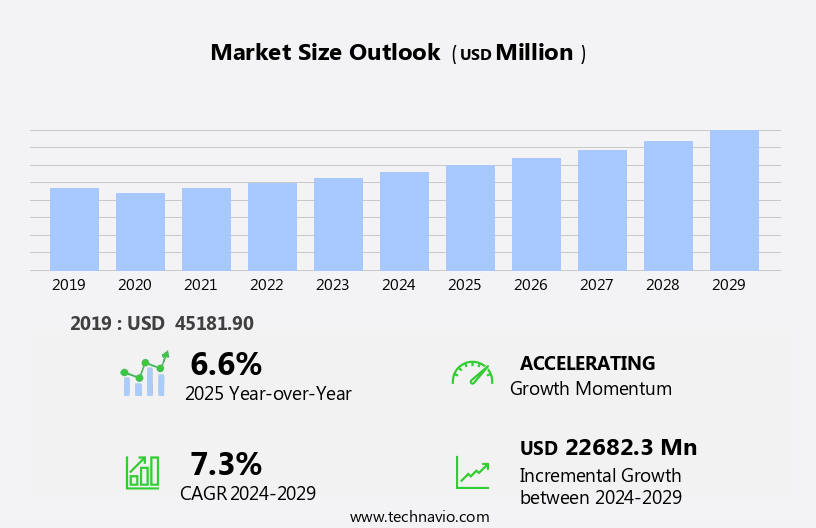
The industrial services market size is forecast to increase by USD 22.68 billion, at a CAGR of 7.3% between 2024 and 2029.
- The market is experiencing significant shifts driven by the increasing emphasis on predictive maintenance and the growing demand for end-to-end quality and process control. These trends reflect the industry's ongoing transformation towards more efficient, data-driven operations. However, companies face challenges in implementing these strategies due to the lack of technical expertise within their workforce. This skills gap poses a significant obstacle to effective implementation and may hinder market growth. Cloud computing facilitates real-time data collection and analysis, allowing for quicker responses to potential issues.
- To capitalize on the opportunities presented by predictive maintenance and quality control, industrial services providers must invest in upskilling their workforce or partnering with specialized technology companies. By addressing these challenges and embracing technological advancements, companies can differentiate themselves in a competitive market and deliver superior value to their clients. For instance, a leading manufacturing company reported a 15% reduction in maintenance costs by implementing a predictive maintenance system and integrating smart sensor technologies into their operations.
What will be the Size of the Industrial Services Market during the forecast period?
Explore in-depth regional segment analysis with market size data - historical 2019-2023 and forecasts 2025-2029 - in the full report.
Request Free Sample
The market continues to evolve, driven by the adoption of advanced technologies and strategies to optimize operations and enhance efficiency across various sectors. Preventative maintenance strategies, fueled by predictive modeling techniques and machine learning models, are increasingly prioritized to minimize downtime and extend equipment lifecycle. Advanced analytics techniques, such as time-series forecasting models and performance monitoring tools, provide valuable insights into industrial processes, enabling process optimization and energy efficiency audits. Cloud-based service platforms offer remote diagnostics capabilities, safety compliance audits, and field service management, ensuring industrial automation solutions operate at optimal levels.
Industrial IoT platforms facilitate remote asset monitoring and robotics integration services, enabling AI-driven maintenance and operational efficiency metrics to be tracked in real-time. Risk management protocols, including predictive maintenance systems and automated inspection systems, minimize potential hazards and ensure regulatory compliance. According to recent industry reports, the market is expected to grow by over 5% annually, driven by the increasing demand for operational excellence and digital transformation in manufacturing and energy sectors. Inventory management systems, integrated with digital twin technology and real-time equipment tracking, enable just-in-time supply chain optimization.
How is this Industrial Services Industry segmented?
The industrial services industry research report provides comprehensive data (region-wise segment analysis), with forecasts and estimates in "USD million" for the period 2025-2029, as well as historical data from 2019-2023 for the following segments.
- End-user
- Oil and gas
- Chemicals
- Aerospace
- Automotive
- Others
- Type
- Engineering and consulting
- Installation and commissioning
- Operational improvement and maintenance
- Application
- Distributed control system
- Programmable controller logic
- Supervisory control and data acquisition
- Electric motors and drives
- Others
- Geography
- North America
- US
- Canada
- Europe
- France
- Germany
- UK
- APAC
- China
- India
- Japan
- South Korea
- South America
- Brazil
- Rest of World (ROW)
- North America
By End-user Insights
The Oil and gas segment is estimated to witness significant growth during the forecast period. The market is witnessing significant growth due to the increasing adoption of preventative maintenance strategies and advanced analytics techniques. Cloud-based service platforms and digital twin technology enable real-time equipment tracking and predictive maintenance systems, reducing downtime and optimizing operational efficiency. Inventory management systems and machine learning models facilitate just-in-time supply chain optimization and energy efficiency audits. Safety compliance audits and risk management protocols ensure regulatory adherence and minimize potential hazards. Industrial automation solutions, including robotics integration services and automated inspection systems, streamline processes and enhance productivity.
Asset performance management and process optimization techniques optimize equipment lifecycle management and improve overall performance. The oil and gas segment, which held the largest market share in 2024, is expected to continue its dominance due to the need to minimize unplanned downtime and optimize operational efficiency. According to recent research, the market is projected to grow by 5% annually over the next five years, driven by the increasing demand for industrial services in various industries. For instance, a leading oil and gas company reported a 15% decrease in maintenance costs after implementing predictive maintenance systems and a 10% increase in production efficiency.
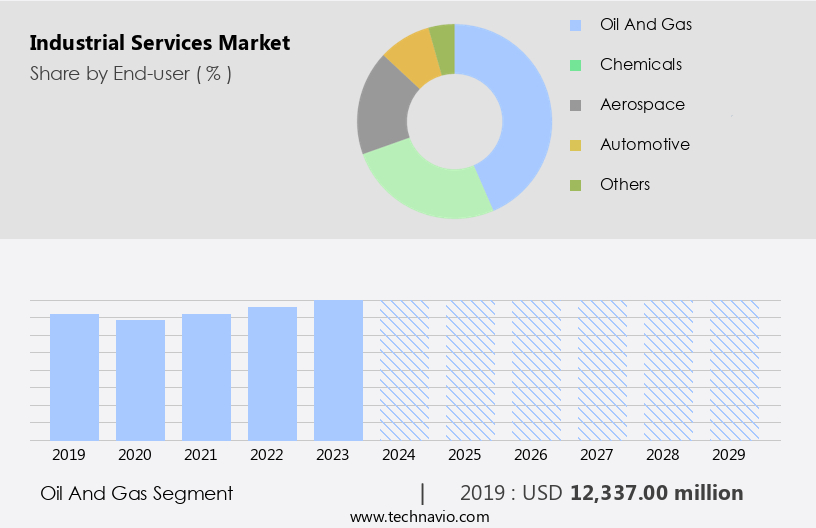
The Oil and gas segment was valued at USD 12.34 billion in 2019 and showed a gradual increase during the forecast period.
The Industrial Services Market is advancing rapidly, driven by the adoption of digital tools and automation technologies. Data analytics dashboards provide real-time insights, helping businesses optimize performance and decision-making. Facility management software and maintenance scheduling software enhance operational efficiency by streamlining asset monitoring and repair timelines. Efficient work order management ensures timely task execution, improving productivity. Companies are also focusing on downtime reduction strategies to minimize disruptions and maximize equipment availability. As digital integration increases, the need for robust cybersecurity for industrial systems becomes critical to protect sensitive operational data and infrastructure.
The Industrial Services Market is experiencing steady growth as companies prioritize operational efficiency and performance. A key focus is on minimizing the total cost of ownership by extending asset life and reducing maintenance expenses. Through advanced technologies, businesses are achieving production optimization, maximizing output while maintaining quality standards. The integration of analytics enables data-driven decision making, allowing real-time insights into operations and performance. Additionally, enhanced field operations support ensures that on-site teams have the tools and information needed for efficient task execution and rapid issue resolution.
Regional Analysis
APAC is estimated to contribute 42% to the growth of the global market during the forecast period. Technavio's analysts have elaborately explained the regional trends and drivers that shape the market during the forecast period.
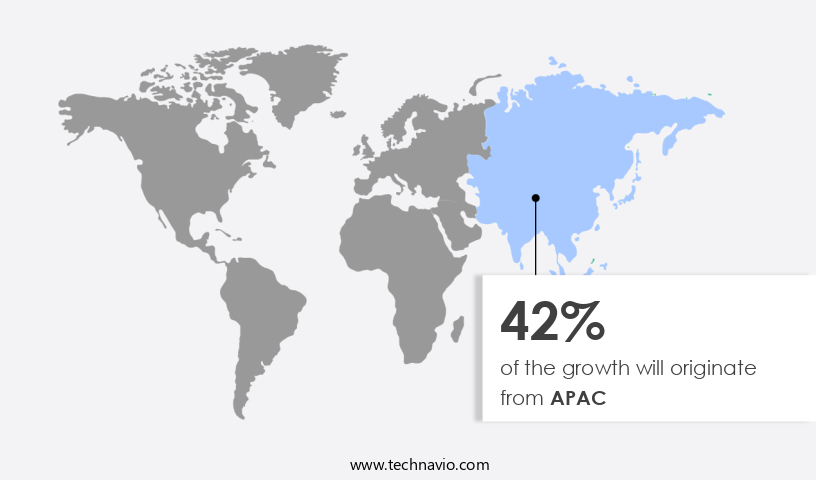
In APAC, manufacturing industries are increasingly adopting industrial services to streamline intricate production processes and enhance operational efficiency. The escalating scale of operations across various sectors has led to more complex supply chains, prompting established companies to collaborate with system integrators for automation services. This strategic move not only broadens their market reach but also aids in consolidating the fragmented industrial automation services market in APAC. Industrial IoT platforms, predictive maintenance systems, and real-time equipment tracking are among the advanced technologies gaining traction in this context.
For instance, a leading automotive manufacturer in China reported a 20% reduction in downtime by implementing predictive maintenance strategies. Furthermore, the market in APAC is projected to expand by 15% over the next five years, underpinned by the integration of digital twin technology, machine learning models, and performance monitoring tools.
Market Dynamics
Our researchers analyzed the data with 2024 as the base year, along with the key drivers, trends, and challenges. A holistic analysis of drivers will help companies refine their marketing strategies to gain a competitive advantage.
What are the key market drivers leading to the rise in the adoption of Industrial Services Industry?
- The growing adoption of advanced solutions like distributed control systems and industrial robotics to enhance equipment efficiency, reduce costs, and enable centralized monitoring is driving the Industrial Services Market. End-users require a deep understanding of automation systems and regular servicing to maintain optimal industrial operations. The absence of this knowledge often discourages end-users from implementing automation systems, leading to operational inefficiencies. This hesitation stems from the perceived capital loss during maintenance downtime. Industrial services offer a wide range of applications, such as programmable logic controllers, distributed control systems, human-machine interfaces, manufacturing execution systems, as well as industrial robotics applications, to end-users. These applications help in improving every aspect of the manufacturing facility besides enhancing the life of equipment and systems in the manufacturing industry.
- According to a recent study, the market is projected to grow by over 5% annually, driven by the increasing adoption of automation and digitalization in various industries. For instance, a manufacturing company in a developing country that implemented predictive maintenance solutions experienced a 20% reduction in downtime and a corresponding increase in production output. Furthermore, distributed control systems allow centralized control of the system, as well as monitoring and reporting from a central individual component. This improves the overall efficiency of equipment and systems in the manufacturing facility. Owing to these benefits, the demand for industrial services is expected to increase, thereby driving the growth of the global industrial services market during the forecast period.
What are the market trends shaping the Industrial Services Industry?
- Predictive maintenance is gaining increasing importance in the market trend. This approach focuses on using data and advanced analytics to anticipate equipment failures before they occur. Consequently, industries like automotive and food and beverage have embraced predictive maintenance, which not only decreases production-related downtime but also enhances operational efficiency. According to the latest research, the market for IoT in industrial services is projected to grow by 25% in the upcoming year.
- The market has witnessed significant growth in recent years, driven by the increasing adoption of Internet of Things (IoT) technology. IoT-enabled devices, such as wireless acoustic transmitters and steam trap monitors, have become essential tools for monitoring plant operations and collecting data for analysis. This data enables industrial operators to compare the efficiency and performance of various machines, leading to better planning of maintenance activities and a reduction in unplanned downtime due to machine failure.
What challenges does the Industrial Services Industry face during its growth?
- The absence of end-to-end quality control and consistent processes is a significant challenge impeding industry expansion. For instance, subpar products may lead to costly repairs and reputational damage. According to recent market research, the industrial services industry is projected to expand by over 15% in the next five years, demonstrating the market's resilience and potential for growth despite these challenges.
- The market faces a substantial hurdle in its expansion due to the absence of comprehensive end-to-end processes and stringent quality control when outsourcing critical business functions to service providers. This apprehension arises from the potential loss of oversight and control along the value chain. The lack of quality assurance and adherence to compliance standards in industrial services, such as engineering services, can result in significant consequences, including the infringement of stakeholders' rights, particularly those of end-users.
Exclusive Customer Landscape
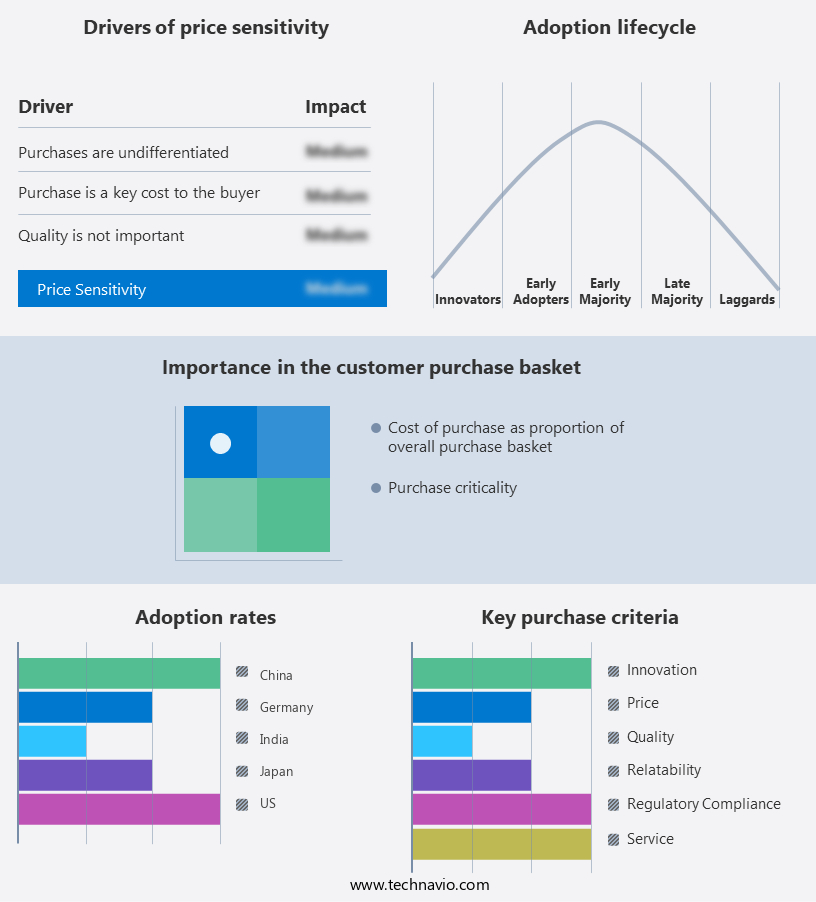
The industrial services market forecasting report includes the adoption lifecycle of the market, covering from the innovator's stage to the laggard's stage. It focuses on adoption rates in different regions based on penetration. Furthermore, the industrial services market report also includes key purchase criteria and drivers of price sensitivity to help companies evaluate and develop their market growth analysis strategies.
Customer Landscape
Key Companies & Market Insights
Companies are implementing various strategies, such as strategic alliances, industrial services market forecast, partnerships, mergers and acquisitions, geographical expansion, and product/service launches, to enhance their presence in the industry.
AB SKF - The company specializes in industrial services and serves a global market, providing comprehensive solutions in bearings and units, seals, lubrication, and maintenance.
The industry research and growth report includes detailed analyses of the competitive landscape of the market and information about key companies, including:
- AB SKF
- ABB Ltd.
- Bilfinger SE
- Eaton Corp. plc
- EMCOR Group Inc.
- Emerson Electric Co.
- General Electric Co.
- Honeywell International Inc.
- Intech Environmental Ltd.
- John Wood Group PLC
- Leadec Holding BV and Co. KG
- Metso Outotec Corp.
- Mitsubishi Heavy Industries Ltd.
- Rockwell Automation Inc.
- SAMSON AG
- Schneider Electric SE
- Siemens AG
- USES Group
- Worley Ltd.
- Yokogawa Electric Corp.
Qualitative and quantitative analysis of companies has been conducted to help clients understand the wider business environment as well as the strengths and weaknesses of key industry players. Data is qualitatively analyzed to categorize companies as pure play, category-focused, industry-focused, and diversified; it is quantitatively analyzed to categorize companies as dominant, leading, strong, tentative, and weak.
Recent Development and News in Industrial Services Market
- In January 2024, ABB, a leading industrial technology company, announced the launch of its new digital services platform, "ABB Ability⢠Marketplace," aimed at facilitating the buying and selling of industrial digital services and applications (ABB Press Release, 2024). This initiative marked a significant shift towards digitalization in the industrial services sector.
- In March 2024, Siemens AG and Schneider Electric, two major industrial players, announced a strategic collaboration to develop integrated energy management solutions for industries (Siemens Press Release, 2024). This partnership aimed to enhance their offerings and better serve the growing demand for energy-efficient industrial services.
- In May 2024, Emerson Electric Company completed the acquisition of Aventics, a German industrial automation and mechanical engineering company, for approximately USD3.7 billion (Emerson Press Release, 2024). This acquisition expanded Emerson's portfolio in the industrial automation and valve market, strengthening its position in the industrial services sector.
- In January 2025, the European Union passed the "Green Deal Industrial Plan," which includes significant investments in green industrial technologies and services, and a commitment to achieving carbon neutrality by 2050 (European Commission Press Release, 2025). This policy change is expected to drive substantial growth in the European the market, focusing on cleaner and more sustainable industrial processes.
Research Analyst Overview
The market for industrial services continues to evolve, driven by the increasing adoption of advanced technologies and data-driven decision-making. Predictive analytics plays a pivotal role in inventory control and maintenance strategies, enabling preventive measures and reducing downtime. According to recent reports, the market is projected to grow by over 5% annually, fueled by the demand for operational excellence and return on investment. For instance, a leading manufacturing company implemented remote monitoring and data visualization to optimize its production processes, resulting in a 15% increase in asset utilization. Furthermore, digital transformation facilitates real-time compliance management, facility management, and service level agreements, ensuring operational efficiency and process automation.
Sustainability initiatives and resource optimization are also key priorities, with industrial automation and logistics optimization playing significant roles in reducing waste and improving supply chain visibility. Moreover, training and development, contract management, and technical support services are essential components of the industrial services landscape, ensuring a skilled workforce and effective risk mitigation. Smart factories and key performance indicators enable organizations to monitor and optimize their operations, while preventive maintenance and quality control metrics ensure consistent production output. Ultimately, the ongoing digital transformation and focus on operational efficiency are shaping the future of the market.
Dive into Technavio's robust research methodology, blending expert interviews, extensive data synthesis, and validated models for unparalleled Industrial Services Market insights. See full methodology.
|
Market Scope |
|
|
Report Coverage |
Details |
|
Page number |
241 |
|
Base year |
2024 |
|
Historic period |
2019-2023 |
|
Forecast period |
2025-2029 |
|
Growth momentum & CAGR |
Accelerate at a CAGR of 7.3% |
|
Market growth 2025-2029 |
USD 22.68 billion |
|
Market structure |
Fragmented |
|
YoY growth 2024-2025(%) |
6.6 |
|
Key countries |
US, China, Canada, Japan, Germany, India, South Korea, UK, Brazil, and France |
|
Competitive landscape |
Leading Companies, Market Positioning of Companies, Competitive Strategies, and Industry Risks |
What are the Key Data Covered in this Industrial Services Market Research and Growth Report?
- CAGR of the Industrial Services industry during the forecast period
- Detailed information on factors that will drive the growth and forecasting between 2025 and 2029
- Precise estimation of the size of the market and its contribution of the industry in focus to the parent market
- Accurate predictions about upcoming growth and trends and changes in consumer behaviour
- Growth of the market across APAC, North America, Europe, South America, and Middle East and Africa
- Thorough analysis of the market's competitive landscape and detailed information about companies
- Comprehensive analysis of factors that will challenge the industrial services market growth of industry companies
We can help! Our analysts can customize this industrial services market research report to meet your requirements.
 RIA -
RIA - 
