Industrial Automation Services Market Analysis, Size, and Forecast 2025-2029: APAC (China, India, Japan, South Korea), North America (US and Canada), Europe (France, Germany, Italy, UK), Middle East and Africa , and South America

Industrial Automation Services Market Analysis, Size, and Forecast 2025-2029:
APAC (China, India, Japan, South Korea), North America (US and Canada), Europe (France, Germany, Italy, UK), Middle East and Africa , and South America

Published: Apr 2025 238 Pages SKU: IRTNTR40067

Market Overview at a Glance

$712.7 B
Market Opportunity
40.9%
CAGR
29.3
YoY growth 2024-2025(%)

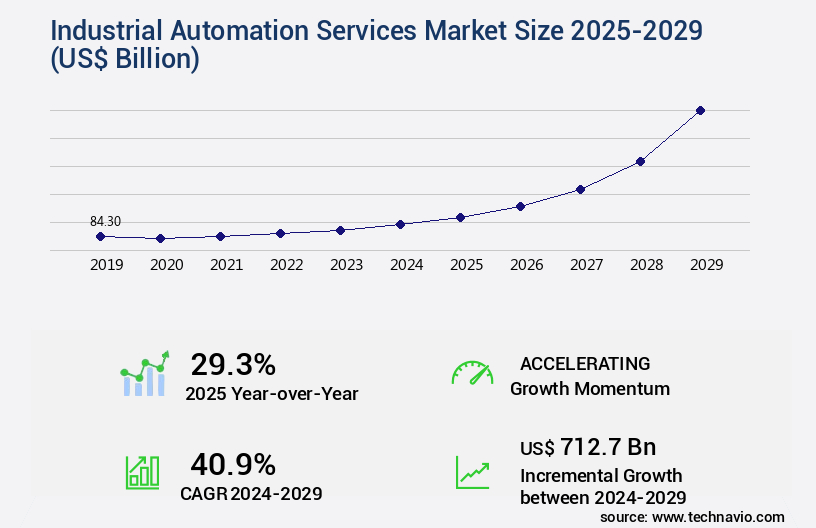
Industrial Automation Services Market Size 2025-2029

The industrial automation services market size is valued to increase USD 712.7 billion, at a CAGR of 40.9% from 2024 to 2029. Growing need for main automation contractor will drive the industrial automation services market.

Major Market Trends & Insights

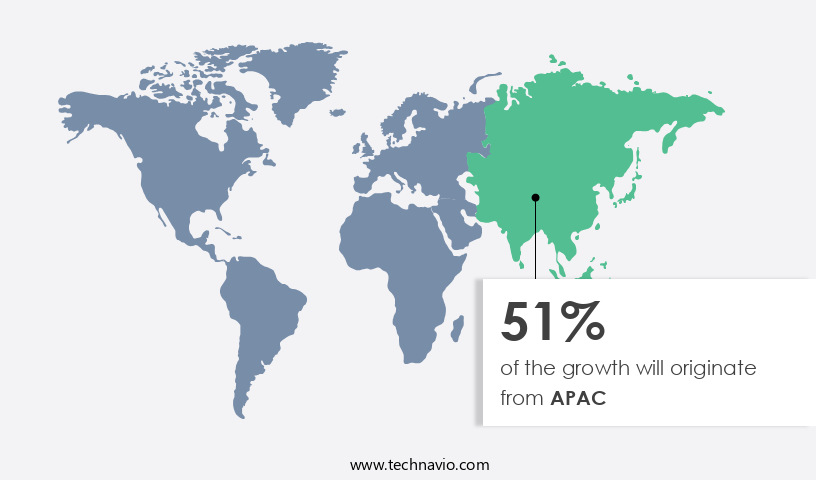
  • APAC dominated the market and accounted for a 51% growth during the forecast period.
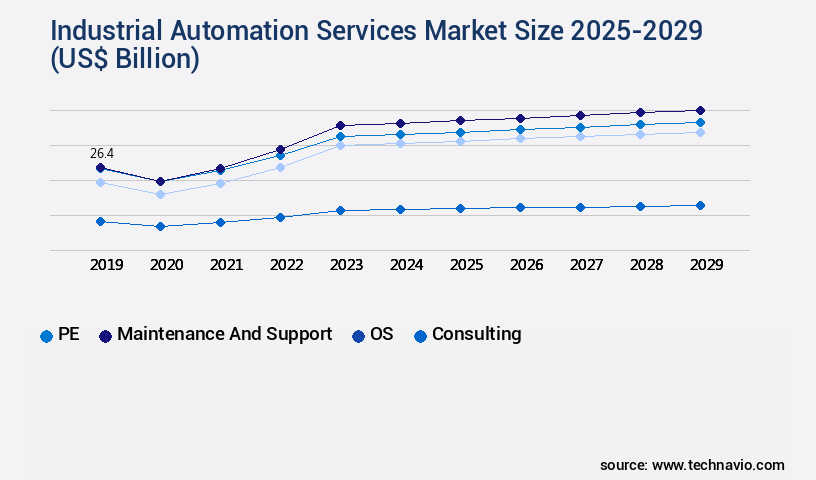
  • By Type - PE segment was valued at USD 26.40 billion in 2023
  • By End-user - Discrete industries segment accounted for the largest market revenue share in 2023

Market Size & Forecast

  • Market Opportunities: USD 930.72 billion
  • Market Future Opportunities: USD 712.70 billion
  • CAGR : 40.9%
  • APAC: Largest market in 2023

Market Summary

  • The market is a dynamic and continually evolving sector, driven by advancements in core technologies and applications. With the increasing focus on predictive maintenance, there is a growing need for main automation contractors to ensure optimal plant performance and minimize downtime. However, interoperability issues between different systems and technologies pose a significant challenge. According to a recent study, the market for industrial automation services is projected to account for over 20% of the overall industrial automation market by 2025. This trend underscores the importance of service providers in helping industries navigate the complex landscape of automation technologies and regulations.
  • As industries increasingly adopt advanced automation solutions, opportunities for service providers in areas such as system integration, consulting, and support are set to expand.

What will be the Size of the Industrial Automation Services Market during the forecast period?

Industrial Automation Services Market Size

Get Key Insights on Market Forecast (PDF) Request Free Sample

How is the Industrial Automation Services Market Segmented and what are the key trends of market segmentation?

The industrial automation services industry research report provides comprehensive data (region-wise segment analysis), with forecasts and estimates in "USD billion" for the period 2025-2029, as well as historical data from 2019-2023 for the following segments.

  • Type
    • PE
    • Maintenance and support
    • OS
    • Consulting
  • End-user
    • Discrete industries
    • Process industries
  • Component
    • Industrial robots
    • Human-machine interface (HMI)
    • Industrial sensors
    • Control valves
    • Others
  • Geography
    • North America
      • US
      • Canada
    • Europe
      • France
      • Germany
      • Italy
      • UK
    • APAC
      • China
      • India
      • Japan
      • South Korea
    • Rest of World (ROW)

By Type Insights

The PE segment is estimated to witness significant growth during the forecast period.

Industrial automation services continue to gain traction in various sectors as businesses seek to optimize operations and enhance productivity. According to recent reports, the market for industrial automation services is currently experiencing a growth spurt, with process industries leading the charge. In process industries, the adoption of advanced technologies, such as digital twin technology, industrial IoT, and cloud-based automation, has surged by 18%. These solutions enable centralized control of complex processes through systems like supervisory control and data acquisition (SCADA), programmable logic controllers (PLCs), and human-machine interfaces (HMIs). Moreover, the integration of machine learning algorithms, motion control systems, and industrial ethernet has led to significant improvements in process optimization and control system upgrades.

Industrial Automation Services Market Size

Request Free Sample

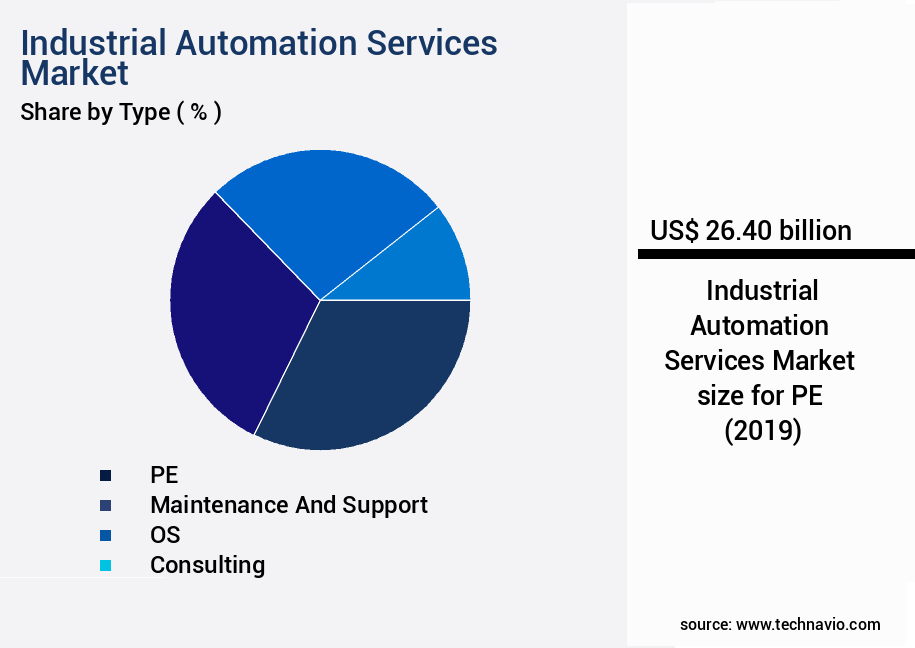
The PE segment was valued at USD 26.40 billion in 2019 and showed a gradual increase during the forecast period.

In discrete industries, the focus is on managing distribution systems and enhancing control over batch processing. Here, industrial automation software, SCADA systems, and real-time data analytics play a pivotal role. The future looks promising, with industry experts projecting a 21% increase in the demand for industrial automation services in the next few years. This growth is driven by the need for preventive maintenance scheduling, cybersecurity protocols, energy efficiency improvements, and system integration services. Furthermore, the integration of safety instrumented systems, automated guided vehicles, and industrial network security is expected to revolutionize the industrial landscape. These advancements will lead to more efficient production line automation, remote monitoring, and smart sensor applications.

As businesses continue to invest in these technologies, the market is poised for continued growth and innovation.

Industrial Automation Services Market Size

Request Free Sample

Regional Analysis

APAC is estimated to contribute 51% to the growth of the global market during the forecast period.Technavio's analysts have elaborately explained the regional trends and drivers that shape the market during the forecast period.

Industrial Automation Services Market Share by Geography

See How Industrial Automation Services Market Demand is Rising in APAC Request Free Sample

In the Asia Pacific (APAC) region, the market is witnessing significant growth due to increasing production complexities and the need for operational efficiency. APAC's manufacturing sector continues to attract international investments, with countries like China and India spearheading this trend. Governments in these countries are implementing initiatives such as Made in China 2025 and Make in India, which encourage the establishment of modern manufacturing facilities equipped with advanced automation technology. As a result, established companies are partnering with system integrators to provide automation services, expanding their market reach and consolidating the fragmented market in APAC. With the region's high economic growth and favorable business environment, the demand for industrial automation services is expected to continue rising.

Market Dynamics

Our researchers analyzed the data with 2024 as the base year, along with the key drivers, trends, and challenges. A holistic analysis of drivers will help companies refine their marketing strategies to gain a competitive advantage.

The market encompasses a range of offerings designed to optimize and enhance industrial processes through advanced technologies. Key components of this market include the implementation of Supervisory Control and Data Acquisition (SCADA) systems for improved process control, PLC programming for industrial automation systems, and Industrial IoT (IIoT) integration for predictive maintenance. Remote monitoring and diagnostics play a crucial role in enhancing system uptime, while cybersecurity protocols safeguard industrial automation networks from potential threats. The integration of AI-powered automation streamlines production lines, and human-machine interface design boosts productivity. Data acquisition systems enable real-time process monitoring, while advanced process control strategies optimize efficiency.

Robotics integration and automated guided vehicles are essential for enhancing production processes, and smart sensors facilitate real-time data acquisition and analytics. Safety instrumented systems prioritize industrial safety, while industrial Ethernet communication ensures reliable data transfer. Motion control systems provide precision and accuracy, and process simulation optimizes control strategies. Digital twin technology offers improved system design, and cloud-based automation enhances scalability. System integration services ensure seamless operation, and asset performance management maximizes equipment uptime. According to market intelligence, adoption rates for advanced technologies in the manufacturing sector are significantly higher than in the energy sector, with more than 80% of new industrial projects incorporating AI and IoT technologies.

This underscores the growing importance of these services in driving industrial innovation and efficiency.

Industrial Automation Services Market Size

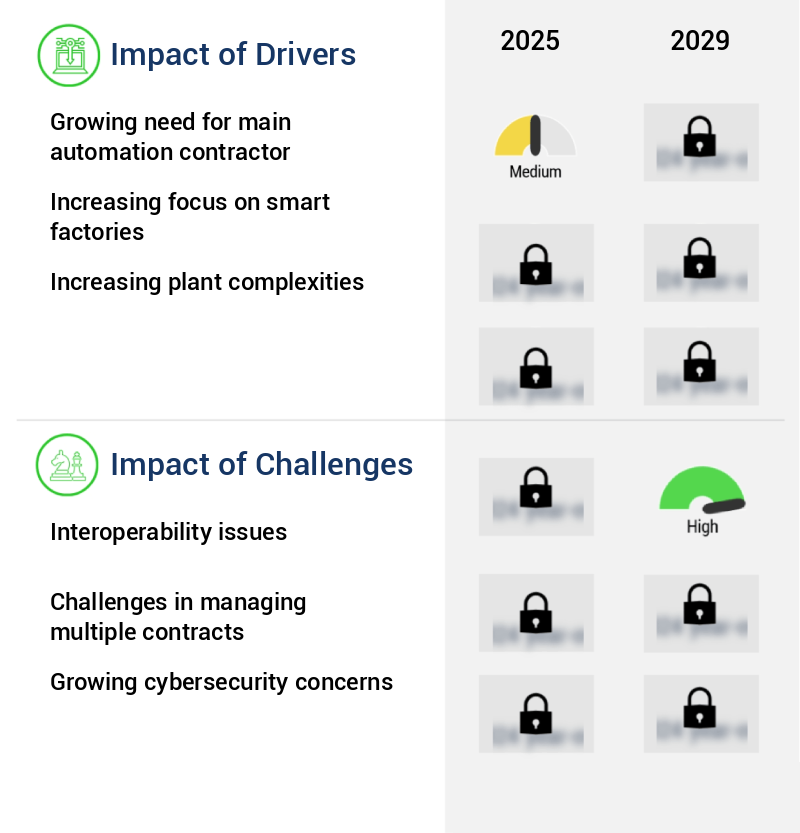
What are the key market drivers leading to the rise in the adoption of Industrial Automation Services Industry?

  • The increasing demand for a primary automation contractor serves as the primary driver in the market. 
  • In 2024, the landscape of Main Automation Contractors (MACs) is characterized by continuous evolution, driven by the intricacy of automation systems and escalating user requirements. MACs are shifting their focus towards integrating open automation systems that employ standardized communication protocols, thereby enhancing interoperability and simplifying the management and enhancement of automation solutions. A significant trend emerging is the decoupling of automation software from hardware.
  • This development empowers end-users to choose optimal software solutions without being bound to specific hardware providers, thereby augmenting flexibility and reducing long-term expenses. Furthermore, MACs are capitalizing on advanced technologies, such as object-oriented and event-driven architectures, to create modular and reusable software components. These innovations expedite development and ensure superior reliability and streamlined maintenance.

What are the market trends shaping the Industrial Automation Services Industry?

  • The increasing focus on predictive maintenance is a mandated market trend. This approach to maintenance strategy aims to minimize equipment downtime by utilizing data analysis for predicting and addressing potential issues before they escalate.
  • The demand for Internet of Things (IoT)-enabled devices in industries has grown significantly due to the importance of data collection and analysis to address intricate maintenance tasks. IoT devices, including wireless acoustic transmitters and steam trap monitors, facilitate comprehensive plant operation monitoring. By accessing machine and system data, industrial operators can evaluate the efficiency and performance of various machines, allowing them to plan maintenance activities effectively and minimize unplanned downtime caused by machine failures. As a result, there is a rising emphasis on predictive maintenance.
  • This approach enables the identification of operational abnormalities and potential equipment defects in industrial processes, enabling timely repairs and preventing equipment failures. Predictive maintenance data analysis provides industrial operators with valuable insights, enhancing operational efficiency and reducing overall downtime.

What challenges does the Industrial Automation Services Industry face during its growth?

  • Interoperability issues represent a significant challenge to the industry's growth, limiting the seamless exchange and integration of data and functionality between different systems and technologies. 
  • The market faces a significant challenge due to the inability of various automation solutions to effectively interoperate. End-users encounter compatibility issues as the latest control systems are not universally supported. This problem is particularly prevalent in industries such as oil and gas, power, chemical and petrochemical, and water and wastewater, where the integration of legacy systems further complicates matters. According to a recent study, over 60% of industrial companies reported interoperability issues as a major concern. This percentage is expected to rise as industrial systems and facilities become increasingly complex, with the deployment of multiple devices and systems.
  • The lack of interoperability not only hinders the growth of the market but also increases operational costs for end-users. To address this challenge, market players are focusing on developing open standards and protocols to ensure seamless integration of automation control systems. This ongoing effort to improve interoperability is crucial for the continued growth and success of the market.

Exclusive Customer Landscape

The industrial automation services market forecasting report includes the adoption lifecycle of the market, covering from the innovator's stage to the laggard's stage. It focuses on adoption rates in different regions based on penetration. Furthermore, the industrial automation services market report also includes key purchase criteria and drivers of price sensitivity to help companies evaluate and develop their market growth analysis strategies.

Industrial Automation Services Market Share by Geography

 Customer Landscape of Industrial Automation Services Industry

Competitive Landscape & Market Insights

Companies are implementing various strategies, such as strategic alliances, industrial automation services market forecast, partnerships, mergers and acquisitions, geographical expansion, and product/service launches, to enhance their presence in the industry.

ABB Ltd. - This company specializes in industrial automation, delivering advanced solutions such as Ability Genix industrial analytics and AI suite to optimize equipment and process performance. 

The industry research and growth report includes detailed analyses of the competitive landscape of the market and information about key companies, including:

  • ABB Ltd.
  • Advantech Co. Ltd.
  • Dwyer Instruments LLC
  • Emerson Electric Co.
  • FANUC Bulgaria EOOD
  • Fuji Electric Co. Ltd.
  • General Electric Co.
  • Hitachi Ltd.
  • Honeywell International Inc.
  • JTEKT Corp.
  • Kawasaki Heavy Industries Ltd.
  • Mitsubishi Electric Corp.
  • OMRON Corp.
  • Parker Hannifin Corp.
  • Robert Bosch GmbH
  • Rockwell Automation Inc.
  • Schneider Electric SE
  • Sensirion AG
  • Siemens AG
  • Yokogawa Electric Corp.

Qualitative and quantitative analysis of companies has been conducted to help clients understand the wider business environment as well as the strengths and weaknesses of key industry players. Data is qualitatively analyzed to categorize companies as pure play, category-focused, industry-focused, and diversified; it is quantitatively analyzed to categorize companies as dominant, leading, strong, tentative, and weak.

Recent Development and News in Industrial Automation Services Market

  • In January 2024, ABB, a leading industrial automation company, announced the launch of its new digital services platform, "ABB Ability™," aimed at enhancing the performance and productivity of industrial processes (ABB Press Release, 2024). This platform, which includes offerings like condition monitoring, predictive maintenance, and automation advisory services, is expected to revolutionize the market.
  • In March 2024, Schneider Electric and Microsoft Corporation entered into a strategic partnership to integrate Microsoft Azure IoT and Schneider Electric's EcoStruxure architecture. This collaboration was aimed at providing advanced industrial automation services, including real-time data analysis and predictive maintenance (Schneider Electric Press Release, 2024).
  • In May 2024, Siemens AG completed the acquisition of Sensicom AG, a German sensor manufacturer. This acquisition was part of Siemens' strategy to expand its portfolio of industrial sensors and strengthen its position in the industrial automation market (Siemens AG Press Release, 2024).
  • In April 2025, Honeywell International Inc. announced the opening of its new Advanced Technology Center in India. This center is dedicated to research and development in industrial automation and control technologies, further expanding Honeywell's global footprint in this market (Honeywell Press Release, 2025).

Dive into Technavio's robust research methodology, blending expert interviews, extensive data synthesis, and validated models for unparalleled Industrial Automation Services Market insights. See full methodology.

Market Scope

Report Coverage

Details

Page number

238

Base year

2024

Historic period

2019-2023

Forecast period

2025-2029

Growth momentum & CAGR

Accelerate at a CAGR of 40.9%

Market growth 2025-2029

USD 712.7 billion

Market structure

Fragmented

YoY growth 2024-2025(%)

29.3

Key countries

US, China, Japan, India, South Korea, Canada, Germany, UK, France, and Italy

Competitive landscape

Leading Companies, Market Positioning of Companies, Competitive Strategies, and Industry Risks

Request Free Sample

Research Analyst Overview

  • Industrial automation services continue to evolve, shaping the industrial landscape with advanced technologies and integrated systems. The convergence of industrial control networks and human-machine interfaces (HMIs) has transformed operations, enabling seamless communication between machines and operators. Digital twin technology, a key component of Industry 4.0, is revolutionizing process control systems by creating virtual replicas of physical assets for predictive maintenance and optimization. Industrial IoT and data acquisition systems are collecting real-time data, fueling cloud-based automation and driving automation system integration. Motion control systems, industrial automation software, and SCADA systems have become more sophisticated, incorporating machine learning algorithms for process optimization and control system upgrades.
  • Production line automation and industrial ethernet have streamlined manufacturing processes, while automation system integration, fieldbus communication, and preventive maintenance scheduling enhance overall efficiency. Cybersecurity protocols and energy efficiency improvements are essential considerations in today's industrial automation landscape. Real-time data analytics, HMI design, asset performance management, PLC programming, robotics integration, safety instrumented systems, automated guided vehicles, industrial network security, and remote monitoring are all critical components of a modern industrial automation strategy. The integration of these technologies and systems is reshaping industries, from manufacturing to energy and utilities, transportation, and healthcare. By leveraging the power of industrial automation services, businesses can improve productivity, enhance safety, and reduce costs.

What are the Key Data Covered in this Industrial Automation Services Market Research and Growth Report?

  • What is the expected growth of the Industrial Automation Services Market between 2025 and 2029?

    • USD 712.7 billion, at a CAGR of 40.9%

  • What segmentation does the market report cover?

    • The report segmented by Type (PE, Maintenance and support, OS, and Consulting), End-user (Discrete industries and Process industries), Component (Industrial robots, Human-machine interface (HMI), Industrial sensors, Control valves, and Others), and Geography (APAC, North America, Europe, Middle East and Africa, and South America)

  • Which regions are analyzed in the report?

    • APAC, North America, Europe, Middle East and Africa, and South America

  • What are the key growth drivers and market challenges?

    • Growing need for main automation contractor, Interoperability issues

  • Who are the major players in the Industrial Automation Services Market?

    • Key Companies ABB Ltd., Advantech Co. Ltd., Dwyer Instruments LLC, Emerson Electric Co., FANUC Bulgaria EOOD, Fuji Electric Co. Ltd., General Electric Co., Hitachi Ltd., Honeywell International Inc., JTEKT Corp., Kawasaki Heavy Industries Ltd., Mitsubishi Electric Corp., OMRON Corp., Parker Hannifin Corp., Robert Bosch GmbH, Rockwell Automation Inc., Schneider Electric SE, Sensirion AG, Siemens AG, and Yokogawa Electric Corp.

Market Research Insights

  • The market encompasses a range of offerings, including system lifecycle management, AI-powered automation, production optimization, remote diagnostics, and maintenance optimization. According to industry estimates, the global market for industrial automation services is projected to reach USD The expansion is driven by the increasing adoption of advanced technologies, such as AI and IoT platforms, in production processes. Moreover, production efficiency gains and risk assessment analysis are key benefits of industrial automation services. For instance, the implementation of automation system design and control system testing can lead to significant improvements in equipment uptime, with some companies reporting up to 99% availability.
  • In contrast, traditional manufacturing processes may experience downtime of up to 20%, resulting in substantial losses. Industrial safety standards, process monitoring tools, and automated quality control are also essential components of the industrial automation services landscape, contributing to system reliability and error detection. Other areas of focus include supply chain automation, industrial robotics, and smart factory solutions. Overall, the market for industrial automation services continues to evolve, offering numerous opportunities for innovation and growth.

We can help! Our analysts can customize this industrial automation services market research report to meet your requirements.

Get in touch

1 Executive Summary

  • 1.1 Market overview
    • Executive Summary - Chart on Market Overview
    • Executive Summary - Data Table on Market Overview
    • Executive Summary - Chart on Global Market Characteristics
    • Executive Summary - Chart on Market by Geography
    • Executive Summary - Chart on Market Segmentation by Type
    • Executive Summary - Chart on Market Segmentation by End-user
    • Executive Summary - Chart on Market Segmentation by Component
    • Executive Summary - Chart on Incremental Growth
    • Executive Summary - Data Table on Incremental Growth
    • Executive Summary - Chart on Company Market Positioning

2 Technavio Analysis

  • 2.1 Analysis of price sensitivity, lifecycle, customer purchase basket, adoption rates, and purchase criteria
    • Analysis of price sensitivity, lifecycle, customer purchase basket, adoption rates, and purchase criteria
  • 2.2 Criticality of inputs and Factors of differentiation
    • Overview on criticality of inputs and factors of differentiation
  • 2.3 Factors of disruption
    • Overview on factors of disruption
  • 2.4 Impact of drivers and challenges
    • Impact of drivers and challenges in 2024 and 2029

3 Market Landscape

  • 3.1 Market ecosystem
    • Parent Market
    • Data Table on - Parent Market
  • 3.2 Market characteristics
    • Market characteristics analysis
  • 3.3 Value chain analysis
    • Value chain analysis

4 Market Sizing

  • 4.1 Market definition
    • Offerings of companies included in the market definition
  • 4.2 Market segment analysis
    • Market segments
  • 4.3 Market size 2024
    • 4.4 Market outlook: Forecast for 2024-2029
      • Chart on Global - Market size and forecast 2024-2029 ($ billion)
      • Data Table on Global - Market size and forecast 2024-2029 ($ billion)
      • Chart on Global Market: Year-over-year growth 2024-2029 (%)
      • Data Table on Global Market: Year-over-year growth 2024-2029 (%)

    5 Historic Market Size

    • 5.1 Global Industrial Automation Services Market 2019 - 2023
      • Historic Market Size - Data Table on Global Industrial Automation Services Market 2019 - 2023 ($ billion)
    • 5.2 Type segment analysis 2019 - 2023
      • Historic Market Size - Type Segment 2019 - 2023 ($ billion)
    • 5.3 End-user segment analysis 2019 - 2023
      • Historic Market Size - End-user Segment 2019 - 2023 ($ billion)
    • 5.4 Component segment analysis 2019 - 2023
      • Historic Market Size - Component Segment 2019 - 2023 ($ billion)
    • 5.5 Geography segment analysis 2019 - 2023
      • Historic Market Size - Geography Segment 2019 - 2023 ($ billion)
    • 5.6 Country segment analysis 2019 - 2023
      • Historic Market Size - Country Segment 2019 - 2023 ($ billion)

    6 Qualitative Analysis

    • 6.1 The AI impact on global industrial automation services market

      7 Five Forces Analysis

      • 7.1 Five forces summary
        • Five forces analysis - Comparison between 2024 and 2029
      • 7.2 Bargaining power of buyers
        • Bargaining power of buyers - Impact of key factors 2024 and 2029
      • 7.3 Bargaining power of suppliers
        • Bargaining power of suppliers - Impact of key factors in 2024 and 2029
      • 7.4 Threat of new entrants
        • Threat of new entrants - Impact of key factors in 2024 and 2029
      • 7.5 Threat of substitutes
        • Threat of substitutes - Impact of key factors in 2024 and 2029
      • 7.6 Threat of rivalry
        • Threat of rivalry - Impact of key factors in 2024 and 2029
      • 7.7 Market condition
        • Chart on Market condition - Five forces 2024 and 2029

      8 Market Segmentation by Type

      • 8.1 Market segments
        • Chart on Type - Market share 2024-2029 (%)
        • Data Table on Type - Market share 2024-2029 (%)
      • 8.2 Comparison by Type
        • Chart on Comparison by Type
        • Data Table on Comparison by Type
      • 8.3 PE - Market size and forecast 2024-2029
        • Chart on PE - Market size and forecast 2024-2029 ($ billion)
        • Data Table on PE - Market size and forecast 2024-2029 ($ billion)
        • Chart on PE - Year-over-year growth 2024-2029 (%)
        • Data Table on PE - Year-over-year growth 2024-2029 (%)
      • 8.4 Maintenance and support - Market size and forecast 2024-2029
        • Chart on Maintenance and support - Market size and forecast 2024-2029 ($ billion)
        • Data Table on Maintenance and support - Market size and forecast 2024-2029 ($ billion)
        • Chart on Maintenance and support - Year-over-year growth 2024-2029 (%)
        • Data Table on Maintenance and support - Year-over-year growth 2024-2029 (%)
      • 8.5 OS - Market size and forecast 2024-2029
        • Chart on OS - Market size and forecast 2024-2029 ($ billion)
        • Data Table on OS - Market size and forecast 2024-2029 ($ billion)
        • Chart on OS - Year-over-year growth 2024-2029 (%)
        • Data Table on OS - Year-over-year growth 2024-2029 (%)
      • 8.6 Consulting - Market size and forecast 2024-2029
        • Chart on Consulting - Market size and forecast 2024-2029 ($ billion)
        • Data Table on Consulting - Market size and forecast 2024-2029 ($ billion)
        • Chart on Consulting - Year-over-year growth 2024-2029 (%)
        • Data Table on Consulting - Year-over-year growth 2024-2029 (%)
      • 8.7 Market opportunity by Type
        • Market opportunity by Type ($ billion)
        • Data Table on Market opportunity by Type ($ billion)

      9 Market Segmentation by End-user

      • 9.1 Market segments
        • Chart on End-user - Market share 2024-2029 (%)
        • Data Table on End-user - Market share 2024-2029 (%)
      • 9.2 Comparison by End-user
        • Chart on Comparison by End-user
        • Data Table on Comparison by End-user
      • 9.3 Discrete industries - Market size and forecast 2024-2029
        • Chart on Discrete industries - Market size and forecast 2024-2029 ($ billion)
        • Data Table on Discrete industries - Market size and forecast 2024-2029 ($ billion)
        • Chart on Discrete industries - Year-over-year growth 2024-2029 (%)
        • Data Table on Discrete industries - Year-over-year growth 2024-2029 (%)
      • 9.4 Process industries - Market size and forecast 2024-2029
        • Chart on Process industries - Market size and forecast 2024-2029 ($ billion)
        • Data Table on Process industries - Market size and forecast 2024-2029 ($ billion)
        • Chart on Process industries - Year-over-year growth 2024-2029 (%)
        • Data Table on Process industries - Year-over-year growth 2024-2029 (%)
      • 9.5 Market opportunity by End-user
        • Market opportunity by End-user ($ billion)
        • Data Table on Market opportunity by End-user ($ billion)

      10 Market Segmentation by Component

      • 10.1 Market segments
        • Chart on Component - Market share 2024-2029 (%)
        • Data Table on Component - Market share 2024-2029 (%)
      • 10.2 Comparison by Component
        • Chart on Comparison by Component
        • Data Table on Comparison by Component
      • 10.3 Industrial robots - Market size and forecast 2024-2029
        • Chart on Industrial robots - Market size and forecast 2024-2029 ($ billion)
        • Data Table on Industrial robots - Market size and forecast 2024-2029 ($ billion)
        • Chart on Industrial robots - Year-over-year growth 2024-2029 (%)
        • Data Table on Industrial robots - Year-over-year growth 2024-2029 (%)
      • 10.4 Human-machine interface (HMI) - Market size and forecast 2024-2029
        • Chart on Human-machine interface (HMI) - Market size and forecast 2024-2029 ($ billion)
        • Data Table on Human-machine interface (HMI) - Market size and forecast 2024-2029 ($ billion)
        • Chart on Human-machine interface (HMI) - Year-over-year growth 2024-2029 (%)
        • Data Table on Human-machine interface (HMI) - Year-over-year growth 2024-2029 (%)
      • 10.5 Industrial sensors - Market size and forecast 2024-2029
        • Chart on Industrial sensors - Market size and forecast 2024-2029 ($ billion)
        • Data Table on Industrial sensors - Market size and forecast 2024-2029 ($ billion)
        • Chart on Industrial sensors - Year-over-year growth 2024-2029 (%)
        • Data Table on Industrial sensors - Year-over-year growth 2024-2029 (%)
      • 10.6 Control valves - Market size and forecast 2024-2029
        • Chart on Control valves - Market size and forecast 2024-2029 ($ billion)
        • Data Table on Control valves - Market size and forecast 2024-2029 ($ billion)
        • Chart on Control valves - Year-over-year growth 2024-2029 (%)
        • Data Table on Control valves - Year-over-year growth 2024-2029 (%)
      • 10.7 Others - Market size and forecast 2024-2029
        • Chart on Others - Market size and forecast 2024-2029 ($ billion)
        • Data Table on Others - Market size and forecast 2024-2029 ($ billion)
        • Chart on Others - Year-over-year growth 2024-2029 (%)
        • Data Table on Others - Year-over-year growth 2024-2029 (%)
      • 10.8 Market opportunity by Component
        • Market opportunity by Component ($ billion)
        • Data Table on Market opportunity by Component ($ billion)

      11 Customer Landscape

      • 11.1 Customer landscape overview
        • Analysis of price sensitivity, lifecycle, customer purchase basket, adoption rates, and purchase criteria

      12 Geographic Landscape

      • 12.1 Geographic segmentation
        • Chart on Market share by geography 2024-2029 (%)
        • Data Table on Market share by geography 2024-2029 (%)
      • 12.2 Geographic comparison
        • Chart on Geographic comparison
        • Data Table on Geographic comparison
      • 12.3 APAC - Market size and forecast 2024-2029
        • Chart on APAC - Market size and forecast 2024-2029 ($ billion)
        • Data Table on APAC - Market size and forecast 2024-2029 ($ billion)
        • Chart on APAC - Year-over-year growth 2024-2029 (%)
        • Data Table on APAC - Year-over-year growth 2024-2029 (%)
      • 12.4 North America - Market size and forecast 2024-2029
        • Chart on North America - Market size and forecast 2024-2029 ($ billion)
        • Data Table on North America - Market size and forecast 2024-2029 ($ billion)
        • Chart on North America - Year-over-year growth 2024-2029 (%)
        • Data Table on North America - Year-over-year growth 2024-2029 (%)
      • 12.5 Europe - Market size and forecast 2024-2029
        • Chart on Europe - Market size and forecast 2024-2029 ($ billion)
        • Data Table on Europe - Market size and forecast 2024-2029 ($ billion)
        • Chart on Europe - Year-over-year growth 2024-2029 (%)
        • Data Table on Europe - Year-over-year growth 2024-2029 (%)
      • 12.6 Middle East and Africa - Market size and forecast 2024-2029
        • Chart on Middle East and Africa - Market size and forecast 2024-2029 ($ billion)
        • Data Table on Middle East and Africa - Market size and forecast 2024-2029 ($ billion)
        • Chart on Middle East and Africa - Year-over-year growth 2024-2029 (%)
        • Data Table on Middle East and Africa - Year-over-year growth 2024-2029 (%)
      • 12.7 South America - Market size and forecast 2024-2029
        • Chart on South America - Market size and forecast 2024-2029 ($ billion)
        • Data Table on South America - Market size and forecast 2024-2029 ($ billion)
        • Chart on South America - Year-over-year growth 2024-2029 (%)
        • Data Table on South America - Year-over-year growth 2024-2029 (%)
      • 12.8 US - Market size and forecast 2024-2029
        • Chart on US - Market size and forecast 2024-2029 ($ billion)
        • Data Table on US - Market size and forecast 2024-2029 ($ billion)
        • Chart on US - Year-over-year growth 2024-2029 (%)
        • Data Table on US - Year-over-year growth 2024-2029 (%)
      • 12.9 China - Market size and forecast 2024-2029
        • Chart on China - Market size and forecast 2024-2029 ($ billion)
        • Data Table on China - Market size and forecast 2024-2029 ($ billion)
        • Chart on China - Year-over-year growth 2024-2029 (%)
        • Data Table on China - Year-over-year growth 2024-2029 (%)
      • 12.10 Japan - Market size and forecast 2024-2029
        • Chart on Japan - Market size and forecast 2024-2029 ($ billion)
        • Data Table on Japan - Market size and forecast 2024-2029 ($ billion)
        • Chart on Japan - Year-over-year growth 2024-2029 (%)
        • Data Table on Japan - Year-over-year growth 2024-2029 (%)
      • 12.11 India - Market size and forecast 2024-2029
        • Chart on India - Market size and forecast 2024-2029 ($ billion)
        • Data Table on India - Market size and forecast 2024-2029 ($ billion)
        • Chart on India - Year-over-year growth 2024-2029 (%)
        • Data Table on India - Year-over-year growth 2024-2029 (%)
      • 12.12 South Korea - Market size and forecast 2024-2029
        • Chart on South Korea - Market size and forecast 2024-2029 ($ billion)
        • Data Table on South Korea - Market size and forecast 2024-2029 ($ billion)
        • Chart on South Korea - Year-over-year growth 2024-2029 (%)
        • Data Table on South Korea - Year-over-year growth 2024-2029 (%)
      • 12.13 Canada - Market size and forecast 2024-2029
        • Chart on Canada - Market size and forecast 2024-2029 ($ billion)
        • Data Table on Canada - Market size and forecast 2024-2029 ($ billion)
        • Chart on Canada - Year-over-year growth 2024-2029 (%)
        • Data Table on Canada - Year-over-year growth 2024-2029 (%)
      • 12.14 Germany - Market size and forecast 2024-2029
        • Chart on Germany - Market size and forecast 2024-2029 ($ billion)
        • Data Table on Germany - Market size and forecast 2024-2029 ($ billion)
        • Chart on Germany - Year-over-year growth 2024-2029 (%)
        • Data Table on Germany - Year-over-year growth 2024-2029 (%)
      • 12.15 UK - Market size and forecast 2024-2029
        • Chart on UK - Market size and forecast 2024-2029 ($ billion)
        • Data Table on UK - Market size and forecast 2024-2029 ($ billion)
        • Chart on UK - Year-over-year growth 2024-2029 (%)
        • Data Table on UK - Year-over-year growth 2024-2029 (%)
      • 12.16 France - Market size and forecast 2024-2029
        • Chart on France - Market size and forecast 2024-2029 ($ billion)
        • Data Table on France - Market size and forecast 2024-2029 ($ billion)
        • Chart on France - Year-over-year growth 2024-2029 (%)
        • Data Table on France - Year-over-year growth 2024-2029 (%)
      • 12.17 Italy - Market size and forecast 2024-2029
        • Chart on Italy - Market size and forecast 2024-2029 ($ billion)
        • Data Table on Italy - Market size and forecast 2024-2029 ($ billion)
        • Chart on Italy - Year-over-year growth 2024-2029 (%)
        • Data Table on Italy - Year-over-year growth 2024-2029 (%)
      • 12.18 Market opportunity by geography
        • Market opportunity by geography ($ billion)
        • Data Tables on Market opportunity by geography ($ billion)

      13 Drivers, Challenges, and Opportunity/Restraints

      • 13.1 Market drivers
        • 13.2 Market challenges
          • 13.3 Impact of drivers and challenges
            • Impact of drivers and challenges in 2024 and 2029
          • 13.4 Market opportunities/restraints

            14 Competitive Landscape

            • 14.1 Overview
              • 14.2 Competitive Landscape
                • Overview on criticality of inputs and factors of differentiation
              • 14.3 Landscape disruption
                • Overview on factors of disruption
              • 14.4 Industry risks
                • Impact of key risks on business

              15 Competitive Analysis

              • 15.1 Companies profiled
                • Companies covered
              • 15.2 Company ranking index
                • Company ranking index
              • 15.3 Market positioning of companies
                • Matrix on companies position and classification
              • 15.4 ABB Ltd.
                • ABB Ltd. - Overview
                • ABB Ltd. - Business segments
                • ABB Ltd. - Key news
                • ABB Ltd. - Key offerings
                • ABB Ltd. - Segment focus
                • SWOT
              • 15.5 Dwyer Instruments LLC
                • Dwyer Instruments LLC - Overview
                • Dwyer Instruments LLC - Product / Service
                • Dwyer Instruments LLC - Key offerings
                • SWOT
              • 15.6 Emerson Electric Co.
                • Emerson Electric Co. - Overview
                • Emerson Electric Co. - Business segments
                • Emerson Electric Co. - Key news
                • Emerson Electric Co. - Key offerings
                • Emerson Electric Co. - Segment focus
                • SWOT
              • 15.7 Fuji Electric Co. Ltd.
                • Fuji Electric Co. Ltd. - Overview
                • Fuji Electric Co. Ltd. - Business segments
                • Fuji Electric Co. Ltd. - Key news
                • Fuji Electric Co. Ltd. - Key offerings
                • Fuji Electric Co. Ltd. - Segment focus
                • SWOT
              • 15.8 General Electric Co.
                • General Electric Co. - Overview
                • General Electric Co. - Business segments
                • General Electric Co. - Key news
                • General Electric Co. - Key offerings
                • General Electric Co. - Segment focus
                • SWOT
              • 15.9 Hitachi Ltd.
                • Hitachi Ltd. - Overview
                • Hitachi Ltd. - Business segments
                • Hitachi Ltd. - Key news
                • Hitachi Ltd. - Key offerings
                • Hitachi Ltd. - Segment focus
                • SWOT
              • 15.10 Honeywell International Inc.
                • Honeywell International Inc. - Overview
                • Honeywell International Inc. - Business segments
                • Honeywell International Inc. - Key news
                • Honeywell International Inc. - Key offerings
                • Honeywell International Inc. - Segment focus
                • SWOT
              • 15.11 Mitsubishi Electric Corp.
                • Mitsubishi Electric Corp. - Overview
                • Mitsubishi Electric Corp. - Business segments
                • Mitsubishi Electric Corp. - Key offerings
                • Mitsubishi Electric Corp. - Segment focus
                • SWOT
              • 15.12 OMRON Corp.
                • OMRON Corp. - Overview
                • OMRON Corp. - Business segments
                • OMRON Corp. - Key news
                • OMRON Corp. - Key offerings
                • OMRON Corp. - Segment focus
                • SWOT
              • 15.13 Parker Hannifin Corp.
                • Parker Hannifin Corp. - Overview
                • Parker Hannifin Corp. - Business segments
                • Parker Hannifin Corp. - Key news
                • Parker Hannifin Corp. - Key offerings
                • Parker Hannifin Corp. - Segment focus
                • SWOT
              • 15.14 Robert Bosch GmbH
                • Robert Bosch GmbH - Overview
                • Robert Bosch GmbH - Product / Service
                • Robert Bosch GmbH - Key news
                • Robert Bosch GmbH - Key offerings
                • SWOT
              • 15.15 Rockwell Automation Inc.
                • Rockwell Automation Inc. - Overview
                • Rockwell Automation Inc. - Business segments
                • Rockwell Automation Inc. - Key news
                • Rockwell Automation Inc. - Key offerings
                • Rockwell Automation Inc. - Segment focus
                • SWOT
              • 15.16 Schneider Electric SE
                • Schneider Electric SE - Overview
                • Schneider Electric SE - Business segments
                • Schneider Electric SE - Key news
                • Schneider Electric SE - Key offerings
                • Schneider Electric SE - Segment focus
                • SWOT
              • 15.17 Siemens AG
                • Siemens AG - Overview
                • Siemens AG - Business segments
                • Siemens AG - Key news
                • Siemens AG - Key offerings
                • Siemens AG - Segment focus
                • SWOT
              • 15.18 Yokogawa Electric Corp.
                • Yokogawa Electric Corp. - Overview
                • Yokogawa Electric Corp. - Business segments
                • Yokogawa Electric Corp. - Key news
                • Yokogawa Electric Corp. - Key offerings
                • Yokogawa Electric Corp. - Segment focus
                • SWOT

              16 Appendix

              • 16.1 Scope of the report
                • 16.2 Inclusions and exclusions checklist
                  • Inclusions checklist
                  • Exclusions checklist
                • 16.3 Currency conversion rates for US$
                  • Currency conversion rates for US$
                • 16.4 Research methodology
                  • Research methodology
                • 16.5 Data procurement
                  • Information sources
                • 16.6 Data validation
                  • Data validation
                • 16.7 Validation techniques employed for market sizing
                  • Validation techniques employed for market sizing
                • 16.8 Data synthesis
                  • Data synthesis
                • 16.9 360 degree market analysis
                  • 360 degree market analysis
                • 16.10 List of abbreviations
                  • List of abbreviations

                Research Methodology

                Technavio presents a detailed picture of the market by way of study, synthesis, and summation of data from multiple sources. The analysts have presented the various facets of the market with a particular focus on identifying the key industry influencers. The data thus presented is comprehensive, reliable, and the result of extensive research, both primary and secondary.

                INFORMATION SOURCES

                Primary sources

                • Manufacturers and suppliers
                • Channel partners
                • Industry experts
                • Strategic decision makers

                Secondary sources

                • Industry journals and periodicals
                • Government data
                • Financial reports of key industry players
                • Historical data
                • Press releases

                DATA ANALYSIS

                Data Synthesis

                • Collation of data
                • Estimation of key figures
                • Analysis of derived insights

                Data Validation

                • Triangulation with data models
                • Reference against proprietary databases
                • Corroboration with industry experts

                REPORT WRITING

                Qualitative

                • Market drivers
                • Market challenges
                • Market trends
                • Five forces analysis

                Quantitative

                • Market size and forecast
                • Market segmentation
                • Geographical insights
                • Competitive landscape

                Interested in this report?

                Get your sample now to see our research methodology and insights!

                Download Now

                Frequently Asked Questions

                Industrial Automation Services market growth will increase by $ 712.7 bn during 2025-2029.

                The Industrial Automation Services market is expected to grow at a CAGR of 40.9% during 2025-2029.

                Industrial Automation Services market is segmented by Type( PE, Maintenance and support, OS, Consulting) End-user( Discrete industries, Process industries, Operational services, Consulting) Component( Industrial robots, Human-machine interface (HMI), Industrial sensors, Control valves, Others)

                ABB Ltd., Advantech Co. Ltd., Dwyer Instruments LLC, Emerson Electric Co., FANUC Bulgaria EOOD, Fuji Electric Co. Ltd., General Electric Co., Hitachi Ltd., Honeywell International Inc., JTEKT Corp., Kawasaki Heavy Industries Ltd., Mitsubishi Electric Corp., OMRON Corp., Parker Hannifin Corp., Robert Bosch GmbH, Rockwell Automation Inc., Schneider Electric SE, Sensirion AG, Siemens AG, Yokogawa Electric Corp. are a few of the key vendors in the Industrial Automation Services market.

                APAC will register the highest growth rate of 51% among the other regions. Therefore, the Industrial Automation Services market in APAC is expected to garner significant business opportunities for the vendors during the forecast period.

                US, China, Japan, India, South Korea, Canada, Germany, UK, France, Italy

                • Growing need for main automation contractorIn 2024 is the driving factor this market.
                • the role of Main Automation Contractors (MACs) continues to evolve is the driving factor this market.
                • driven by the increasing complexity of automation systems and the growing demands of end-users. Modern MACs are focusing on integrating open automation systems that use standardized communication protocols is the driving factor this market.
                • improving interoperability between different systems and companies. This trend allows for easier management and upgrades of automation solutions. Additionally is the driving factor this market.
                • there is a strong push towards decoupling automation software from hardware is the driving factor this market.
                • enabling end-users to select the best software solutions without being tied to specific hardware companies is the driving factor this market.
                • thus enhancing flexibility and reducing long-term costs. MACs are also leveraging advanced technologies such as object-oriented and event-driven architectures to create modular and reusable software components is the driving factor this market.
                • speeding up development and ensuring higher reliability and easier maintenance.Cost efficiency and standardization are key benefits provided by MACs through the adoption of open process automation standards is the driving factor this market.
                • which facilitate the modular integration of products from multiple companies is the driving factor this market.
                • ensuring consistent quality and performance across projects. The oil and gas industry remains a major end-user of MACs due to the high complexity of projects like LNG and FLNG is the driving factor this market.
                • which require the expertise of MACs for smooth deployment and operation of automation systems. With the increasing digitization of industrial processes is the driving factor this market.
                • MACs are placing greater emphasis on cybersecurity and safety is the driving factor this market.
                • using proven software components and standard IT infrastructure management tools to enhance overall security and reliability. Furthermore is the driving factor this market.
                • the adoption of modern technologies and open automation systems is attracting young software engineers to the field of industrial automation is the driving factor this market.
                • ensuring a steady influx of new talent to manage and innovate future automation projects. which are expected to drive the growth of the global industrial automation services market during the forecast period. is the driving factor this market.

                The Industrial Automation Services market vendors should focus on grabbing business opportunities from the PE segment as it accounted for the largest market share in the base year.
                RIA - Research AI Assistant
                Ask RIA