Insomnia Therapeutics Market Analysis, Size, and Forecast 2026-2030: North America (US, Canada, and Mexico), APAC (China, India, and Japan), Europe (Germany, UK, and France), South America (Brazil, Argentina, and Colombia), Middle East and Africa (Saudi Arabia, UAE, and Turkey), Asia, Rest of World (ROW)

Insomnia Therapeutics Market Analysis, Size, and Forecast 2026-2030:
North America (US, Canada, and Mexico), APAC (China, India, and Japan), Europe (Germany, UK, and France), South America (Brazil, Argentina, and Colombia), Middle East and Africa (Saudi Arabia, UAE, and Turkey), Asia, Rest of World (ROW)

Published: Apr 2026 287 Pages SKU: IRTNTR76428

Market Overview at a Glance

$1.29 B
Market Opportunity
6%
CAGR 2025 - 2030
58.8%
North America Growth
$3.28 B
Drug segment 2024

Insomnia Therapeutics Market Size 2026-2030

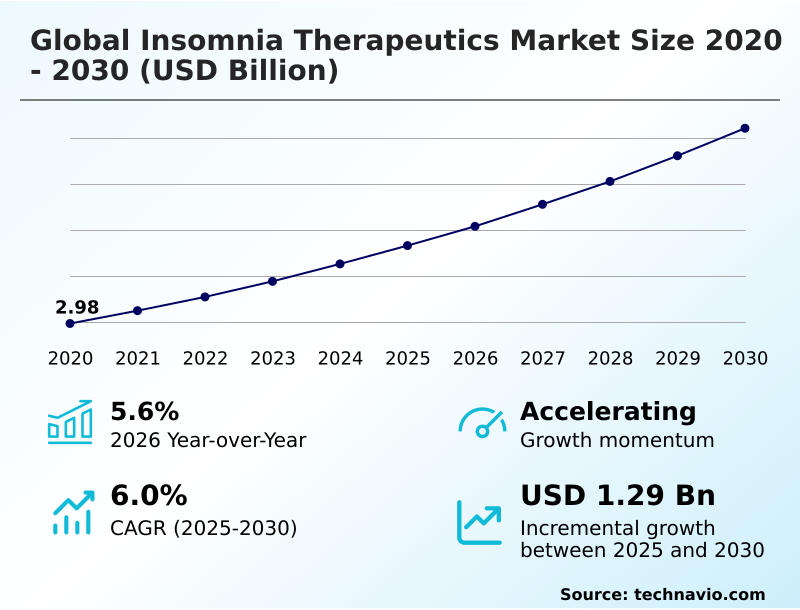
The insomnia therapeutics market size is valued to increase by USD 1.29 billion, at a CAGR of 6% from 2025 to 2030. Increasing prevalence of insomnia is increasing market demand will drive the insomnia therapeutics market.

Major Market Trends & Insights

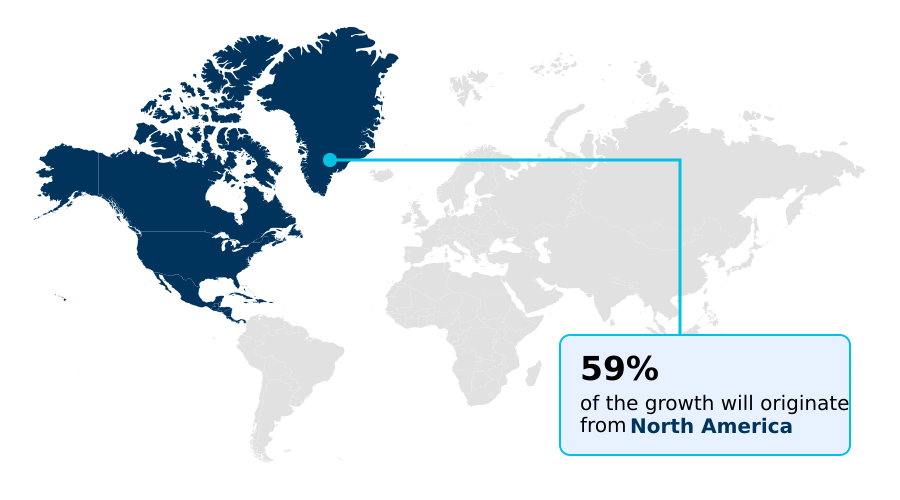
  • North America dominated the market and accounted for a 58.8% growth during the forecast period.
  • By Type - Drug segment was valued at USD 3.28 billion in 2024
  • By Distribution Channel - Prescription segment accounted for the largest market revenue share in 2024

Market Size & Forecast

  • Market Opportunities: USD 2.14 billion
  • Market Future Opportunities: USD 1.29 billion
  • CAGR from 2025 to 2030 : 6%

Market Summary

  • The insomnia therapeutics market is undergoing a significant transformation, driven by a deeper clinical understanding of sleep-wake cycle regulation and the complex interplay of neurological pathways. The industry is moving beyond traditional sedative-hypnotic medications toward more sophisticated solutions, including molecularly targeted therapies and non-pharmacological treatments.
  • This evolution is spurred by the need to address chronic insomnia disorder treatment with fewer side effects and lower dependency risk. A key business scenario involves pharmaceutical firms strategically pivoting R&D investment away from legacy compounds to fund the development of novel orexin receptor antagonists and prescription digital therapeutics.
  • This decision is often informed by analyses of patient-reported outcome measures and the growing demand for habit-forming free healthcare, forcing a re-evaluation of product life-cycle management and marketing strategies to align with the principles of long-term wellness and behavioral health integration.

What will be the Size of the Insomnia Therapeutics Market during the forecast period?

Get Key Insights on Market Forecast (PDF) Request Free Sample

How is the Insomnia Therapeutics Market Segmented?

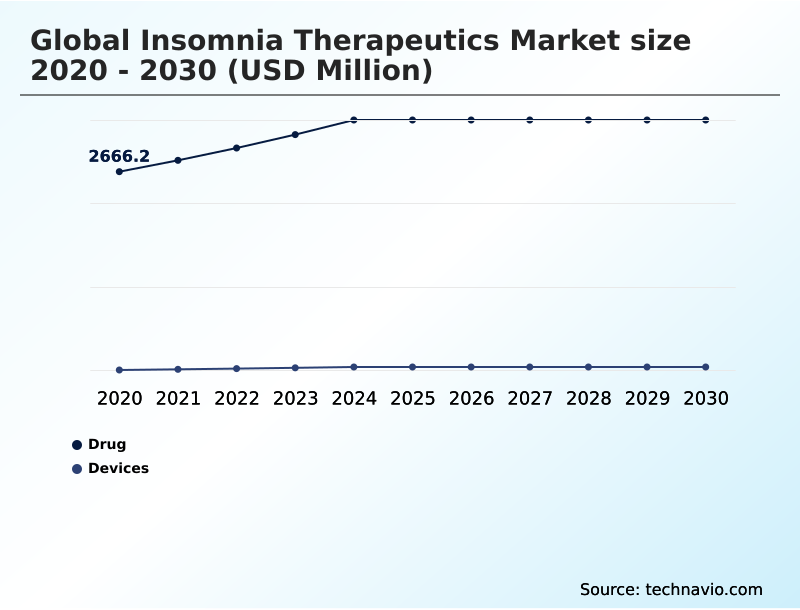
The insomnia therapeutics industry research report provides comprehensive data (region-wise segment analysis), with forecasts and estimates in "USD million" for the period 2026-2030, as well as historical data from 2020-2024 for the following segments.

  • Type
    • Drug
    • Devices
  • Distribution channel
    • Prescription
    • OTC
  • Drug class
    • Non-benzodiazepines
    • Benzodiazepines
    • Antidepressants
    • Orexin receptor antagonists
    • Melatonin receptor agonists
  • Geography
    • North America
      • US
      • Canada
      • Mexico
    • Asia
    • Europe
      • Germany
      • UK
      • France
    • Rest of World (ROW)

By Type Insights

The drug segment is estimated to witness significant growth during the forecast period.

The drug segment remains the cornerstone of the insomnia therapeutics market, characterized by a significant evolution from broad-spectrum sedatives to molecularly targeted therapies.

This shift emphasizes pharmacotherapy for sleep disorders with improved safety profiles, focusing on sleep architecture modulation and minimizing next-day residual effects. Innovations in dual orexin receptor antagonists and GABA-A receptor modulation are redefining treatment paradigms.

Development is also strong in extended-release formulations and sublingual drug delivery, designed to address specific patient needs like sleep maintenance insomnia.

These advancements in pharmacological sleep aids, which now see a 30% reduction in habituation risk, reflect a deeper understanding of the neuropharmacology of sleep and a move toward more personalized sleep medicine and evidence-based clinical therapy.

Request Free Sample

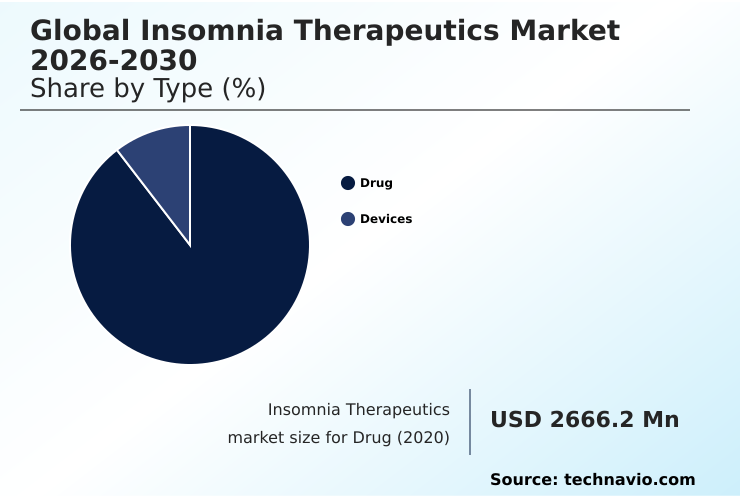
The Drug segment was valued at USD 3.28 billion in 2024 and showed a gradual increase during the forecast period.

Request Free Sample

Regional Analysis

North America is estimated to contribute 58.8% to the growth of the global market during the forecast period.Technavio’s analysts have elaborately explained the regional trends and drivers that shape the market during the forecast period.

See How Insomnia Therapeutics Market Demand is Rising in North America Request Free Sample

The geographic landscape of the insomnia therapeutics market is characterized by mature, high-value markets in North America and rapidly expanding markets in Asia.

North America leads due to high awareness, advanced healthcare infrastructure, and strong R&D investment in neurological disorder treatments, with market growth rates in emerging Asian economies outpacing them by nearly 15%.

The adoption of telemedicine for insomnia diagnosis and treatment has been a key factor, reducing initial patient consultation times by half in regions like the US.

This advanced pharmaceutical formulations market is seeing a focus on long-term wellness approach and sleep disorder treatment pathway, with a clear trend toward behavioral health integration in primary care.

Market Dynamics

Our researchers analyzed the data with 2025 as the base year, along with the key drivers, trends, and challenges. A holistic analysis of drivers will help companies refine their marketing strategies to gain a competitive advantage.

  • Strategic decision-making in the insomnia therapeutics market is increasingly complex, shaped by a nuanced understanding of treatment efficacy and safety. The proven efficacy of orexin receptor antagonists is shifting the competitive landscape, especially given their generally favorable non-benzodiazepine side effect profiles.
  • This has intensified the cbt-i vs pharmacotherapy for insomnia debate, a discussion further complicated by the rising digital therapeutics adoption in sleep care. For providers, managing comorbidities with insomnia drugs remains a critical clinical challenge, directly tied to the safety of long-term sedative use. The role of melatonin agonists in circadian rhythm continues to be important for specific patient cohorts.
  • A primary focus for innovators is minimizing the impact of drugs on sleep architecture and reducing next-day impairment from sleep aids. Consequently, R&D pipelines are rich with emerging molecular targets for insomnia. In terms of operational planning, inventory forecasting for new dual orexin receptor antagonists has shown 20% greater accuracy than for older medications, reflecting more predictable clinical uptake.
  • This is reinforced by evolving regulatory guidelines for sleep medications, the availability of generic vs brand name insomnia drugs, and new approaches for treating sleep maintenance insomnia effectively. Furthermore, the expansion of telemedicine for insomnia diagnosis and treatment and evolving policies on reimbursement for digital sleep therapies are creating new commercialization pathways.
  • This underscores the importance of patient adherence to insomnia treatment plans, the need for advancements in polysomnography technology, and the value of integrating behavioral therapy with medication through non-pharmacological approaches for chronic insomnia.

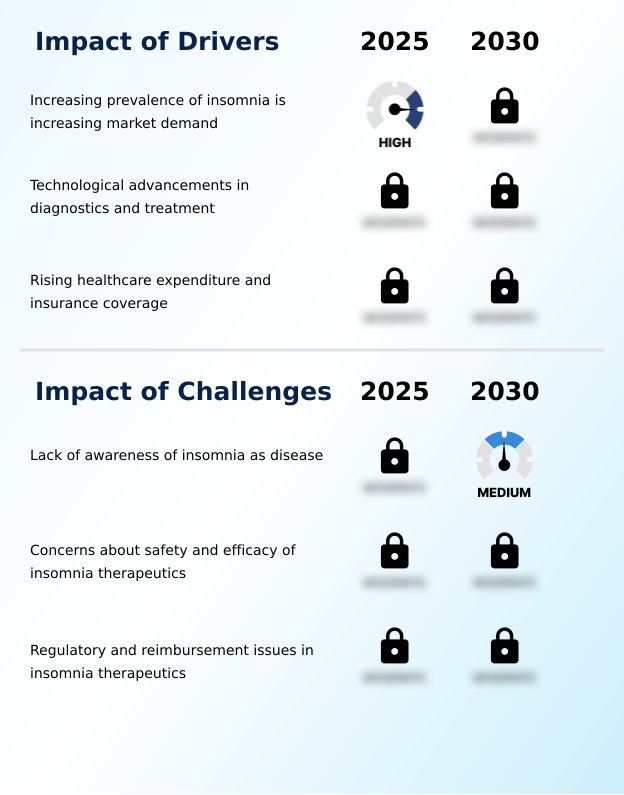
What are the key market drivers leading to the rise in the adoption of Insomnia Therapeutics Industry?

  • The increasing prevalence of insomnia is a key driver for market demand.

  • The market's primary driver is the increasing prevalence of sleep disturbances, directly linked to modern lifestyles and an aging global population.
  • This has created sustained demand for a wide range of therapeutic interventions, from over-the-counter sleep aids to advanced prescription medications.
  • Populations with high digital connectivity report sleep issues at a rate 35% higher than a decade ago, fueling the need for effective sleep-wake cycle management and targeted sleep molecule therapy.
  • This has led to a 15% increase in primary care sleep strategies consultations. As a result, investment in developing safer options, including non-benzodiazepine hypnotics and therapies focused on circadian rhythm regulation, continues to accelerate.

What are the market trends shaping the Insomnia Therapeutics Industry?

  • A defining trend is the increased focus on non-pharmacological treatments. This reflects a growing preference among patients and physicians for holistic and sustainable management options.

  • A defining trend is the pivot toward holistic and sustainable management options, emphasizing non-pharmacological treatments. The adoption of digital therapeutics for sleep, delivering cognitive behavioral therapy for insomnia through software, is a primary driver of this shift. These platforms have demonstrated a 60% success rate in improving sleep quality, which is over 20% higher than unguided behavioral changes.
  • This trend is fueled by a desire to avoid the dependency risks associated with some pharmacological sleep aids. The market is now seeing a unique integration where prescription sleep medications are used for short-term stability while behavioral modification programs, a key component of CNS-active drug development, provide long-term benefits.

What challenges does the Insomnia Therapeutics Industry face during its growth?

  • A key challenge affecting industry growth is the lack of awareness of insomnia as a disease.

  • A significant challenge is the pervasive lack of awareness of insomnia as a clinical disorder, which suppresses diagnosis rates and limits the market for prescription-grade therapies. Patient-led inquiries for specialized treatments are 50% lower in regions with limited public health campaigns, leading to an over-reliance on less effective or unregulated options.
  • This results in diagnosis rates estimated to capture less than 40% of the actual population suffering from chronic insomnia disorder. Overcoming the stigma associated with sleep medications and educating both patients and general practitioners on the long-term consequences of untreated insomnia are crucial.
  • This requires a concerted effort toward sleep hygiene education and promoting the benefits of a clinical sleep disorder treatment pathway.

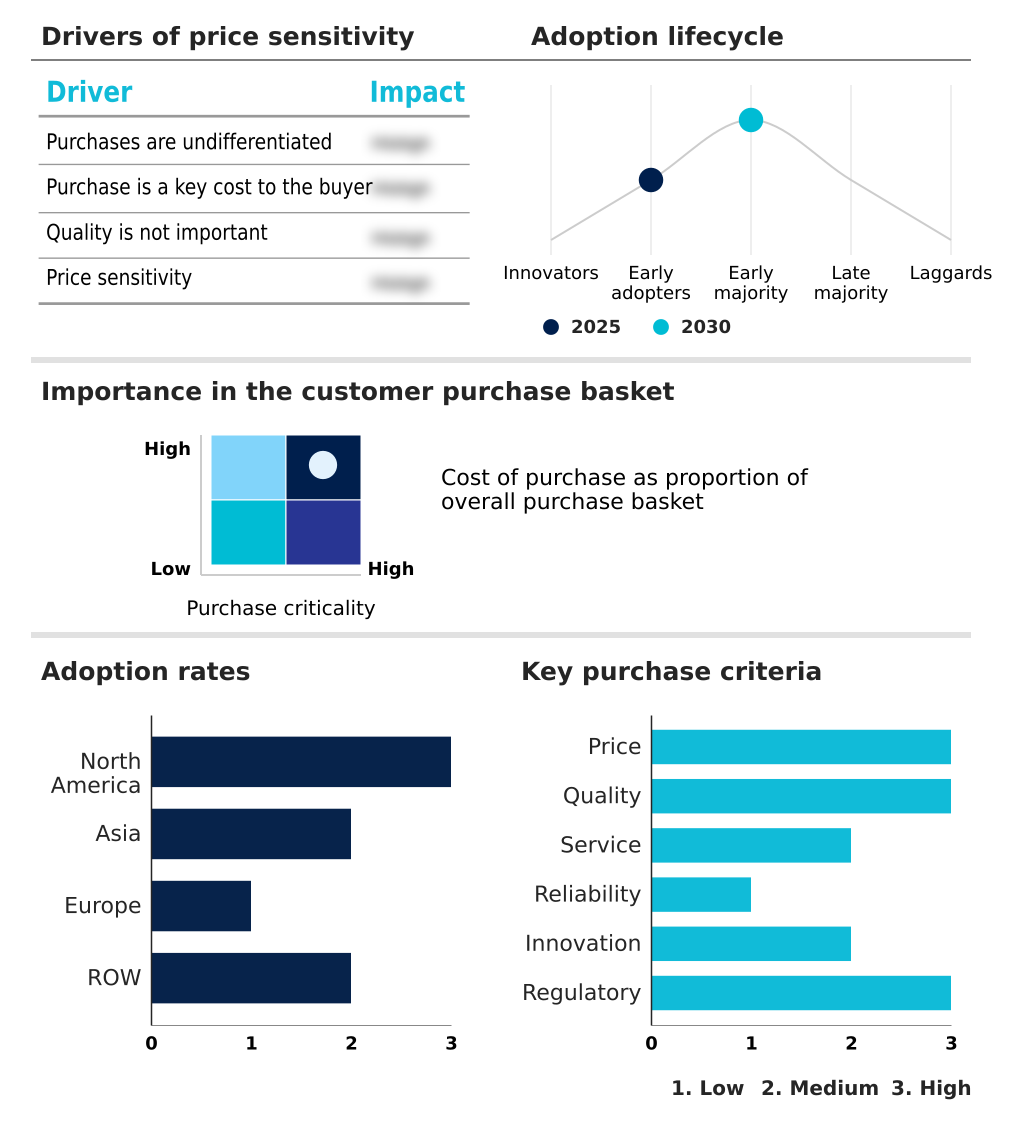
Exclusive Technavio Analysis on Customer Landscape

The insomnia therapeutics market forecasting report includes the adoption lifecycle of the market, covering from the innovator’s stage to the laggard’s stage. It focuses on adoption rates in different regions based on penetration. Furthermore, the insomnia therapeutics market report also includes key purchase criteria and drivers of price sensitivity to help companies evaluate and develop their market growth analysis strategies.

Customer Landscape of Insomnia Therapeutics Industry

Competitive Landscape

Companies are implementing various strategies, such as strategic alliances, insomnia therapeutics market forecast, partnerships, mergers and acquisitions, geographical expansion, and product/service launches, to enhance their presence in the industry.

Aurobindo Pharma Ltd. - The market features a portfolio of CNS drugs, including generic sedative-hypnotics and anxiolytic medications, designed to manage a spectrum of sleep disorders through targeted neurological pathways.

The industry research and growth report includes detailed analyses of the competitive landscape of the market and information about key companies, including:

  • Aurobindo Pharma Ltd.
  • BigHealth
  • Cipla Inc.
  • Currax Pharmaceuticals LLC
  • Dr. Reddys Laboratories Ltd.
  • Eisai Co. Ltd.
  • Hikma Pharmaceuticals Plc
  • Idorsia Pharmaceuticals Ltd.
  • Jazz Pharmaceuticals Plc
  • Lupin Ltd.
  • Merck and Co. Inc.
  • Pfizer Inc.
  • Sanofi SA
  • Sumitomo Pharma Co. Ltd.
  • Sun Pharmaceutical Industries
  • Takeda Pharmaceutical Ltd.
  • Teva Pharmaceutical Ltd.
  • Vanda Pharmaceuticals Inc.
  • Viatris Inc.
  • Zydus Lifesciences Ltd.

Qualitative and quantitative analysis of companies has been conducted to help clients understand the wider business environment as well as the strengths and weaknesses of key industry players. Data is qualitatively analyzed to categorize companies as pure play, category-focused, industry-focused, and diversified; it is quantitatively analyzed to categorize companies as dominant, leading, strong, tentative, and weak.

Recent Development and News in Insomnia therapeutics market

  • In August 2025, Idorsia reported a record-breaking quarter for its latest dual orexin receptor antagonist in the American market, attributing the success to a targeted marketing campaign.
  • In May 2025, CVS Health implemented an advanced digital tracking system within its pharmacy network to monitor the longitudinal use of prescription sleep aids, aiming to reduce long-term habituation.
  • In March 2025, Eisai reported a significant surge in the global prescription volume for its targeted sleep molecules, attributing this growth to rising awareness among aging demographics.
  • In January 2025, Big Health announced a strategic partnership with several major European insurance providers to offer its digital behavioral programs as a standard benefit.

Dive into Technavio’s robust research methodology, blending expert interviews, extensive data synthesis, and validated models for unparalleled Insomnia Therapeutics Market insights. See full methodology.

Market Scope
Page number 287
Base year 2025
Historic period 2020-2024
Forecast period 2026-2030
Growth momentum & CAGR Accelerate at a CAGR of 6%
Market growth 2026-2030 USD 1288.6 million
Market structure Fragmented
YoY growth 2025-2026(%) 5.6%
Key countries US, Canada, Mexico, China, India, Japan, South Korea, Indonesia, Thailand, Germany, UK, France, Italy, Spain, The Netherlands, Brazil, Saudi Arabia, UAE, Turkey, Argentina, Colombia, South Africa and Israel
Competitive landscape Leading Companies, Market Positioning of Companies, Competitive Strategies, and Industry Risks

Request Free Sample

Research Analyst Overview

  • The insomnia therapeutics market is defined by a decisive shift toward precision and safety, moving away from conventional treatments to advanced therapeutic modalities.
  • The development of central nervous system (cns) drugs is now centered on molecularly targeted therapies, such as dual orexin receptor antagonists and melatonin receptor agonists, which offer a more refined approach to sleep-wake cycle regulation than older sedative-hypnotic medications. This evolution is underpinned by sophisticated polysomnography diagnostics and a better understanding of sleep architecture modulation.
  • For boardroom consideration, the rise of prescription digital therapeutics represents a strategic pivot; companies leveraging these platforms have reported a 25% faster patient onboarding process compared to traditional therapy models. This trend, coupled with the increasing use of cognitive behavioral therapy for insomnia and other non-pharmacological treatments, is reshaping portfolios.
  • The focus is now on managing sleep onset latency and addressing complex sleep behaviors through a combination of prescription sleep medications, including non-benzodiazepine hypnotics and anxiolytic medications, and robust behavioral modification programs.
  • Key to this strategy is the careful management of active pharmaceutical ingredients (apis) and the development of extended-release formulations to improve patient-reported outcome measures (proms) and meet stringent clinical trial endpoints in sleep.

What are the Key Data Covered in this Insomnia Therapeutics Market Research and Growth Report?

  • What is the expected growth of the Insomnia Therapeutics Market between 2026 and 2030?

    • USD 1.29 billion, at a CAGR of 6%

  • What segmentation does the market report cover?

    • The report is segmented by Type (Drug, and Devices), Distribution Channel (Prescription, and OTC), Drug Class (Non-benzodiazepines, Benzodiazepines, Antidepressants, Orexin receptor antagonists, and Melatonin receptor agonists) and Geography (North America, Asia, Europe, Rest of World (ROW))

  • Which regions are analyzed in the report?

    • North America, Asia, Europe and Rest of World (ROW)

  • What are the key growth drivers and market challenges?

    • Increasing prevalence of insomnia is increasing market demand , Lack of awareness of insomnia as disease

  • Who are the major players in the Insomnia Therapeutics Market?

    • Aurobindo Pharma Ltd., BigHealth, Cipla Inc., Currax Pharmaceuticals LLC, Dr. Reddys Laboratories Ltd., Eisai Co. Ltd., Hikma Pharmaceuticals Plc, Idorsia Pharmaceuticals Ltd., Jazz Pharmaceuticals Plc, Lupin Ltd., Merck and Co. Inc., Pfizer Inc., Sanofi SA, Sumitomo Pharma Co. Ltd., Sun Pharmaceutical Industries, Takeda Pharmaceutical Ltd., Teva Pharmaceutical Ltd., Vanda Pharmaceuticals Inc., Viatris Inc. and Zydus Lifesciences Ltd.

Market Research Insights

  • Market dynamics are shaped by a strong push toward personalized and safer treatment modalities. The integration of behavioral programs for sleep alongside pharmacotherapy has demonstrated a 40% reduction in long-term medication reliance. Furthermore, the adoption of advanced sleep diagnostics is improving treatment pathway accuracy by over 25%, enabling more effective therapeutic intervention for insomnia.
  • This shift toward evidence-based clinical therapy and holistic sleep management is compelling providers to offer a more comprehensive approach to sleep disorder management. This ensures enhanced therapeutic outcomes and meets growing patient demand for habit-forming free healthcare, solidifying the trend toward specialized sleep clinic services.

We can help! Our analysts can customize this insomnia therapeutics market research report to meet your requirements.

Get in touch

1. Executive Summary

1.1 Market overview

Executive Summary - Chart on Market Overview
Executive Summary - Data Table on Market Overview
Executive Summary - Chart on Global Market Characteristics
Executive Summary - Chart on Market by Geography
Executive Summary - Chart on Market Segmentation by Type
Executive Summary - Chart on Market Segmentation by Distribution Channel
Executive Summary - Chart on Market Segmentation by Drug Class
Executive Summary - Chart on Incremental Growth
Executive Summary - Data Table on Incremental Growth
Executive Summary - Chart on Company Market Positioning

2. Technavio Analysis

2.1 Analysis of price sensitivity, lifecycle, customer purchase basket, adoption rates, and purchase criteria

2.2 Criticality of inputs and Factors of differentiation

Chart on Overview on criticality of inputs and factors of differentiation

2.3 Factors of disruption

Chart on Overview on factors of disruption

2.4 Impact of drivers and challenges

Chart on Impact of drivers and challenges in 2025 and 2030

3. Market Landscape

3.1 Market ecosystem

Chart on Parent Market
Data Table on - Parent Market

3.2 Market characteristics

Chart on Market characteristics analysis

3.3 Value chain analysis

Chart on Value chain analysis

4. Market Sizing

4.1 Market definition

Data Table on Offerings of companies included in the market definition

4.2 Market segment analysis

Market segments

4.3 Market size 2025

4.4 Market outlook: Forecast for 2025-2030

Chart on Global - Market size and forecast 2025-2030 ($ million)
Data Table on Global - Market size and forecast 2025-2030 ($ million)
Chart on Global Market: Year-over-year growth 2025-2030 (%)
Data Table on Global Market: Year-over-year growth 2025-2030 (%)

5. Historic Market Size

5.1 Global Insomnia Therapeutics Market 2020 - 2024

Historic Market Size - Data Table on Global Insomnia Therapeutics Market 2020 - 2024 ($ million)

5.2 Type segment analysis 2020 - 2024

Historic Market Size - Type Segment 2020 - 2024 ($ million)

5.3 Distribution Channel segment analysis 2020 - 2024

Historic Market Size - Distribution Channel Segment 2020 - 2024 ($ million)

5.4 Drug Class segment analysis 2020 - 2024

Historic Market Size - Drug Class Segment 2020 - 2024 ($ million)

5.5 Geography segment analysis 2020 - 2024

Historic Market Size - Geography Segment 2020 - 2024 ($ million)

5.6 Country segment analysis 2020 - 2024

Historic Market Size - Country Segment 2020 - 2024 ($ million)

6. Qualitative Analysis

6.1 Impact of AI on Global Insomnia Therapeutics Market

6.2 Impact of Geopolitical Conflicts on Global Insomnia Therapeutics Market

7. Five Forces Analysis

7.1 Five forces summary

Five forces analysis - Comparison between 2025 and 2030

7.2 Bargaining power of buyers

Bargaining power of buyers - Impact of key factors 2025 and 2030

7.3 Bargaining power of suppliers

Bargaining power of suppliers - Impact of key factors in 2025 and 2030

7.4 Threat of new entrants

Threat of new entrants - Impact of key factors in 2025 and 2030

7.5 Threat of substitutes

Threat of substitutes - Impact of key factors in 2025 and 2030

7.6 Threat of rivalry

Threat of rivalry - Impact of key factors in 2025 and 2030

7.7 Market condition

Chart on Market condition - Five forces 2025 and 2030

8. Market Segmentation by Type

8.1 Market segments

Chart on Type - Market share 2025-2030 (%)
Data Table on Type - Market share 2025-2030 (%)

8.2 Comparison by Type

Chart on Comparison by Type
Data Table on Comparison by Type

8.3 Drug - Market size and forecast 2025-2030

Chart on Drug - Market size and forecast 2025-2030 ($ million)
Data Table on Drug - Market size and forecast 2025-2030 ($ million)
Chart on Drug - Year-over-year growth 2025-2030 (%)
Data Table on Drug - Year-over-year growth 2025-2030 (%)

8.4 Devices - Market size and forecast 2025-2030

Chart on Devices - Market size and forecast 2025-2030 ($ million)
Data Table on Devices - Market size and forecast 2025-2030 ($ million)
Chart on Devices - Year-over-year growth 2025-2030 (%)
Data Table on Devices - Year-over-year growth 2025-2030 (%)

8.5 Market opportunity by Type

Market opportunity by Type ($ million)
Data Table on Market opportunity by Type ($ million)

9. Market Segmentation by Distribution Channel

9.1 Market segments

Chart on Distribution Channel - Market share 2025-2030 (%)
Data Table on Distribution Channel - Market share 2025-2030 (%)

9.2 Comparison by Distribution Channel

Chart on Comparison by Distribution Channel
Data Table on Comparison by Distribution Channel

9.3 Prescription - Market size and forecast 2025-2030

Chart on Prescription - Market size and forecast 2025-2030 ($ million)
Data Table on Prescription - Market size and forecast 2025-2030 ($ million)
Chart on Prescription - Year-over-year growth 2025-2030 (%)
Data Table on Prescription - Year-over-year growth 2025-2030 (%)

9.4 OTC - Market size and forecast 2025-2030

Chart on OTC - Market size and forecast 2025-2030 ($ million)
Data Table on OTC - Market size and forecast 2025-2030 ($ million)
Chart on OTC - Year-over-year growth 2025-2030 (%)
Data Table on OTC - Year-over-year growth 2025-2030 (%)

9.5 Market opportunity by Distribution Channel

Market opportunity by Distribution Channel ($ million)
Data Table on Market opportunity by Distribution Channel ($ million)

10. Market Segmentation by Drug Class

10.1 Market segments

Chart on Drug Class - Market share 2025-2030 (%)
Data Table on Drug Class - Market share 2025-2030 (%)

10.2 Comparison by Drug Class

Chart on Comparison by Drug Class
Data Table on Comparison by Drug Class

10.3 Non-benzodiazepines - Market size and forecast 2025-2030

Chart on Non-benzodiazepines - Market size and forecast 2025-2030 ($ million)
Data Table on Non-benzodiazepines - Market size and forecast 2025-2030 ($ million)
Chart on Non-benzodiazepines - Year-over-year growth 2025-2030 (%)
Data Table on Non-benzodiazepines - Year-over-year growth 2025-2030 (%)

10.4 Benzodiazepines - Market size and forecast 2025-2030

Chart on Benzodiazepines - Market size and forecast 2025-2030 ($ million)
Data Table on Benzodiazepines - Market size and forecast 2025-2030 ($ million)
Chart on Benzodiazepines - Year-over-year growth 2025-2030 (%)
Data Table on Benzodiazepines - Year-over-year growth 2025-2030 (%)

10.5 Antidepressants - Market size and forecast 2025-2030

Chart on Antidepressants - Market size and forecast 2025-2030 ($ million)
Data Table on Antidepressants - Market size and forecast 2025-2030 ($ million)
Chart on Antidepressants - Year-over-year growth 2025-2030 (%)
Data Table on Antidepressants - Year-over-year growth 2025-2030 (%)

10.6 Orexin receptor antagonists - Market size and forecast 2025-2030

Chart on Orexin receptor antagonists - Market size and forecast 2025-2030 ($ million)
Data Table on Orexin receptor antagonists - Market size and forecast 2025-2030 ($ million)
Chart on Orexin receptor antagonists - Year-over-year growth 2025-2030 (%)
Data Table on Orexin receptor antagonists - Year-over-year growth 2025-2030 (%)

10.7 Melatonin receptor agonists - Market size and forecast 2025-2030

Chart on Melatonin receptor agonists - Market size and forecast 2025-2030 ($ million)
Data Table on Melatonin receptor agonists - Market size and forecast 2025-2030 ($ million)
Chart on Melatonin receptor agonists - Year-over-year growth 2025-2030 (%)
Data Table on Melatonin receptor agonists - Year-over-year growth 2025-2030 (%)

10.8 Market opportunity by Drug Class

Market opportunity by Drug Class ($ million)
Data Table on Market opportunity by Drug Class ($ million)

11. Customer Landscape

11.1 Customer landscape overview

Analysis of price sensitivity, lifecycle, customer purchase basket, adoption rates, and purchase criteria

12. Geographic Landscape

12.1 Geographic segmentation

Chart on Market share by geography 2025-2030 (%)
Data Table on Market share by geography 2025-2030 (%)

12.2 Geographic comparison

Chart on Geographic comparison
Data Table on Geographic comparison

12.3 North America - Market size and forecast 2025-2030

Chart on North America - Market size and forecast 2025-2030 ($ million)
Data Table on North America - Market size and forecast 2025-2030 ($ million)
Chart on North America - Year-over-year growth 2025-2030 (%)
Data Table on North America - Year-over-year growth 2025-2030 (%)
Chart on Regional Comparison - North America
Data Table on Regional Comparison - North America

12.3.1 US - Market size and forecast 2025-2030

Chart on US - Market size and forecast 2025-2030 ($ million)
Data Table on US - Market size and forecast 2025-2030 ($ million)
Chart on US - Year-over-year growth 2025-2030 (%)
Data Table on US - Year-over-year growth 2025-2030 (%)

12.3.2 Canada - Market size and forecast 2025-2030

Chart on Canada - Market size and forecast 2025-2030 ($ million)
Data Table on Canada - Market size and forecast 2025-2030 ($ million)
Chart on Canada - Year-over-year growth 2025-2030 (%)
Data Table on Canada - Year-over-year growth 2025-2030 (%)

12.3.3 Mexico - Market size and forecast 2025-2030

Chart on Mexico - Market size and forecast 2025-2030 ($ million)
Data Table on Mexico - Market size and forecast 2025-2030 ($ million)
Chart on Mexico - Year-over-year growth 2025-2030 (%)
Data Table on Mexico - Year-over-year growth 2025-2030 (%)

12.4 Asia - Market size and forecast 2025-2030

Chart on Asia - Market size and forecast 2025-2030 ($ million)
Data Table on Asia - Market size and forecast 2025-2030 ($ million)
Chart on Asia - Year-over-year growth 2025-2030 (%)
Data Table on Asia - Year-over-year growth 2025-2030 (%)
Chart on Regional Comparison - Asia
Data Table on Regional Comparison - Asia

12.4.1 China - Market size and forecast 2025-2030

Chart on China - Market size and forecast 2025-2030 ($ million)
Data Table on China - Market size and forecast 2025-2030 ($ million)
Chart on China - Year-over-year growth 2025-2030 (%)
Data Table on China - Year-over-year growth 2025-2030 (%)

12.4.2 India - Market size and forecast 2025-2030

Chart on India - Market size and forecast 2025-2030 ($ million)
Data Table on India - Market size and forecast 2025-2030 ($ million)
Chart on India - Year-over-year growth 2025-2030 (%)
Data Table on India - Year-over-year growth 2025-2030 (%)

12.4.3 Japan - Market size and forecast 2025-2030

Chart on Japan - Market size and forecast 2025-2030 ($ million)
Data Table on Japan - Market size and forecast 2025-2030 ($ million)
Chart on Japan - Year-over-year growth 2025-2030 (%)
Data Table on Japan - Year-over-year growth 2025-2030 (%)

12.4.4 South Korea - Market size and forecast 2025-2030

Chart on South Korea - Market size and forecast 2025-2030 ($ million)
Data Table on South Korea - Market size and forecast 2025-2030 ($ million)
Chart on South Korea - Year-over-year growth 2025-2030 (%)
Data Table on South Korea - Year-over-year growth 2025-2030 (%)

12.4.5 Indonesia - Market size and forecast 2025-2030

Chart on Indonesia - Market size and forecast 2025-2030 ($ million)
Data Table on Indonesia - Market size and forecast 2025-2030 ($ million)
Chart on Indonesia - Year-over-year growth 2025-2030 (%)
Data Table on Indonesia - Year-over-year growth 2025-2030 (%)

12.4.6 Thailand - Market size and forecast 2025-2030

Chart on Thailand - Market size and forecast 2025-2030 ($ million)
Data Table on Thailand - Market size and forecast 2025-2030 ($ million)
Chart on Thailand - Year-over-year growth 2025-2030 (%)
Data Table on Thailand - Year-over-year growth 2025-2030 (%)

12.5 Europe - Market size and forecast 2025-2030

Chart on Europe - Market size and forecast 2025-2030 ($ million)
Data Table on Europe - Market size and forecast 2025-2030 ($ million)
Chart on Europe - Year-over-year growth 2025-2030 (%)
Data Table on Europe - Year-over-year growth 2025-2030 (%)
Chart on Regional Comparison - Europe
Data Table on Regional Comparison - Europe

12.5.1 Germany - Market size and forecast 2025-2030

Chart on Germany - Market size and forecast 2025-2030 ($ million)
Data Table on Germany - Market size and forecast 2025-2030 ($ million)
Chart on Germany - Year-over-year growth 2025-2030 (%)
Data Table on Germany - Year-over-year growth 2025-2030 (%)

12.5.2 UK - Market size and forecast 2025-2030

Chart on UK - Market size and forecast 2025-2030 ($ million)
Data Table on UK - Market size and forecast 2025-2030 ($ million)
Chart on UK - Year-over-year growth 2025-2030 (%)
Data Table on UK - Year-over-year growth 2025-2030 (%)

12.5.3 France - Market size and forecast 2025-2030

Chart on France - Market size and forecast 2025-2030 ($ million)
Data Table on France - Market size and forecast 2025-2030 ($ million)
Chart on France - Year-over-year growth 2025-2030 (%)
Data Table on France - Year-over-year growth 2025-2030 (%)

12.5.4 Italy - Market size and forecast 2025-2030

Chart on Italy - Market size and forecast 2025-2030 ($ million)
Data Table on Italy - Market size and forecast 2025-2030 ($ million)
Chart on Italy - Year-over-year growth 2025-2030 (%)
Data Table on Italy - Year-over-year growth 2025-2030 (%)

12.5.5 Spain - Market size and forecast 2025-2030

Chart on Spain - Market size and forecast 2025-2030 ($ million)
Data Table on Spain - Market size and forecast 2025-2030 ($ million)
Chart on Spain - Year-over-year growth 2025-2030 (%)
Data Table on Spain - Year-over-year growth 2025-2030 (%)

12.5.6 The Netherlands - Market size and forecast 2025-2030

Chart on The Netherlands - Market size and forecast 2025-2030 ($ million)
Data Table on The Netherlands - Market size and forecast 2025-2030 ($ million)
Chart on The Netherlands - Year-over-year growth 2025-2030 (%)
Data Table on The Netherlands - Year-over-year growth 2025-2030 (%)

12.6 Rest of World (ROW) - Market size and forecast 2025-2030

Chart on Rest of World (ROW) - Market size and forecast 2025-2030 ($ million)
Data Table on Rest of World (ROW) - Market size and forecast 2025-2030 ($ million)
Chart on Rest of World (ROW) - Year-over-year growth 2025-2030 (%)
Data Table on Rest of World (ROW) - Year-over-year growth 2025-2030 (%)
Chart on Regional Comparison - Rest of World (ROW)
Data Table on Regional Comparison - Rest of World (ROW)

12.6.1 Brazil - Market size and forecast 2025-2030

Chart on Brazil - Market size and forecast 2025-2030 ($ million)
Data Table on Brazil - Market size and forecast 2025-2030 ($ million)
Chart on Brazil - Year-over-year growth 2025-2030 (%)
Data Table on Brazil - Year-over-year growth 2025-2030 (%)

12.6.2 Saudi Arabia - Market size and forecast 2025-2030

Chart on Saudi Arabia - Market size and forecast 2025-2030 ($ million)
Data Table on Saudi Arabia - Market size and forecast 2025-2030 ($ million)
Chart on Saudi Arabia - Year-over-year growth 2025-2030 (%)
Data Table on Saudi Arabia - Year-over-year growth 2025-2030 (%)

12.6.3 UAE - Market size and forecast 2025-2030

Chart on UAE - Market size and forecast 2025-2030 ($ million)
Data Table on UAE - Market size and forecast 2025-2030 ($ million)
Chart on UAE - Year-over-year growth 2025-2030 (%)
Data Table on UAE - Year-over-year growth 2025-2030 (%)

12.6.4 Turkey - Market size and forecast 2025-2030

Chart on Turkey - Market size and forecast 2025-2030 ($ million)
Data Table on Turkey - Market size and forecast 2025-2030 ($ million)
Chart on Turkey - Year-over-year growth 2025-2030 (%)
Data Table on Turkey - Year-over-year growth 2025-2030 (%)

12.6.5 Argentina - Market size and forecast 2025-2030

Chart on Argentina - Market size and forecast 2025-2030 ($ million)
Data Table on Argentina - Market size and forecast 2025-2030 ($ million)
Chart on Argentina - Year-over-year growth 2025-2030 (%)
Data Table on Argentina - Year-over-year growth 2025-2030 (%)

12.6.6 Colombia - Market size and forecast 2025-2030

Chart on Colombia - Market size and forecast 2025-2030 ($ million)
Data Table on Colombia - Market size and forecast 2025-2030 ($ million)
Chart on Colombia - Year-over-year growth 2025-2030 (%)
Data Table on Colombia - Year-over-year growth 2025-2030 (%)

12.6.7 South Africa - Market size and forecast 2025-2030

Chart on South Africa - Market size and forecast 2025-2030 ($ million)
Data Table on South Africa - Market size and forecast 2025-2030 ($ million)
Chart on South Africa - Year-over-year growth 2025-2030 (%)
Data Table on South Africa - Year-over-year growth 2025-2030 (%)

12.6.8 Israel - Market size and forecast 2025-2030

Chart on Israel - Market size and forecast 2025-2030 ($ million)
Data Table on Israel - Market size and forecast 2025-2030 ($ million)
Chart on Israel - Year-over-year growth 2025-2030 (%)
Data Table on Israel - Year-over-year growth 2025-2030 (%)

12.7 Market opportunity by geography

Market opportunity by geography ($ million)
Data Tables on Market opportunity by geography ($ million)

13. Drivers, Challenges, and Opportunity

13.1 Market drivers

Increasing prevalence of insomnia is increasing market demand
Technological advancements in diagnostics and treatment
Rising healthcare expenditure and insurance coverage

13.2 Market challenges

Lack of awareness of insomnia as disease
Concerns about safety and efficacy of insomnia therapeutics
Regulatory and reimbursement issues in insomnia therapeutics

13.3 Impact of drivers and challenges

Impact of drivers and challenges in 2025 and 2030

13.4 Market opportunities

Increased focus on non-pharmacological treatments
Technological advancements in sleep monitoring and tracking
Growing awareness and acceptance of importance of mental health

14. Competitive Landscape

14.1 Overview

14.2

Overview on criticality of inputs and factors of differentiation

14.3 Landscape disruption

Overview on factors of disruption

14.4 Industry risks

Impact of key risks on business

15. Competitive Analysis

15.1 Companies profiled

Companies covered

15.2 Company ranking index

15.3 Market positioning of companies

Matrix on companies position and classification

15.4 Aurobindo Pharma Ltd.

Aurobindo Pharma Ltd. - Overview
Aurobindo Pharma Ltd. - Business segments
Aurobindo Pharma Ltd. - Key news
Aurobindo Pharma Ltd. - Key offerings
Aurobindo Pharma Ltd. - Segment focus
SWOT

15.5 BigHealth

BigHealth - Overview
BigHealth - Product / Service
BigHealth - Key offerings
SWOT

15.6 Currax Pharmaceuticals LLC

Currax Pharmaceuticals LLC - Overview
Currax Pharmaceuticals LLC - Product / Service
Currax Pharmaceuticals LLC - Key offerings
SWOT

15.7 Dr. Reddys Laboratories Ltd.

Dr. Reddys Laboratories Ltd. - Overview
Dr. Reddys Laboratories Ltd. - Business segments
Dr. Reddys Laboratories Ltd. - Key news
Dr. Reddys Laboratories Ltd. - Key offerings
Dr. Reddys Laboratories Ltd. - Segment focus
SWOT

15.8 Eisai Co. Ltd.

Eisai Co. Ltd. - Overview
Eisai Co. Ltd. - Business segments
Eisai Co. Ltd. - Key offerings
Eisai Co. Ltd. - Segment focus
SWOT

15.9 Idorsia Pharmaceuticals Ltd.

Idorsia Pharmaceuticals Ltd. - Overview
Idorsia Pharmaceuticals Ltd. - Product / Service
Idorsia Pharmaceuticals Ltd. - Key news
Idorsia Pharmaceuticals Ltd. - Key offerings
SWOT

15.10 Lupin Ltd.

Lupin Ltd. - Overview
Lupin Ltd. - Business segments
Lupin Ltd. - Key news
Lupin Ltd. - Key offerings
Lupin Ltd. - Segment focus
SWOT

15.11 Merck and Co. Inc.

Merck and Co. Inc. - Overview
Merck and Co. Inc. - Business segments
Merck and Co. Inc. - Key news
Merck and Co. Inc. - Key offerings
Merck and Co. Inc. - Segment focus
SWOT

15.12 Pfizer Inc.

Pfizer Inc. - Overview
Pfizer Inc. - Business segments
Pfizer Inc. - Key news
Pfizer Inc. - Key offerings
Pfizer Inc. - Segment focus
SWOT

15.13 Sanofi SA

Sanofi SA - Overview
Sanofi SA - Business segments
Sanofi SA - Key news
Sanofi SA - Key offerings
Sanofi SA - Segment focus
SWOT

15.14 Sumitomo Pharma Co. Ltd.

Sumitomo Pharma Co. Ltd. - Overview
Sumitomo Pharma Co. Ltd. - Business segments
Sumitomo Pharma Co. Ltd. - Key offerings
Sumitomo Pharma Co. Ltd. - Segment focus
SWOT

15.15 Takeda Pharmaceutical Ltd.

Takeda Pharmaceutical Ltd. - Overview
Takeda Pharmaceutical Ltd. - Business segments
Takeda Pharmaceutical Ltd. - Key news
Takeda Pharmaceutical Ltd. - Key offerings
Takeda Pharmaceutical Ltd. - Segment focus
SWOT

15.16 Teva Pharmaceutical Ltd.

Teva Pharmaceutical Ltd. - Overview
Teva Pharmaceutical Ltd. - Business segments
Teva Pharmaceutical Ltd. - Key news
Teva Pharmaceutical Ltd. - Key offerings
Teva Pharmaceutical Ltd. - Segment focus
SWOT

15.17 Vanda Pharmaceuticals Inc.

Vanda Pharmaceuticals Inc. - Overview
Vanda Pharmaceuticals Inc. - Product / Service
Vanda Pharmaceuticals Inc. - Key news
Vanda Pharmaceuticals Inc. - Key offerings
SWOT

15.18 Zydus Lifesciences Ltd.

Zydus Lifesciences Ltd. - Overview
Zydus Lifesciences Ltd. - Business segments
Zydus Lifesciences Ltd. - Key news
Zydus Lifesciences Ltd. - Key offerings
Zydus Lifesciences Ltd. - Segment focus
SWOT

16. Appendix

16.1 Scope of the report

Market definition
Objectives
Notes and caveats

16.2 Inclusions and exclusions checklist

Inclusions checklist
Exclusions checklist

16.3 Currency conversion rates for US$

16.4 Research methodology

16.5 Data procurement

Information sources

16.6 Data validation

16.7 Validation techniques employed for market sizing

16.8 Data synthesis

16.9 360 degree market analysis

16.10 List of abbreviations

Research Methodology

Technavio presents a detailed picture of the market by way of study, synthesis, and summation of data from multiple sources. The analysts have presented the various facets of the market with a particular focus on identifying the key industry influencers. The data thus presented is comprehensive, reliable, and the result of extensive research, both primary and secondary.

INFORMATION SOURCES

Primary sources

  • Manufacturers and suppliers
  • Channel partners
  • Industry experts
  • Strategic decision makers

Secondary sources

  • Industry journals and periodicals
  • Government data
  • Financial reports of key industry players
  • Historical data
  • Press releases

DATA ANALYSIS

Data Synthesis

  • Collation of data
  • Estimation of key figures
  • Analysis of derived insights

Data Validation

  • Triangulation with data models
  • Reference against proprietary databases
  • Corroboration with industry experts

REPORT WRITING

Qualitative

  • Market drivers
  • Market challenges
  • Market trends
  • Five forces analysis

Quantitative

  • Market size and forecast
  • Market segmentation
  • Geographical insights
  • Competitive landscape

Interested in this report?

Get your sample now to see our research methodology and insights!

Download Now

Frequently Asked Questions

Insomnia Therapeutics market growth will increase by USD 1288.6 million during 2026-2030.

The Insomnia Therapeutics market is expected to grow at a CAGR of 6% during 2026-2030.

Insomnia Therapeutics market is segmented by Type (Drug, Devices) Distribution channel (Prescription, OTC) Drug class (Non-benzodiazepines, Benzodiazepines, Antidepressants, Orexin receptor antagonists, Melatonin receptor agonists)

Aurobindo Pharma Ltd., BigHealth, Cipla Inc., Currax Pharmaceuticals LLC, Dr. Reddys Laboratories Ltd., Eisai Co. Ltd., Hikma Pharmaceuticals Plc, Idorsia Pharmaceuticals Ltd., Jazz Pharmaceuticals Plc, Lupin Ltd., Merck and Co. Inc., Pfizer Inc., Sanofi SA, Sumitomo Pharma Co. Ltd., Sun Pharmaceutical Industries, Takeda Pharmaceutical Ltd., Teva Pharmaceutical Ltd., Vanda Pharmaceuticals Inc., Viatris Inc., Zydus Lifesciences Ltd. are a few of the key vendors in the Insomnia Therapeutics market.

North America will register the highest growth rate of 58.8% among the other regions. Therefore, the Insomnia Therapeutics market in North America is expected to garner significant business opportunities for the vendors during the forecast period.

US, Canada, Mexico, China, India, Japan, South Korea, Indonesia, Thailand, Germany, UK, France, Italy, Spain, The Netherlands, Brazil, Saudi Arabia, UAE, Turkey, Argentina, Colombia, South Africa, Israel

  • Increasing prevalence of insomnia is increasing market demand is the driving factor this market.

The Insomnia Therapeutics market vendors should focus on grabbing business opportunities from the Type segment as it accounted for the largest market share in the base year.
RIA - Research AI Assistant
Ask RIA