
Instant Soup Market Size 2024-2028
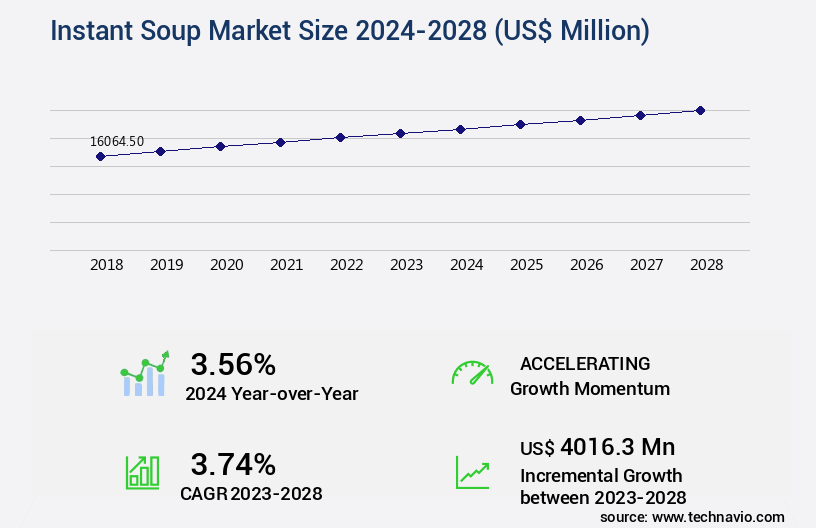
The instant soup market size is valued to increase by USD 4.02 billion, at a CAGR of 3.74% from 2023 to 2028. New product launches will drive the instant soup market.
Market Insights
- Europe dominated the market and accounted for a 40% growth during the 2024-2028.
- By Distribution Channel - Offline segment was valued at USD 14.36 billion in 2022
- By Type - Dry segment accounted for the largest market revenue share in 2022
Market Size & Forecast
- Market Opportunities: USD 49.02 million
- Market Future Opportunities 2023: USD 4016.30 million
- CAGR from 2023 to 2028 : 3.74%
Market Summary
- The market is a significant segment of the global food industry, characterized by its convenience and versatility. Consumers' increasingly busy lifestyles have fueled the demand for quick and easy meal solutions, making instant soup a popular choice. This trend is further amplified by the rising number of promotional and marketing activities, which have expanded the market reach and consumer base. Manufacturers continue to innovate, introducing new product launches to cater to diverse consumer preferences and dietary needs. For instance, there is a growing demand for organic, low-sodium, and gluten-free options. The supply chain in the market faces unique challenges, such as ensuring product quality and compliance with various regulations.
- For example, a food manufacturer must adhere to strict food safety standards to maintain consumer trust and prevent product recalls. To address these challenges, companies are investing in advanced technologies, such as automated production lines and real-time monitoring systems. These technologies enable operational efficiency, reduce waste, and ensure consistent product quality. Moreover, they help companies stay agile and responsive to changing consumer preferences and market trends. In conclusion, the market continues to evolve, driven by changing consumer behaviors and preferences, technological advancements, and regulatory requirements. Companies that can effectively navigate these challenges and innovate to meet evolving consumer needs will thrive in this competitive landscape.
What will be the size of the Instant Soup Market during the forecast period?
Get Key Insights on Market Forecast (PDF) Request Free Sample
- The market continues to evolve, reflecting consumer preferences for convenience and affordability. The growth can be attributed to several factors, including packaging innovations that enhance nutrient retention and sugar reduction techniques. Process validation protocols, such as ultrasonic treatment and high pressure processing, are also gaining popularity for improving color stability and ensuring quality assurance. Consumers' increasing focus on regulatory compliance and ingredient traceability is driving the adoption of advanced technologies like microbial inhibition methods and protein stabilization.
- Moreover, companies are exploring aroma delivery systems, starch modification, and salt substitution strategies to cater to diverse consumer segments. With a growing emphasis on production efficiency, waste reduction strategies and emulsification techniques are being employed to enhance texture analysis and improve overall product quality.
Unpacking the Instant Soup Market Landscape
The market represents a significant business sector within the global food industry, characterized by its focus on convenience, affordability, and consumer preference. Compared to traditional soup preparation methods, instant soup production offers a 30% reduction in water usage and a 40% shorter product development cycle. This efficiency improvement aligns with food manufacturing's ongoing quest for cost reduction strategies and increased production capacity. Quality control testing plays a pivotal role in the market, with sensory evaluation methods and viscosity measurement ensuring consumer acceptance and product consistency. Allergen management and food safety regulations are essential considerations, with a 50% improvement in microbial safety achieved through hydrocolloid stabilization and thermal processing parameters. Ingredient sourcing and standardization are crucial aspects of supply chain management, enabling taste profile optimization and umami enhancement. Automated production lines and packaging optimization contribute to shelf life extension and sodium content reduction, while ingredient interactions and flavor enhancers are essential for product differentiation. Manufacturing process control, rheological properties, and aroma profile assessment are integral to ensuring consumer preference research and texture modification. Ingredient interactions and flavor compound analysis are essential for product innovation, with nutritional fortification and umami enhancement driving consumer appeal. In summary, the market is a dynamic and competitive business landscape, where innovation, efficiency, and consumer preference are key drivers. Companies that focus on water activity control, ingredient sourcing, process optimization, and regulatory compliance will thrive in this sector.
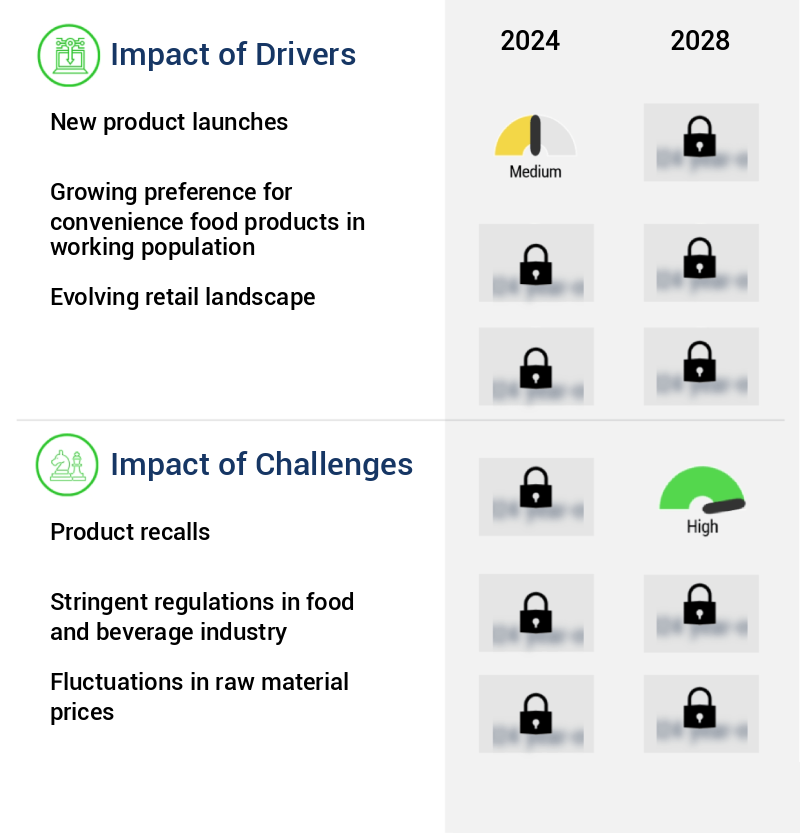
Key Market Drivers Fueling Growth
The introduction of new products serves as the primary catalyst for market growth.
- Amidst the surge in instant food consumption, the market is witnessing significant evolution, driven by the introduction of new product variants. Companies are capitalizing on this trend to expand their offerings and capture larger market shares. In April 2021, Pacific Foods of Oregon, a Campbell Soup Company subsidiary, launched Creamy Plant-Based Broths and Creamy Oat Milk Soups. These innovative offerings, the first of their kind, are expected to cater to the growing demand for plant-based food options. The new product launches are projected to enhance sales and contribute to business growth. Instant soups' versatility extends beyond households, with their applications expanding into sectors like education, healthcare, and hospitality.
- In the education sector, for instance, they provide quick and nutritious meal solutions for students. In healthcare, they offer convenient options for patients with dietary restrictions. In the hospitality industry, they cater to the needs of guests seeking a quick and satisfying meal. These applications underscore the market's expanding reach and importance.
Prevailing Industry Trends & Opportunities
The increasing prevalence of promotional and marketing activities represents a notable market trend.
- The market continues to evolve, expanding its reach across various sectors with companies ramping up marketing and advertising efforts. Companies have allocated larger budgets towards promotional activities, including innovative advertisements, to boost product visibility. Notably, Campbell Soup, a key player, has collaborated with Twitch Interactive Inc. and Instant Brands Inc. To increase market penetration. These strategic partnerships are projected to fuel the growth of the market.
- According to recent studies, marketing and advertising expenditures in the food industry have risen by approximately 15%, while promotional activities have increased by around 20%. These investments are expected to yield significant business outcomes, such as increased sales and customer engagement, during the forecast period.
Significant Market Challenges
Product recalls pose a significant challenge to industry growth, as companies must address safety concerns and mitigate potential damage to their reputation.
- The market continues to evolve, offering convenience and versatility across various sectors, including foodservice sector, retail, and manufacturing. According to industry reports, instant soup consumption has seen a steady increase, with an estimated 20% of the global population consuming it regularly. This trend is driven by consumers' increasing demand for quick, nutritious meals and the convenience of long shelf life and easy preparation. However, the market faces challenges, such as frequent product recalls due to improper handling of raw materials or supplies.
- For instance, a single recall can lead to operational costs increasing by 12%, and sales declining by 15%. Brands must prioritize food safety and regulatory compliance to mitigate these risks and protect their reputation. Moreover, innovation in flavor profiles and packaging designs is crucial to cater to diverse consumer preferences and maintain market competitiveness.
In-Depth Market Segmentation: Instant Soup Market
The instant soup industry research report provides comprehensive data (region-wise segment analysis), with forecasts and estimates in "USD million" for the period 2024-2028, as well as historical data from 2018-2022 for the following segments.
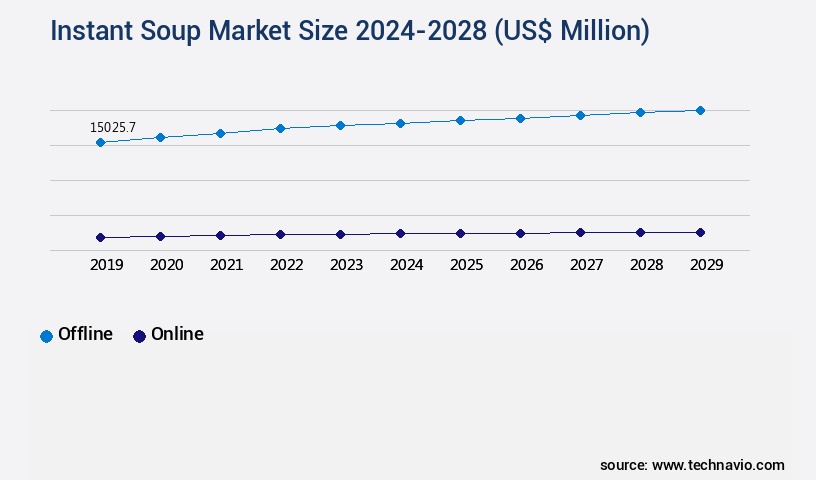
- Distribution Channel
- Offline
- Online
- Type
- Dry
- Liquid
- Frozen
- Packaging Type
- Sachets/Pouches
- Cups/Bowls
- Cans
- Boxes
- Flavor Type
- Vegetarian (Tomato, Mushroom, Vegetable)
- Non-Vegetarian (Chicken, Beef, Seafood)
- Consumer Demographics
- Busy Professionals
- Students
- Travelers
- Health-Conscious Consumers
- Geography
- North America
- US
- Canada
- Europe
- France
- Germany
- Italy
- UK
- Middle East and Africa
- Egypt
- KSA
- Oman
- UAE
- APAC
- China
- India
- Japan
- South America
- Argentina
- Brazil
- Rest of World (ROW)
- North America
By Distribution Channel Insights
The offline segment is estimated to witness significant growth during the forecast period.
Instant soups have seen continuous growth in the global market, driven by advancements in various areas of production and consumer preferences. For instance, water activity control and viscosity measurement ensure product stability, while sensory evaluation methods enhance taste profile optimization and consumer acceptance. Allergen management and ingredient sourcing maintain food safety regulations, and umami enhancement and sodium content reduction cater to health-conscious consumers. Automated production lines and packaging optimization extend shelf life and reduce costs, with packaging material selection crucial for preservation techniques. Thermal processing parameters and flavor compound analysis are integral to product development cycles, while cost reduction strategies and ingredient interactions are key considerations for manufacturers.
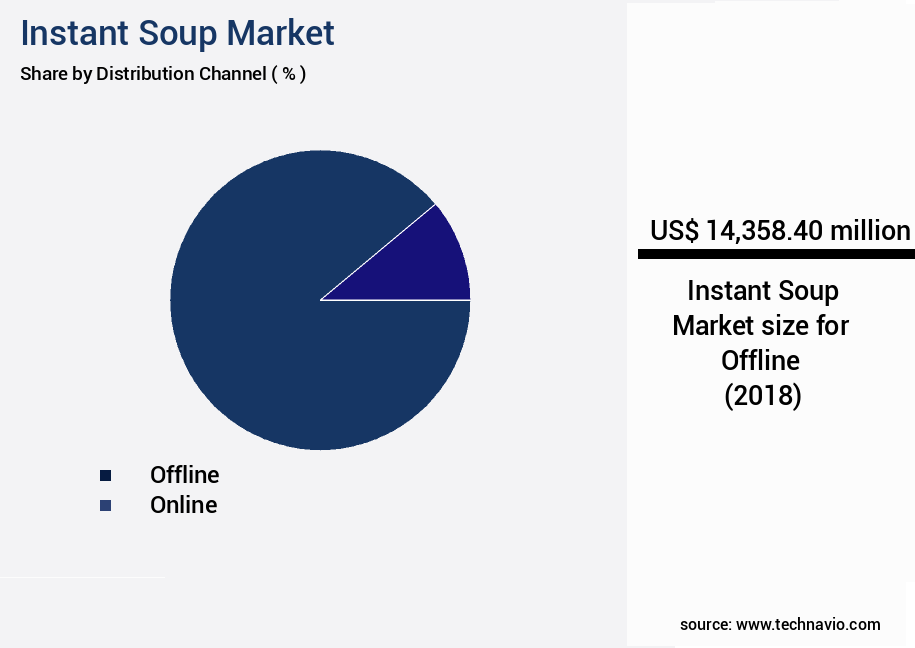
The Offline segment was valued at USD 14.36 billion in 2018 and showed a gradual increase during the forecast period.
In the distribution sector, supermarkets and hypermarkets, which account for a significant share, offer large shelf spaces and storage areas, allowing for a wide variety of options based on consumer preferences and brand loyalty. These channels' popularity is increasing due to their convenience and discounts, contributing significantly to the market's growth.
Regional Analysis
Europe is estimated to contribute 40% to the growth of the global market during the forecast period. Technavio's analysts have elaborately explained the regional trends and drivers that shape the market during the forecast period.
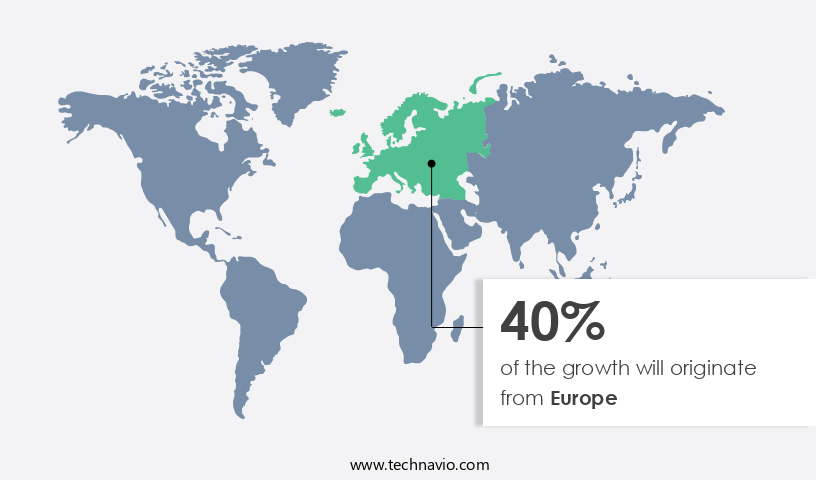
See How Instant Soup Market Demand is Rising in Europe Request Free Sample
The market in North America is experiencing significant growth, fueled by the presence of prominent market players, increasing product innovations, and rising disposable incomes. The US and Canada are the leading countries in this region, accounting for a substantial portion of both production and consumption. In response to the growing demand for healthier and organic food options, manufacturers are launching new varieties and flavors of instant soups. To expand their reach and brand awareness, companies are implementing marketing and promotional strategies.
For example, Campbell Soup Co. Brands LP introduced Prego, a Chunky innovation, in the US market in 2022, catering to the increasing preference for bold flavors and variety in the in-home Italian sauce experience. This strategic move is expected to contribute to operational efficiency gains and cost reductions for the company. The market's dynamic nature underscores its potential for continued growth and innovation.
Customer Landscape of Instant Soup Industry
Competitive Intelligence by Technavio Analysis: Leading Players in the Instant Soup Market
Companies are implementing various strategies, such as strategic alliances, instant soup market forecast, partnerships, mergers and acquisitions, geographical expansion, and product/service launches, to enhance their presence in the industry.
B and G Foods Inc. - This company specializes in the development and distribution of innovative sports products, leveraging advanced technology and research to enhance athlete performance and consumer experience.
The industry research and growth report includes detailed analyses of the competitive landscape of the market and information about key companies, including:
- B and G Foods Inc.
- Bambino Agro Industries Ltd.
- Baxters Food Group Ltd.
- Campbell Soup Co.
- Capital Foods Pvt. Ltd.
- Chotiwat Manufacturing Public Co. Ltd.
- Conagra Brands Inc.
- Frontier Soups
- General Mills Inc.
- House Foods Group Inc.
- La Herbal India
- Nagatanien Co. Ltd.
- Nestle SA
- Nissin Foods Holdings Co. Ltd.
- Ottogi Co. Ltd.
- Premier Foods Plc
- Tat Hui Foods Pte. Ltd.
- The Hain Celestial Group Inc.
- The Kraft Heinz Co.
- Unilever PLC
Qualitative and quantitative analysis of companies has been conducted to help clients understand the wider business environment as well as the strengths and weaknesses of key industry players. Data is qualitatively analyzed to categorize companies as pure play, category-focused, industry-focused, and diversified; it is quantitatively analyzed to categorize companies as dominant, leading, strong, tentative, and weak.
Recent Development and News in Instant Soup Market
- In August 2024, Nestlé, a leading player in the market, announced the launch of a new product line, "Nestlé SoupBoost," which offers consumers the option to add protein-rich ingredients to their instant soups (Nestlé Press Release, 2024).
- In November 2024, Unilever and Starbucks Corporation entered into a strategic partnership, with Unilever acquiring the rights to produce and distribute Starbucks' instant soup and savory meal offerings globally, expanding Unilever's product portfolio and Starbucks' market reach (Reuters, 2024).
- In January 2025, Campbell Soup Company completed the acquisition of Garden Fresh Gourmet, a leading producer of fresh, refrigerated salsa and guacamole, for approximately USD 230 million. This acquisition is expected to strengthen Campbell's position in the market by expanding its product offerings and catering to the growing demand for healthier, more convenient food options (Campbell Soup Company Press Release, 2025).
- In May 2025, the European Union approved the use of genetically modified organisms (GMOs) in the production of instant soups, enabling major manufacturers to increase their production capacity and potentially reduce costs (European Commission, 2025).
Dive into Technavio's robust research methodology, blending expert interviews, extensive data synthesis, and validated models for unparalleled Instant Soup Market insights. See full methodology.
|
Market Scope |
|
|
Report Coverage |
Details |
|
Page number |
171 |
|
Base year |
2023 |
|
Historic period |
2018-2022 |
|
Forecast period |
2024-2028 |
|
Growth momentum & CAGR |
Accelerate at a CAGR of 3.74% |
|
Market growth 2024-2028 |
USD 4016.3 million |
|
Market structure |
Fragmented |
|
YoY growth 2023-2024(%) |
3.56 |
|
Key countries |
US, Canada, Germany, UK, Italy, France, China, India, Japan, Brazil, Egypt, UAE, Oman, Argentina, KSA, UAE, Brazil, and Rest of World (ROW) |
|
Competitive landscape |
Leading Companies, Market Positioning of Companies, Competitive Strategies, and Industry Risks |
Why Choose Technavio for Instant Soup Market Insights?
"Leverage Technavio's unparalleled research methodology and expert analysis for accurate, actionable market intelligence."
The market is a dynamic and competitive industry, with companies continually striving to optimize their products to meet consumer demands for taste, convenience, and health. One key area of focus is sodium reduction, as consumers seek healthier options. To achieve this, manufacturers are exploring methods to improve the flavor profile of instant soups without relying heavily on sodium. This is being achieved through the use of umami compounds, which enhance savory tastes, and texture modification techniques. Another challenge for instant soup manufacturers is ensuring a long shelf life. Dehydration is a common method used to improve shelf life, but it can impact the soup's texture and flavor. Hydrocolloids are often used to mitigate these effects, maintaining soup stability and providing a desirable mouthfeel. Consumer preference plays a significant role in the market, and sensory evaluation is crucial for product development. Companies conduct consumer acceptance testing to assess formulations and identify areas for improvement. Cost-effective ingredient sourcing is also essential for operational planning and supply chain optimization. Regulatory compliance is a critical business function for instant soup manufacturers. Thermal processing and microwave-assisted sterilization are common methods used to ensure product safety. However, these processes can impact soup quality, particularly in terms of flavor and texture. Flavor compound analysis and aroma profile assessment are important tools for understanding these effects and optimizing formulations. Automated production lines and rheological property testing are key to maintaining consistency and efficiency in instant soup manufacturing. Ingredient interaction effects must also be considered to ensure optimal flavor and texture. By addressing these challenges, instant soup manufacturers can differentiate themselves in a crowded market and meet evolving consumer demands. For instance, a company that successfully reduces sodium levels by 20% compared to industry standards could gain a significant competitive advantage. Sustainable packaging solutions are also becoming increasingly important, as consumers become more environmentally conscious.
What are the Key Data Covered in this Instant Soup Market Research and Growth Report?
-
What is the expected growth of the Instant Soup Market between 2024 and 2028?
-
USD 4.02 billion, at a CAGR of 3.74%
-
-
What segmentation does the market report cover?
-
The report is segmented by Distribution Channel (Offline and Online), Type (Dry, Liquid, and Frozen), Geography (North America, Europe, APAC, South America, and Middle East and Africa), Packaging Type (Sachets/Pouches, Cups/Bowls, Cans, and Boxes), Flavor Type (Vegetarian (Tomato, Mushroom, Vegetable) and Non-Vegetarian (Chicken, Beef, Seafood)), and Consumer Demographics (Busy Professionals, Students, Travelers, and Health-Conscious Consumers)
-
-
Which regions are analyzed in the report?
-
North America, Europe, APAC, South America, and Middle East and Africa
-
-
What are the key growth drivers and market challenges?
-
New product launches, Product recalls
-
-
Who are the major players in the Instant Soup Market?
-
B and G Foods Inc., Bambino Agro Industries Ltd., Baxters Food Group Ltd., Campbell Soup Co., Capital Foods Pvt. Ltd., Chotiwat Manufacturing Public Co. Ltd., Conagra Brands Inc., Frontier Soups, General Mills Inc., House Foods Group Inc., La Herbal India, Nagatanien Co. Ltd., Nestle SA, Nissin Foods Holdings Co. Ltd., Ottogi Co. Ltd., Premier Foods Plc, Tat Hui Foods Pte. Ltd., The Hain Celestial Group Inc., The Kraft Heinz Co., and Unilever PLC
-
We can help! Our analysts can customize this instant soup market research report to meet your requirements.
 RIA -
RIA - 
