
Interventional Spine Devices Market Size 2025-2029
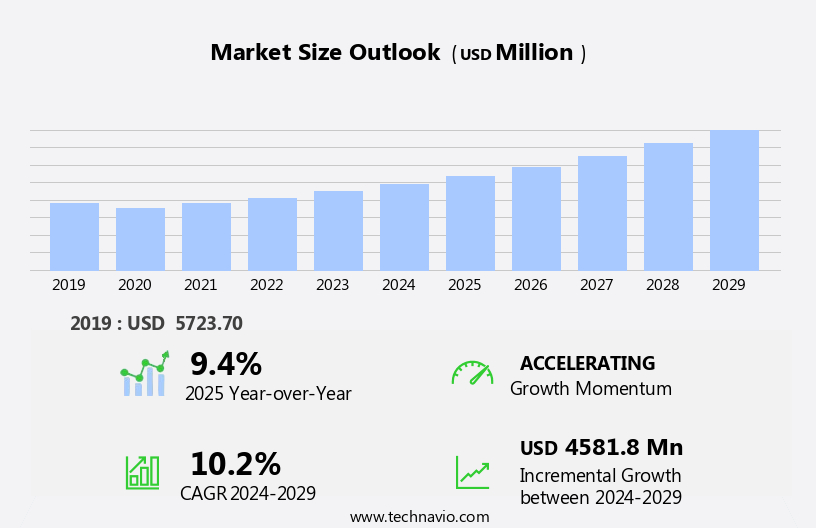
The interventional spine devices market size is forecast to increase by USD 4.58 billion at a CAGR of 10.2% between 2024 and 2029.
- The market is experiencing significant growth, driven primarily by the increasing incidence of spine and bone disorders worldwide. This minimally invasive procedure offers numerous benefits, including reduced recovery time and improved patient outcomes. However, market growth is not without challenges. Regulatory hurdles impact adoption, as stringent regulatory requirements and lengthy approval processes can delay product launch and limit market penetration. Furthermore, the availability of alternate medication options for treating spine disorders poses a threat to the market's growth potential. As a result, the market for spinal implants and surgical devices is poised for significant growth, presenting opportunities for medical device manufacturers and healthcare service providers specializing in spine and bone disorder management. Furthermore, the use of spinal trauma devices in ASCs is on the rise, as these centers offer a more convenient and cost-effective alternative for patients requiring urgent spine care.
- Addressing these challenges will require strategic partnerships, robust clinical evidence, and effective regulatory engagement from market players. Companies that successfully navigate these obstacles and capitalize on the growing demand for interventional spine devices will be well-positioned to capture market share and drive innovation in this dynamic and evolving market.
What will be the Size of the Interventional Spine Devices Market during the forecast period?
- The market is witnessing significant advancements, driven by the adoption of minimally invasive techniques such as endoscopic spine surgery. Surgical techniques continue to evolve, with a focus on patient education and post-operative rehabilitation for optimal outcomes. Implant design is increasingly prioritizing cost containment, motion preservation, and patient safety. Biologics manufacturing and tissue engineering are revolutionizing the industry, aligning with the trend towards precision medicine and evidence-based care. Surgical training is being enhanced through digital health solutions, artificial intelligence, and data analytics.
- Medical device regulations ensure biocompatible materials and intellectual property protection. Market penetration is bolstered by clinical research, clinical outcomes research, and percutaneous procedures. Personalized medicine and device integration are key differentiators in value-based care, as healthcare technology continues to advance. The IR market is experiencing significant growth due to several key trends. One major factor driving market expansion is the increasing demand for minimally invasive surgical procedures, which offer numerous benefits over traditional open surgeries, such as reduced recovery time, lower risk of complications, and decreased healthcare costs. This market encompasses a range of innovative medical devices, including imaging technologies such as CT scans, MRIs, and ultrasounds, as well as minimally invasive procedures like angioplasty balloons, stents, thrombectomy systems, embolization devices, biopsy needles, and catheters.
How is this Interventional Spine Devices Industry segmented?
The interventional spine devices industry research report provides comprehensive data (region-wise segment analysis), with forecasts and estimates in "USD million" for the period 2025-2029, as well as historical data from 2019-2023 for the following segments.
- Method
- Vertebroplasty
- Kyphoplasty
- Radiofrequency ablation
- Others
- End-user
- Hospital
- ASCs
- Product Type
- Spinal implants
- Spine biologics
- Spinal decompression devices
- VCF treatment devices
- Spine bone stimulators
- Application
- Degenerative disc disease
- Spinal stenosis
- Scoliosis and deformities
- Herniated discs
- Others
- Geography
- North America
- US
- Canada
- Mexico
- Europe
- France
- Germany
- Italy
- UK
- APAC
- China
- Japan
- South America
- Brazil
- Rest of World (ROW)
- North America
By Method Insights
The vertebroplasty segment is estimated to witness significant growth during the forecast period. In the realm of interventional spine devices, vertebroplasty, a minimally invasive surgical procedure, plays a significant role in addressing the needs of patients with vertebral compression fractures, often caused by osteoporosis. This outpatient treatment involves making a small incision on the patient's back to access the affected vertebra, where a medical-grade cement is injected to stabilize the bone and alleviate pain. The importance of device safety is paramount in this context, with regulatory bodies stringently enforcing quality standards to ensure patient safety. Spinal fusion, a common surgical intervention, may be employed in conjunction with vertebroplasty for added stability. The market is further fuelled by the ongoing development of cardiology-focused devices and the integration of genomics and biotechnology.
Clinical trials are ongoing to evaluate the efficacy of stem cell therapy in spinal conditions, offering potential for future breakthroughs. Postoperative recovery is a critical consideration, with patient outcomes being closely monitored to ensure optimal results. Pedicle screws and spinal instrumentation are essential components of spinal surgery, providing necessary support and stability.
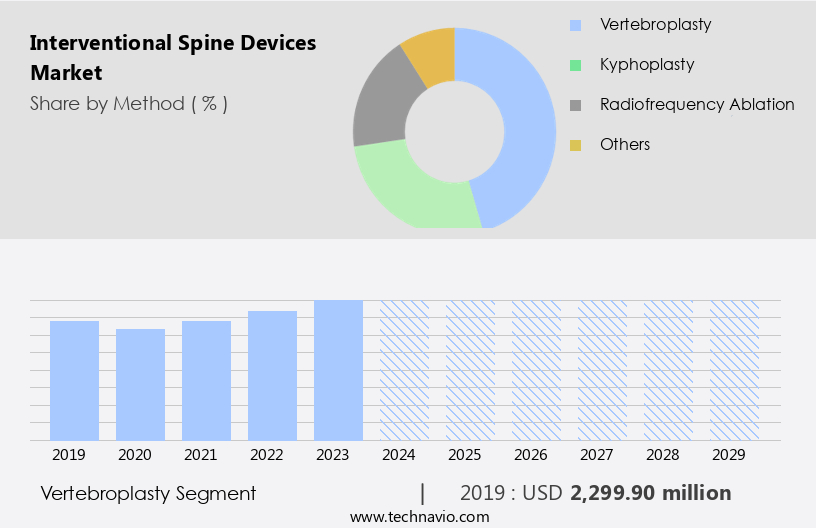
The Vertebroplasty segment was valued at USD 2.3 billion in 2019 and showed a gradual increase during the forecast period. Spine surgery, in general, is increasingly being performed in ambulatory surgery centers to reduce costs and improve patient recovery. Drug delivery systems and navigation systems are essential tools for spine surgeons, enabling precise placement of implants and effective pain management. Quality of life improvements is a key driver in the adoption of these interventional procedures, with insurance coverage playing a crucial role in patient access. Spinal trauma, degenerative disc disease, herniated disc, and spinal stenosis are common conditions treated with interventional pain management techniques, including radiofrequency ablation and spinal cord stimulators. Competitive advantage is sought through advancements in minimally invasive surgery, robotic surgery, and regenerative medicine, with interbody cages and bone graft substitutes being popular choices for spinal implants. Moreover, the integration of digital health technologies, such as smart inhalers and remote patient monitoring, is revolutionizing interventional radiology.
Regional Analysis
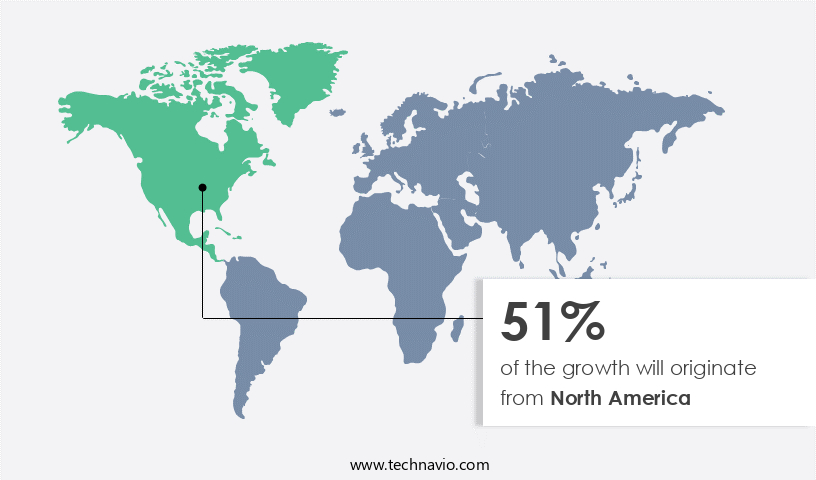
North America is estimated to contribute 51% to the growth of the global market during the forecast period. Technavio's analysts have elaborately explained the regional trends and drivers that shape the market during the forecast period.
The market in the US is witnessing significant growth due to the increasing prevalence of spinal disorders, including osteoporosis, spinal injuries, degenerative disc disease, and spinal stenosis. According to Medicare, approximately 1.2 million spinal surgeries are performed annually in the US, with procedures such as spinal fusion, decompression, and discectomy being common. The adoption of minimally invasive (MI) spinal surgeries is on the rise, as these procedures offer reduced surgical tissue trauma compared to traditional open surgical methods. This trend is particularly noticeable among the aging population, with a high volume of procedures performed on individuals aged 65 and above.
Interventional pain management, including drug delivery systems and spinal cord stimulators, is another driving factor in the market. Navigation systems and image-guided surgery are also gaining popularity, as they enhance the precision and accuracy of spine surgeries. Outpatient surgery centers and ambulatory surgery centers are increasingly offering spine procedures, providing patients with more convenient and cost-effective treatment options. Orthopedic surgeons and healthcare providers are increasingly focusing on patient outcomes and quality of life, leading to the adoption of advanced technologies such as pedicle screws, interbody cages, and bone graft substitutes. Clinical trials and research in regenerative medicine, including stem cell therapy, are also contributing to the market's growth. Stents, available in metal and fabric materials, are employed post-angioplasty to maintain arterial patency in coronary artery disease, ensuring enhanced blood flow to the heart.
Insurance coverage for spine procedures is a significant factor influencing market dynamics. The increasing number of insured patients and the expanding scope of coverage for spine procedures are expected to drive market growth. Minimally invasive and robotic surgeries, radiofrequency ablation, and other advanced technologies are also gaining traction due to their ability to improve patient outcomes and postoperative recovery. Competitive advantage is another key consideration for market players, with companies investing in R&D to develop innovative products and technologies. Spinal instrumentation, including spinal implants and spinal stents, are also areas of focus for market participants. Overall, the market in the US is expected to continue its growth trajectory, driven by the increasing prevalence of spinal disorders, technological advancements, and a focus on patient outcomes.
Market Dynamics
Our researchers analyzed the data with 2024 as the base year, along with the key drivers, trends, and challenges. A holistic analysis of drivers will help companies refine their marketing strategies to gain a competitive advantage.
What are the Interventional Spine Devices market drivers leading to the rise in the adoption of Industry?
- The rising prevalence of spine and bone disorders serves as the primary market driver. The market is experiencing substantial growth due to the increasing prevalence of spinal disorders, such as degenerative disc disease, herniated disc, spondylitis, spinal stenosis, spinal tumors, osteoporosis, scoliosis, and other related conditions. According to the National Institutes of Health (NIH), approximately 299 million people are diagnosed with degenerative disease of the lumbar spine annually in the US. Furthermore, around 39 million people suffer from spondylolisthesis, 403 million from symptomatic disc degeneration, and 103 million from spinal stenosis worldwide every year. Healthcare providers are increasingly adopting advanced interventional techniques, including image-guided surgery, to enhance the accuracy and efficiency of spinal procedures.
- These minimally invasive procedures enable faster postoperative recovery and reduced hospital stays. Additionally, the use of bone graft substitutes and spinal cord stimulators is gaining popularity in the treatment of spinal disorders. The competitive advantage of interventional spine devices lies in their ability to offer precise and effective treatment options for various spinal conditions. The market is expected to continue its growth trajectory during the forecast period, driven by the rising demand for minimally invasive procedures and the increasing prevalence of spinal disorders. Healthcare costs, insurance systems, and digital health technologies significantly impact the adoption of interventional radiology products.
What are the Interventional Spine Devices market trends shaping the Industry?
- The emergence of radiofrequency-targeted vertebral augmentation represents a significant market trend in the field of spinal care. This innovative technology offers precise and effective treatment for various vertebral conditions. The market is experiencing significant growth due to the increasing adoption of minimally invasive surgical techniques, such as radiofrequency ablation and robotic surgery, for the treatment of spinal conditions like spinal stenosis. These advanced procedures offer several advantages, including reduced trauma, faster recovery, and improved patient outcomes. For instance, radiofrequency ablation, a novel technique used for the treatment of spinal stenosis, significantly reduces back pain severity, decreases pain medication requirements, and enhances back function. Furthermore, remotely controlled cement delivery during vertebral augmentation procedures helps to minimize radiation exposure. One example of an innovative interventional spine device is Merit Medical's StabiliT System.
- This system combines a targeted approach and ultra-high viscosity cement for the treatment of pathological fractures and reduction of extravasation in the vertebrae. The use of such advanced technologies is expected to propel the market's growth in the coming years. Moreover, the increasing popularity of regenerative medicine and spinal instrumentation is also contributing to the market's expansion. The integration of these technologies with interventional spine devices is expected to provide better clinical outcomes and improve patient satisfaction. The market is witnessing a shift towards advanced and minimally invasive procedures, driven by their numerous benefits, including improved patient outcomes, reduced trauma, and faster recovery times. The adoption of these technologies is set to continue, making the market an exciting space to watch.
How does Interventional Spine Devices market faces challenges face during its growth?
- The availability of multiple treatment alternatives poses a significant challenge to the growth of the industry. This factor necessitates continuous research and development to maintain a competitive edge in the market. Interventional spine procedures offer effective alternatives to opioid analgesic drugs for managing pain. However, the preference for these devices lags behind due to the lower cost and non-invasive nature of pharmaceutical treatments. The competitive landscape is further intensified by the introduction of innovative drug delivery techniques and advanced pain medications.
- Despite these challenges, the demand for interventional pain therapies, including epidural injections, is on a steady rise. According to research, the epidural market experienced a growth of over 120% between 2000 and 2023, and the trend continues with a double-digit growth rate. This increasing demand is driven by the need for non-narcotic treatments for chronic pain, as well as the potential risks and side effects associated with long-term opioid use.
Exclusive Customer Landscape
The interventional spine devices market forecasting report includes the adoption lifecycle of the market, covering from the innovator's stage to the laggard's stage. It focuses on adoption rates in different regions based on penetration. Furthermore, the interventional spine devices market report also includes key purchase criteria and drivers of price sensitivity to help companies evaluate and develop their market growth analysis strategies.

Customer Landscape
Key Companies & Market Insights
Companies are implementing various strategies, such as strategic alliances, interventional spine devices market forecast, partnerships, mergers and acquisitions, geographical expansion, and product/service launches, to enhance their presence in the industry.
Abbott Laboratories - This company specializes in providing advanced interventional spine solutions for managing chronic pain.
The industry research and growth report includes detailed analyses of the competitive landscape of the market and information about key companies, including:
- Abbott Laboratories
- B.Braun SE
- ChoiceSpine LLC
- Globus Medical Inc.
- Integra LifeSciences Holdings Corp.
- Johnson and Johnson Services Inc.
- Life Spine Inc.
- Medtronic Plc
- Merit Medical Systems Inc.
- MicroPort Scientific Corp.
- NuVasive Inc.
- Orthofix Medical Inc.
- Spinal Elements Inc.
- Stryker Corp.
- Zimmer Biomet Holdings Inc.
Qualitative and quantitative analysis of companies has been conducted to help clients understand the wider business environment as well as the strengths and weaknesses of key industry players. Data is qualitatively analyzed to categorize companies as pure play, category-focused, industry-focused, and diversified; it is quantitatively analyzed to categorize companies as dominant, leading, strong, tentative, and weak.
Recent Development and News in Interventional Spine Devices Market
- In January 2024, Medtronic, a leading medical technology company, announced the launch of its new Infinity PRO Dynamic Anterior Cervical Spinal System. This innovative product offers personalized spinal implants, designed to address individual patient needs and improve clinical outcomes (Medtronic Press Release, 2024).
- In October 2024, Johnson & Johnson's DePuy Synthes received FDA approval for its Mobi-C cervical disc, marking the first-ever FDA approval for a single-use, anterior cervical disc replacement device with MRI labeling (FDA News Release, 2024).
- In March 2025, NuVasive, a leading spine technology company, unveiled its Pulse platform, a game-changing, digitally-integrated system designed to improve surgical efficiency and patient outcomes. This technological advancement is expected to revolutionize the market (NuVasive Press Release, 2025).
Research Analyst Overview
The market continues to evolve, driven by advancements in technology and growing demand for minimally invasive procedures. Interbody cages, one such device, play a crucial role in spinal fusion procedures, enabling the growth of new bone tissue and promoting better patient outcomes. The market dynamics are shaped by various factors, including the increasing prevalence of spinal conditions such as herniated discs, spinal stenosis, and degenerative disc disease. The application of interventional spine devices extends beyond spinal fusion to include interventional pain management, drug delivery systems, and image-guided surgery. These technologies offer clinical advantages, such as improved accuracy, reduced postoperative recovery time, and enhanced quality of life for patients. However, concerns around patient data safety and cybersecurity threats persist, making it crucial for healthcare professionals to prioritize data security and ensure compliance with healthcare insurance systems and medical tourism regulations.
The market is further influenced by regulatory requirements, insurance coverage, and the emergence of outpatient surgery centers and ambulatory surgery centers. Orthopedic surgeons and healthcare providers continue to adopt these technologies to enhance patient care and improve clinical outcomes. The ongoing development of technologies like stem cell therapy, regenerative medicine, robotic surgery, and pedicle screws is shaping the future of the market. These innovations offer potential competitive advantages and are expected to transform the landscape of spine care. The evolving nature of the market is also reflected in the increasing number of clinical trials exploring the potential of interventional spine devices in various applications. The market is expected to continue unfolding, driven by the ongoing quest for better patient outcomes and the pursuit of technological advancements.
Dive into Technavio's strong research methodology, blending expert interviews, extensive data synthesis, and validated models for unparalleled Interventional Spine Devices Market insights. See full methodology.
|
Market Scope |
|
|
Report Coverage |
Details |
|
Page number |
263 |
|
Base year |
2024 |
|
Historic period |
2019-2023 |
|
Forecast period |
2025-2029 |
|
Growth momentum & CAGR |
Accelerate at a CAGR of 10.2% |
|
Market growth 2025-2029 |
USD 4.58 billion |
|
Market structure |
Fragmented |
|
YoY growth 2024-2025(%) |
9.4 |
|
Key countries |
US, Canada, Germany, UK, China, France, Mexico, Japan, Italy, and Brazil |
|
Competitive landscape |
Leading Companies, Market Positioning of Companies, Competitive Strategies, and Industry Risks |
What are the Key Data Covered in this Interventional Spine Devices Market Research and Growth Report?
- CAGR of the Interventional Spine Devices industry during the forecast period
- Detailed information on factors that will drive the growth and forecasting between 2025 and 2029
- Precise estimation of the size of the market and its contribution of the industry in focus to the parent market
- Accurate predictions about upcoming growth and trends and changes in consumer behaviour
- Growth of the market across North America, Europe, Asia, and Rest of World (ROW)
- Thorough analysis of the market's competitive landscape and detailed information about companies
- Comprehensive analysis of factors that will challenge the interventional spine devices market growth of industry companies
We can help! Our analysts can customize this interventional spine devices market research report to meet your requirements.
 RIA -
RIA - 
